Chart Vizzard
Vizzlo's AI-based chart generatorHalf Pie Chart
Create a beautiful half-pie chart in seconds (with no tricks or workarounds as in Excel) to present your data.
Features
- Custom colors and number formats
- Custom connectors and labels
- Exploded segments
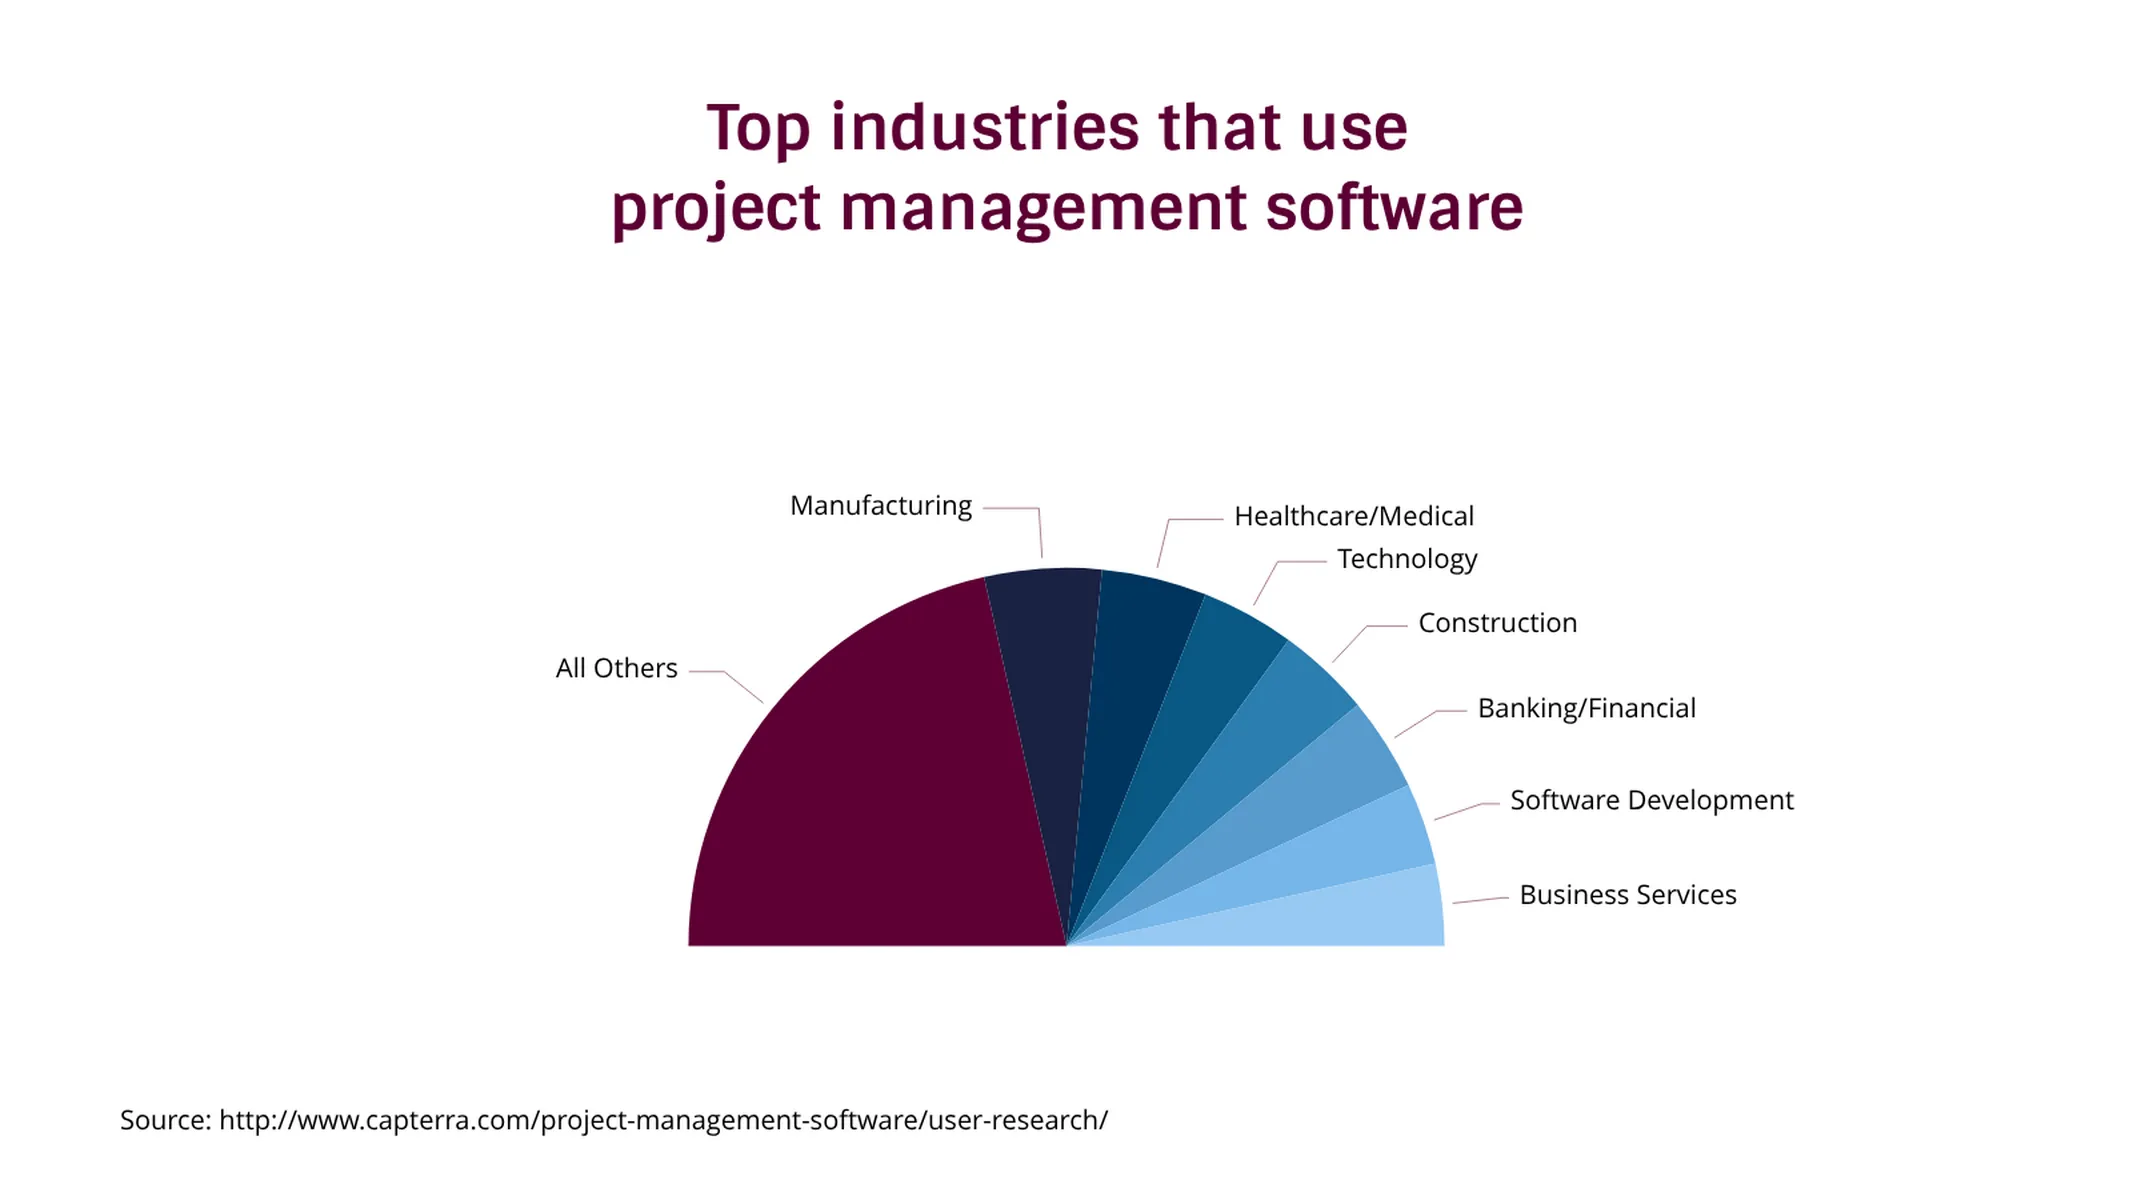
- Optional sorting by value
- Optional cut-out (half donut chart)
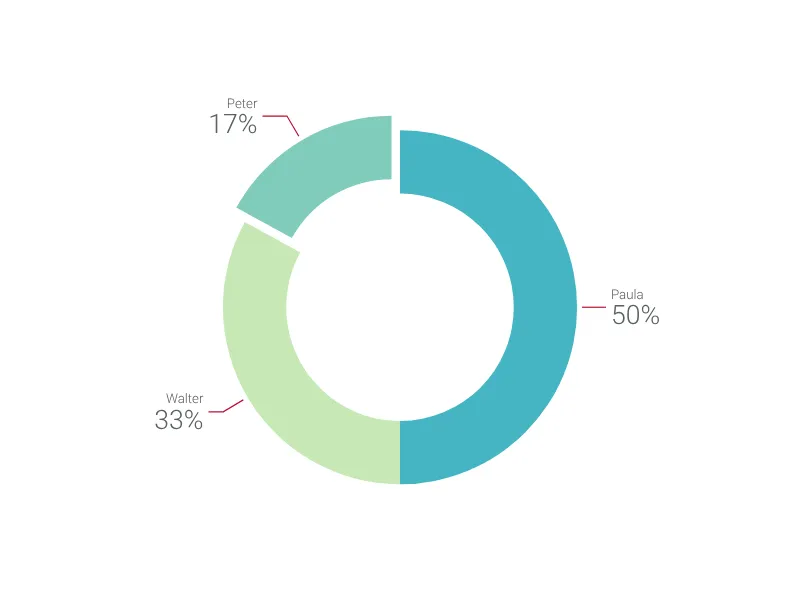
What is a half pie chart?
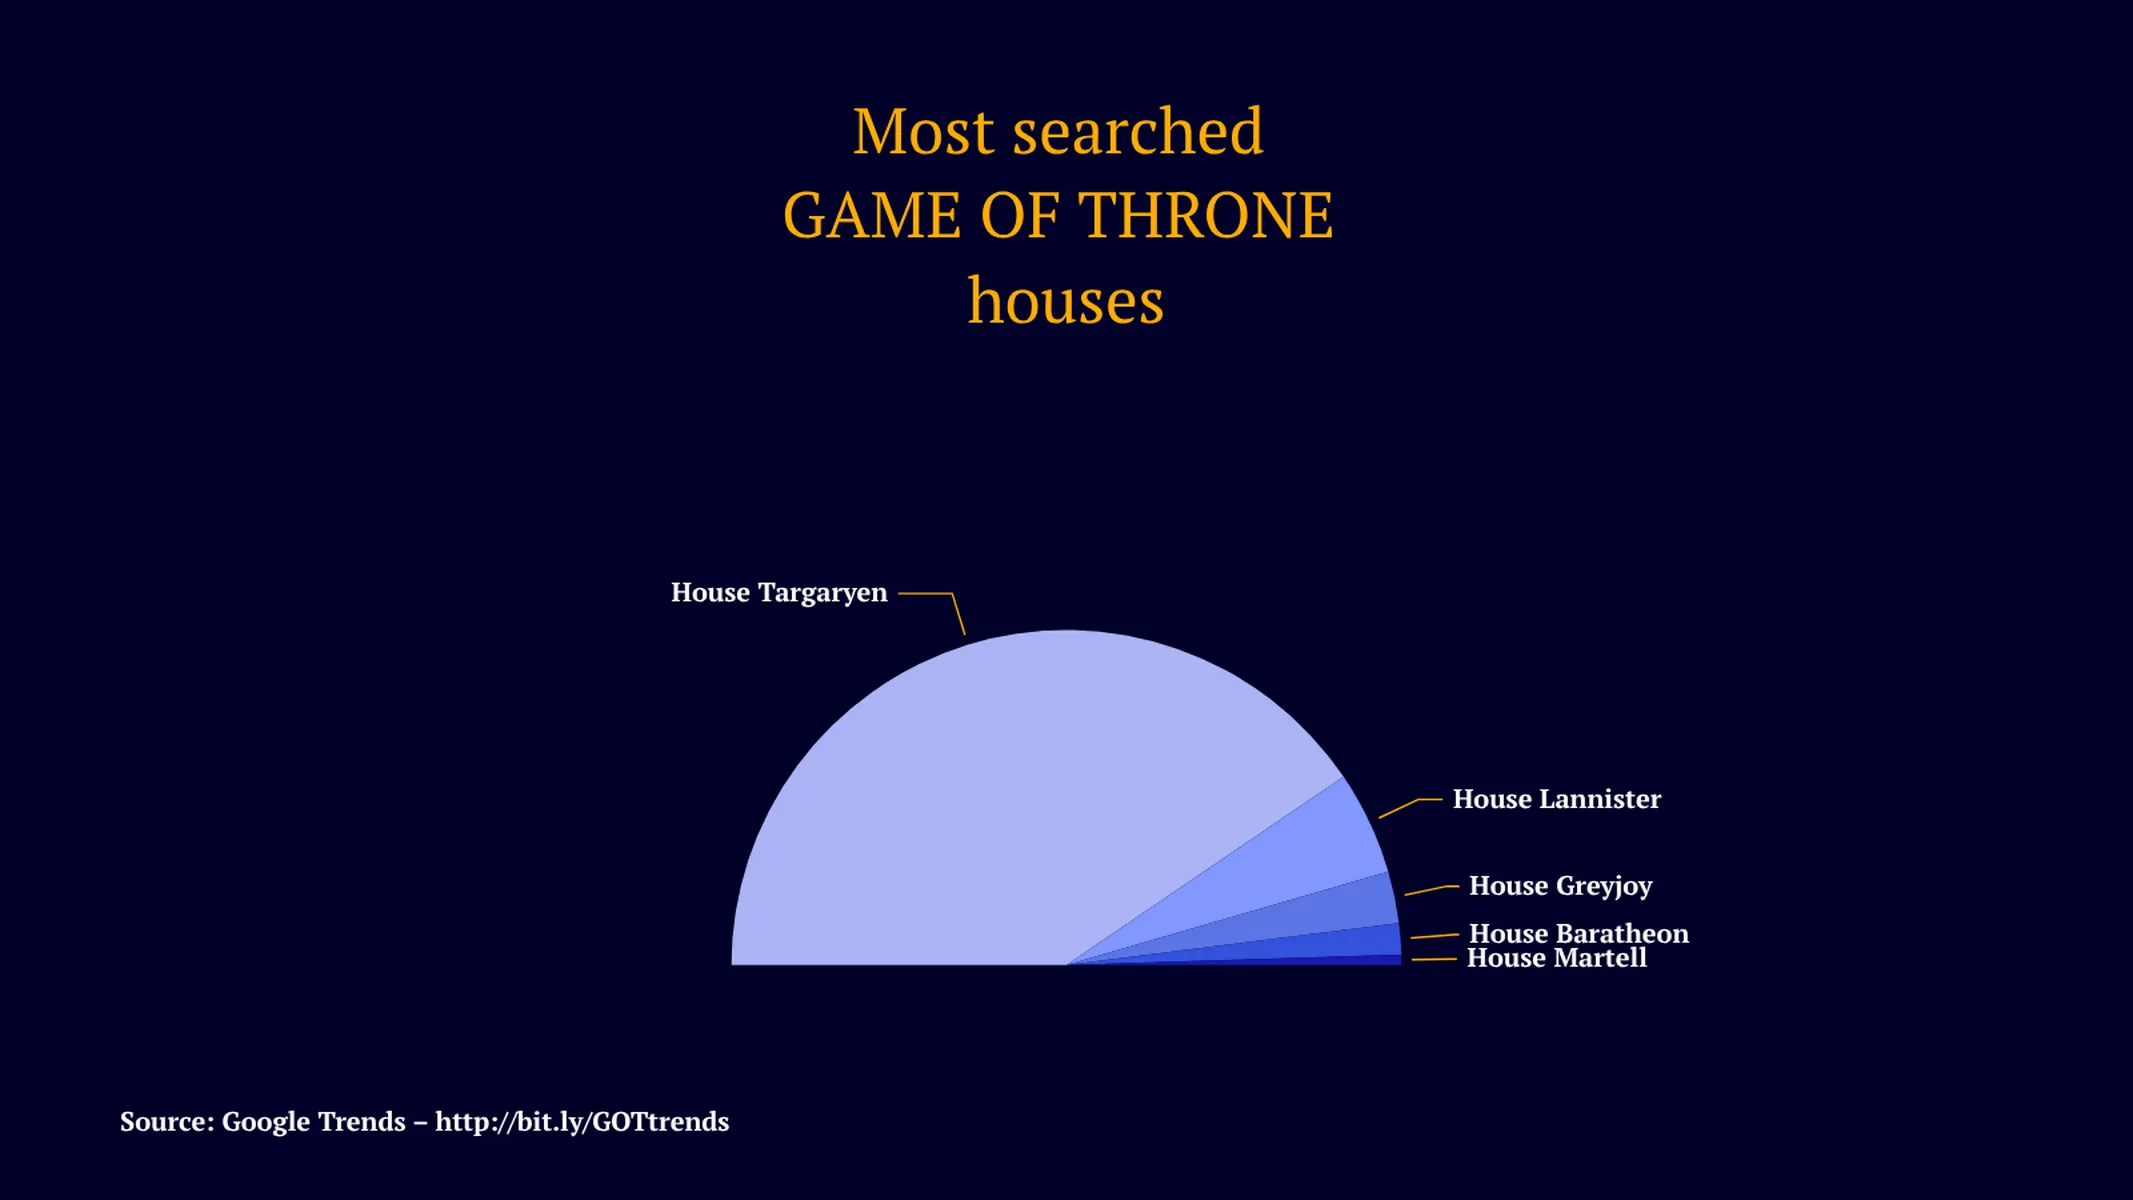
A half pie chart (also, half moon or semicircle chart) is a 180 degrees graph that represents the composition of a whole. Its total arc area corresponds to 100%, and its slices illustrate the part-to-whole relationships.
The half pie chart works like a regular pie chart. Its main advantage over the full circle graph is that it takes less space in your layout.
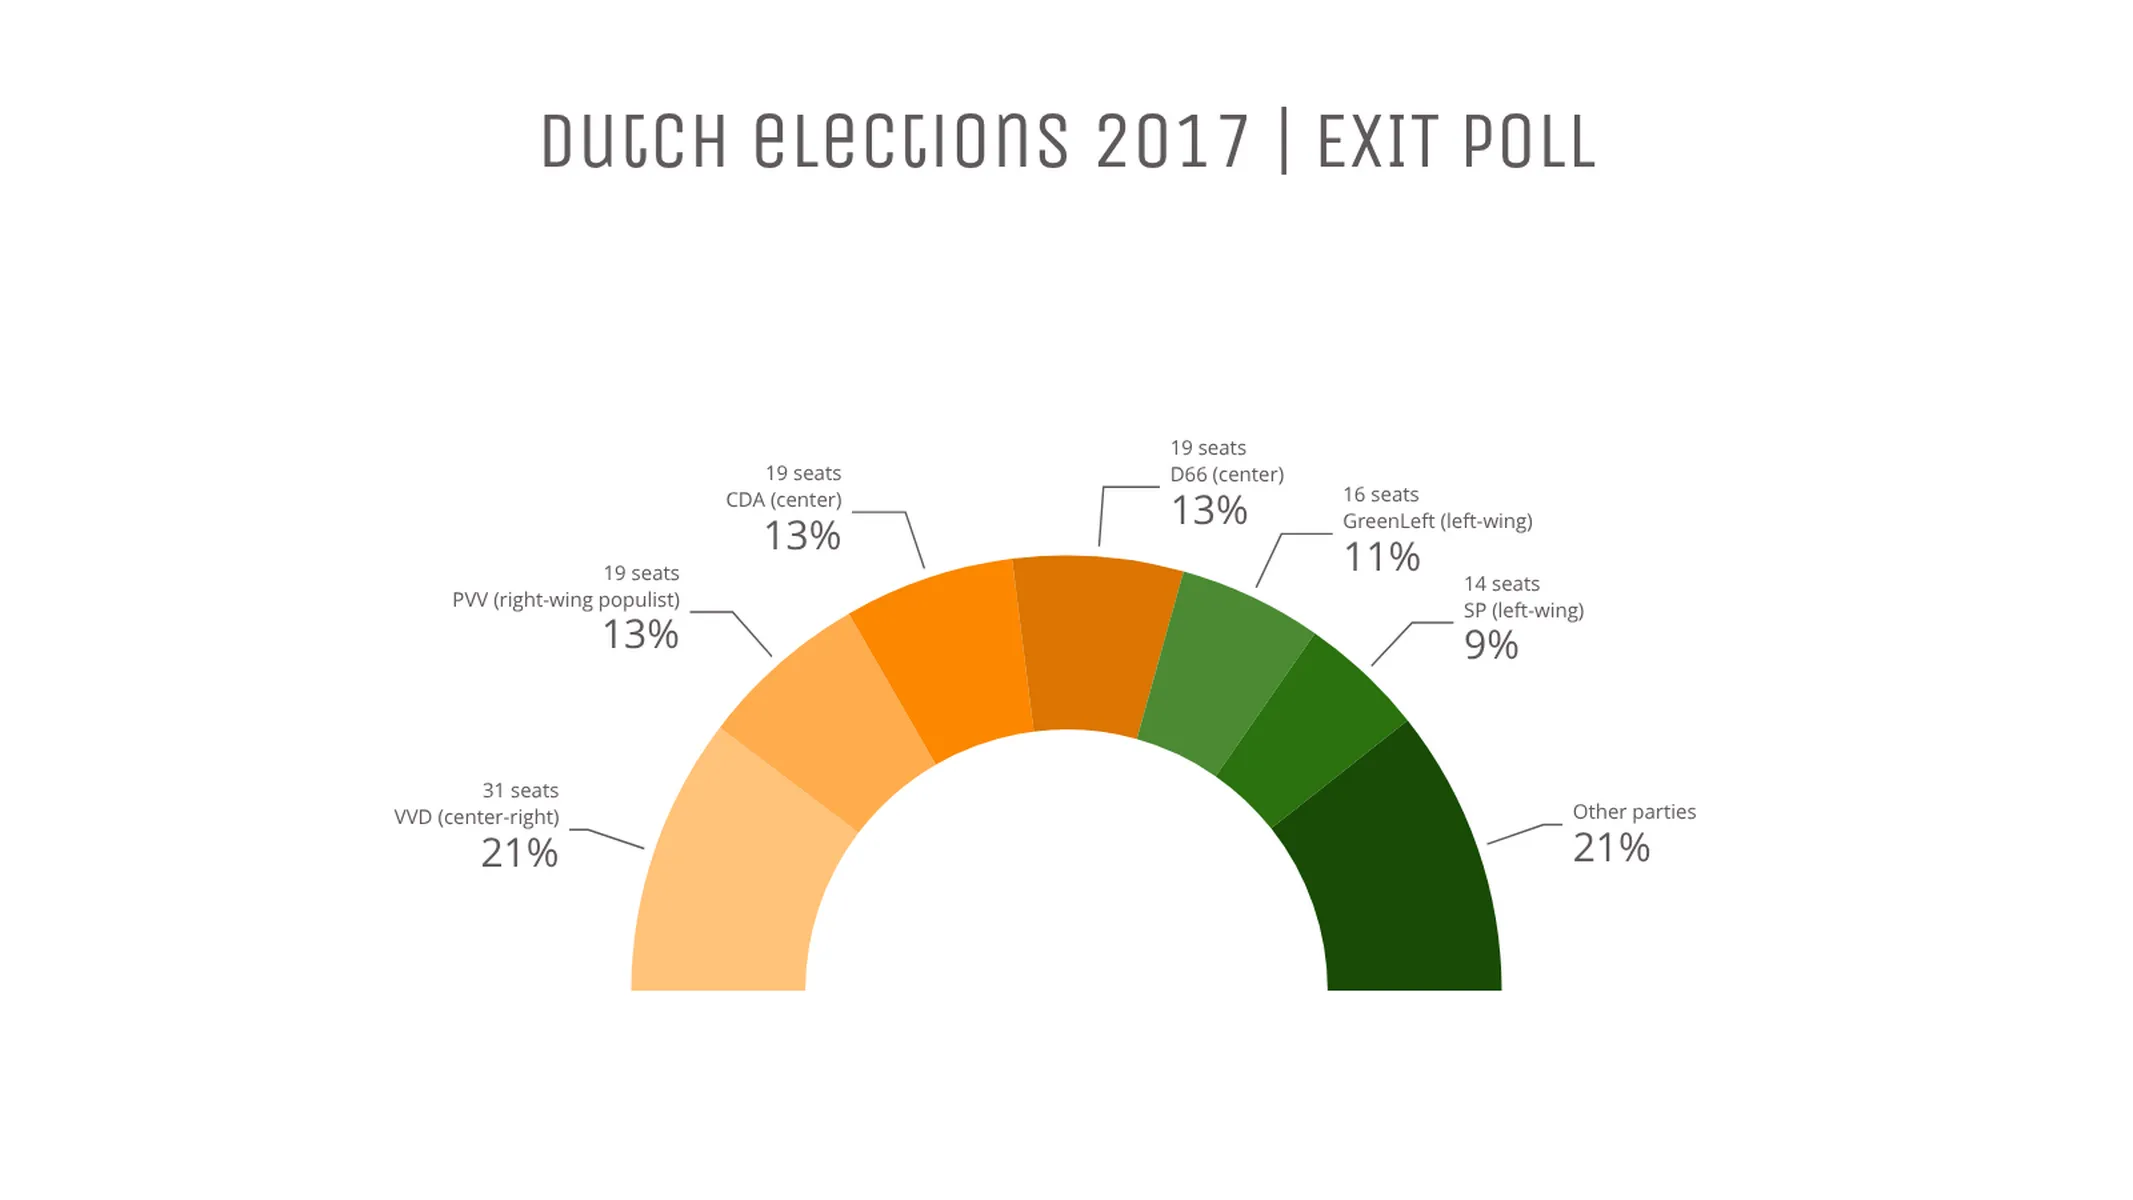
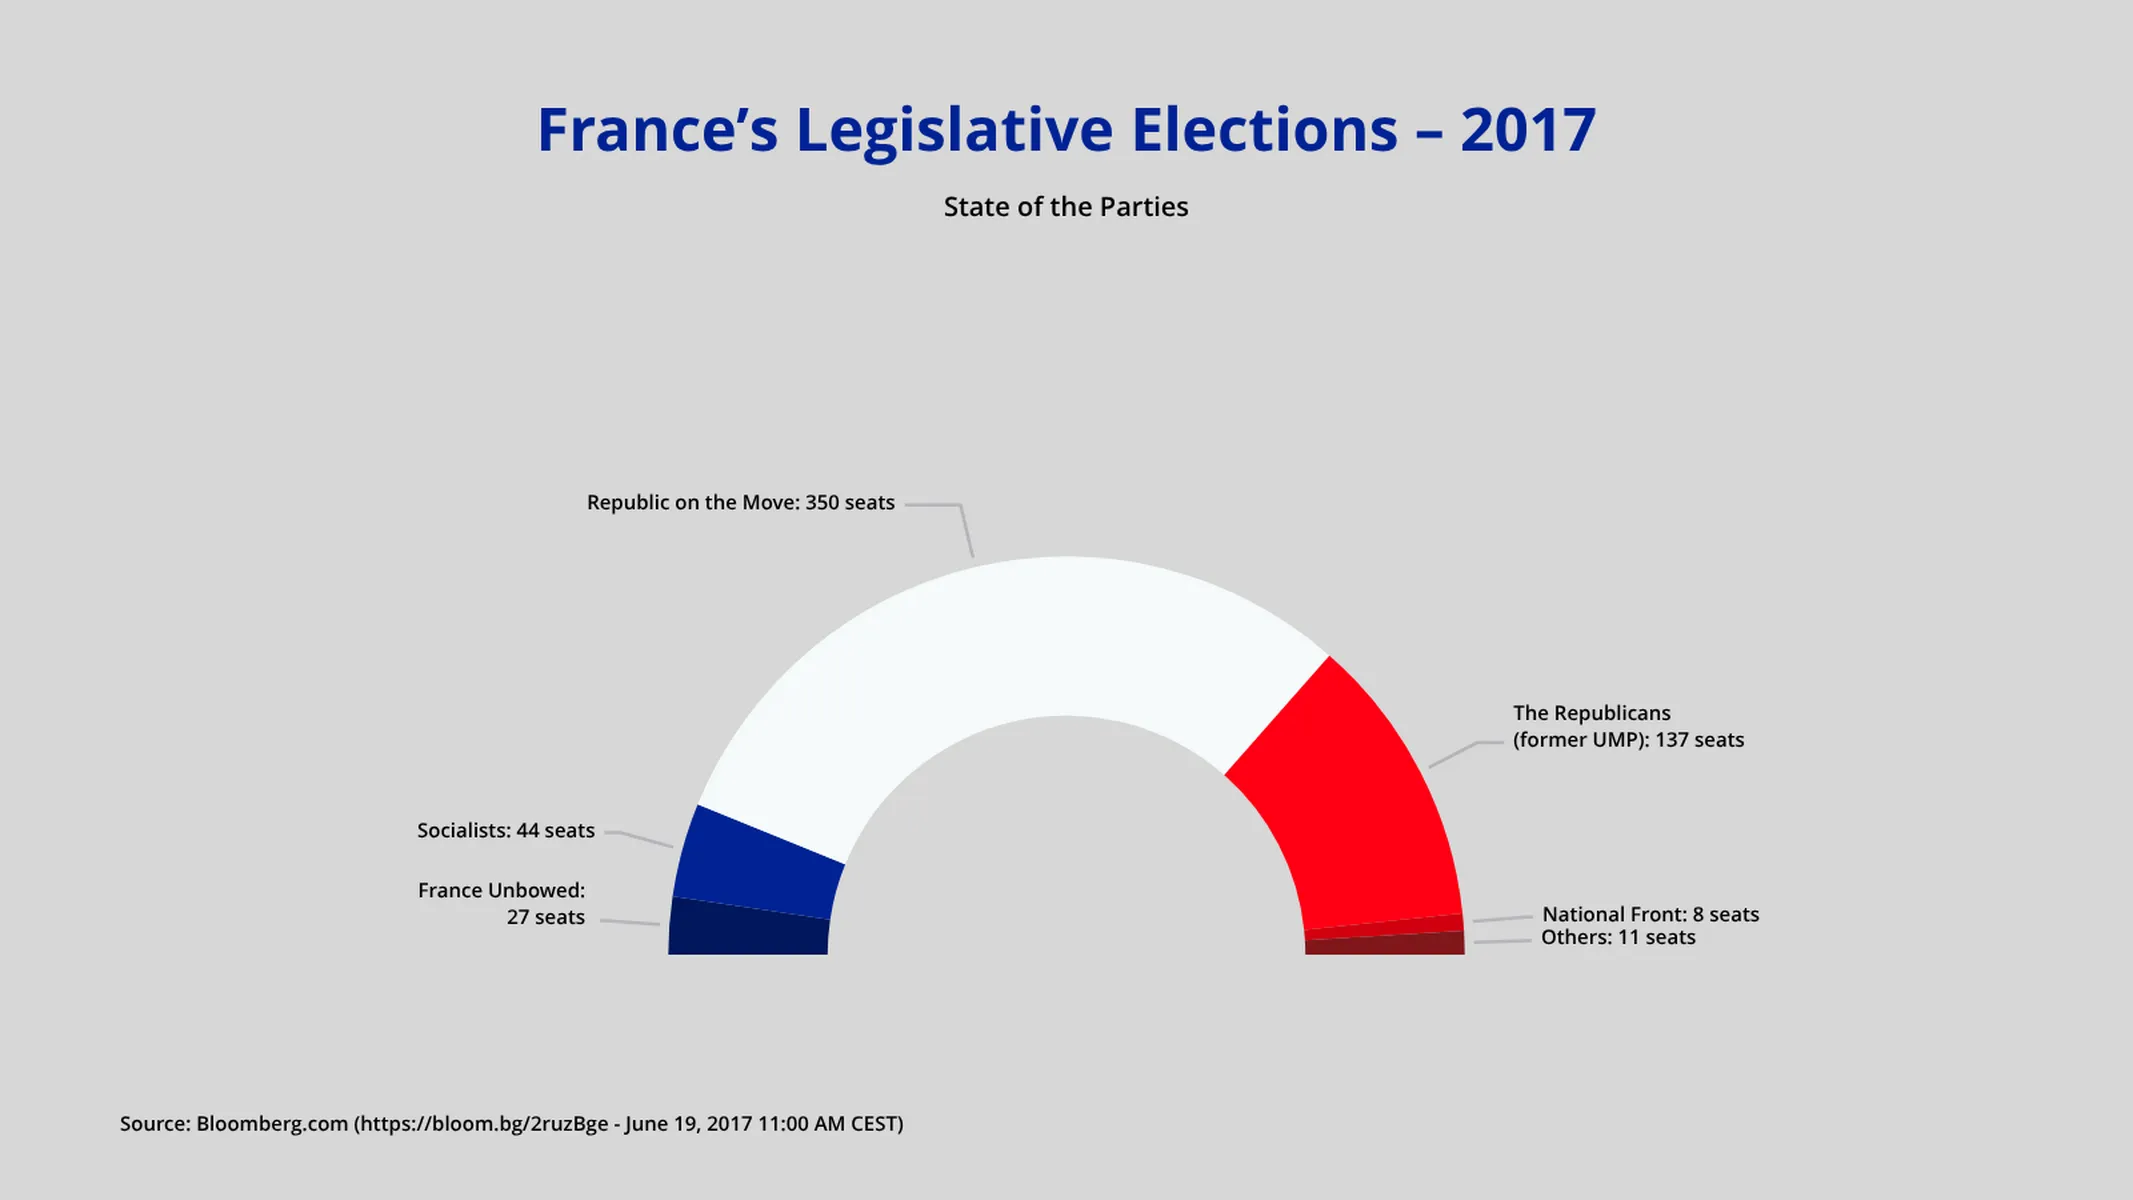
Because its form corresponds to the broadly adopted Parliament hemicycle, the half pie chart is often used to illustrate elections results and the composition of legislatures and assemblies. In this case, the slices are usually plotted with the political colors associated with the parties, and they are organized according to the seating plan of the house or the ideological positions, from left to right.
How to make a half pie chart with Vizzlo?
Make your half pie chart online and export it to presentations and reports with ease. Check the examples to get inspired and follow these easy steps:
- Click on the elements to edit them. Use the active cards in the sidebar as support.
- Click on the “plus” button on the chart to add new slices.
- Alternatively, copy and paste your data into Vizzlo’s spreadsheet (tab “DATA”).
- Select a slice and check the box “Exploded slice” in its active card to explode it (you can also right-click for this).
- Customize the display of labels, values, and lines, using the options of the tab “APPEARANCE.”
Half Pie Chart: What's new?
These chart types now all support adding custom formatting to individual value labels.
Half Pie Chart Alternatives
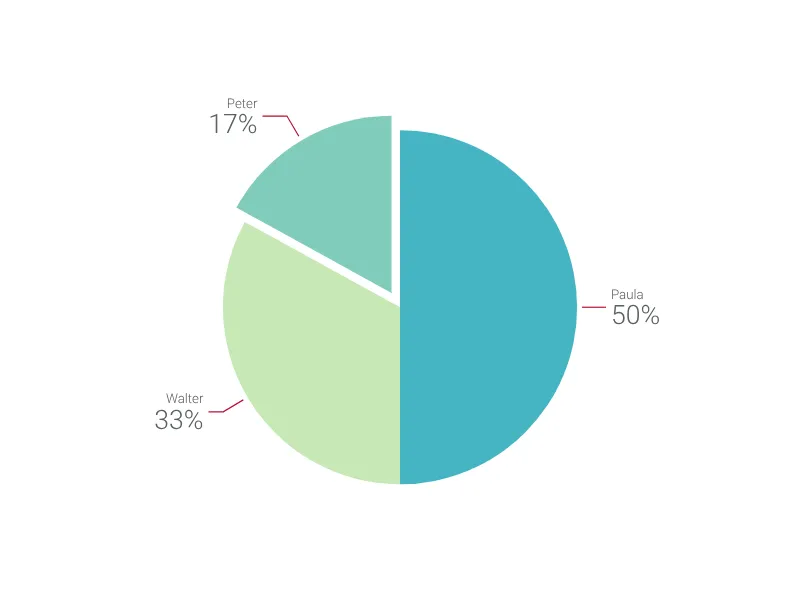
Use Cases
Circular chartsEnhance your productivity
Create a Half Pie Chart directly in the tools you love

Create a Half Pie Chart in PowerPoint with
Vizzlo's add-in

Loved by professionals around the world


Visualizations your audience won’t forget
Convey abstract concepts and data with professionally designed
charts and graphics you can easily edit and customize.