Chart Vizzard
Vizzlo's AI-based chart generatorCreate your Slopegraph in seconds
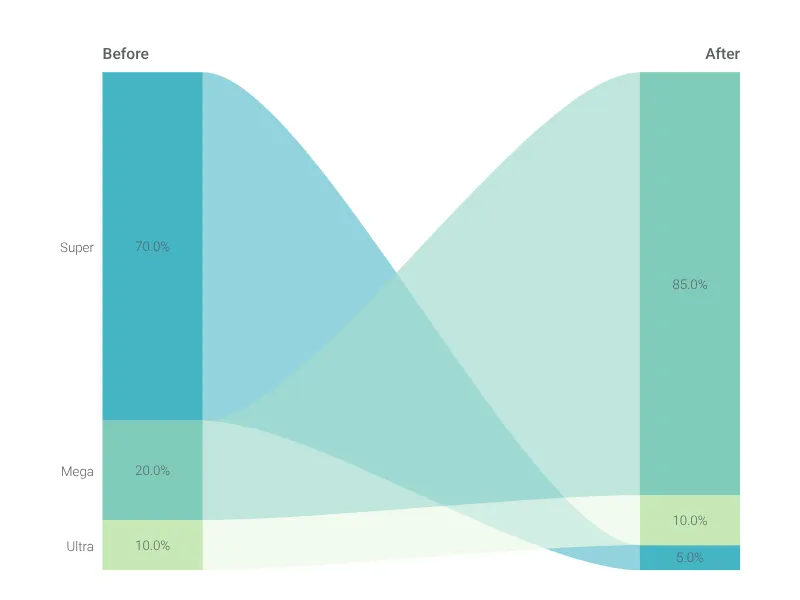
Visualize a before and after story with a focus on slopes.

Create your chart in 3 simple steps
- Create new Slopegraph
- Add your data
- Export or share
Why Vizzlo?
- Create professional charts in seconds
- Fully customizable, no design skills needed
- Create directly in PowerPoint & Google Slides
What is a slopegraph?
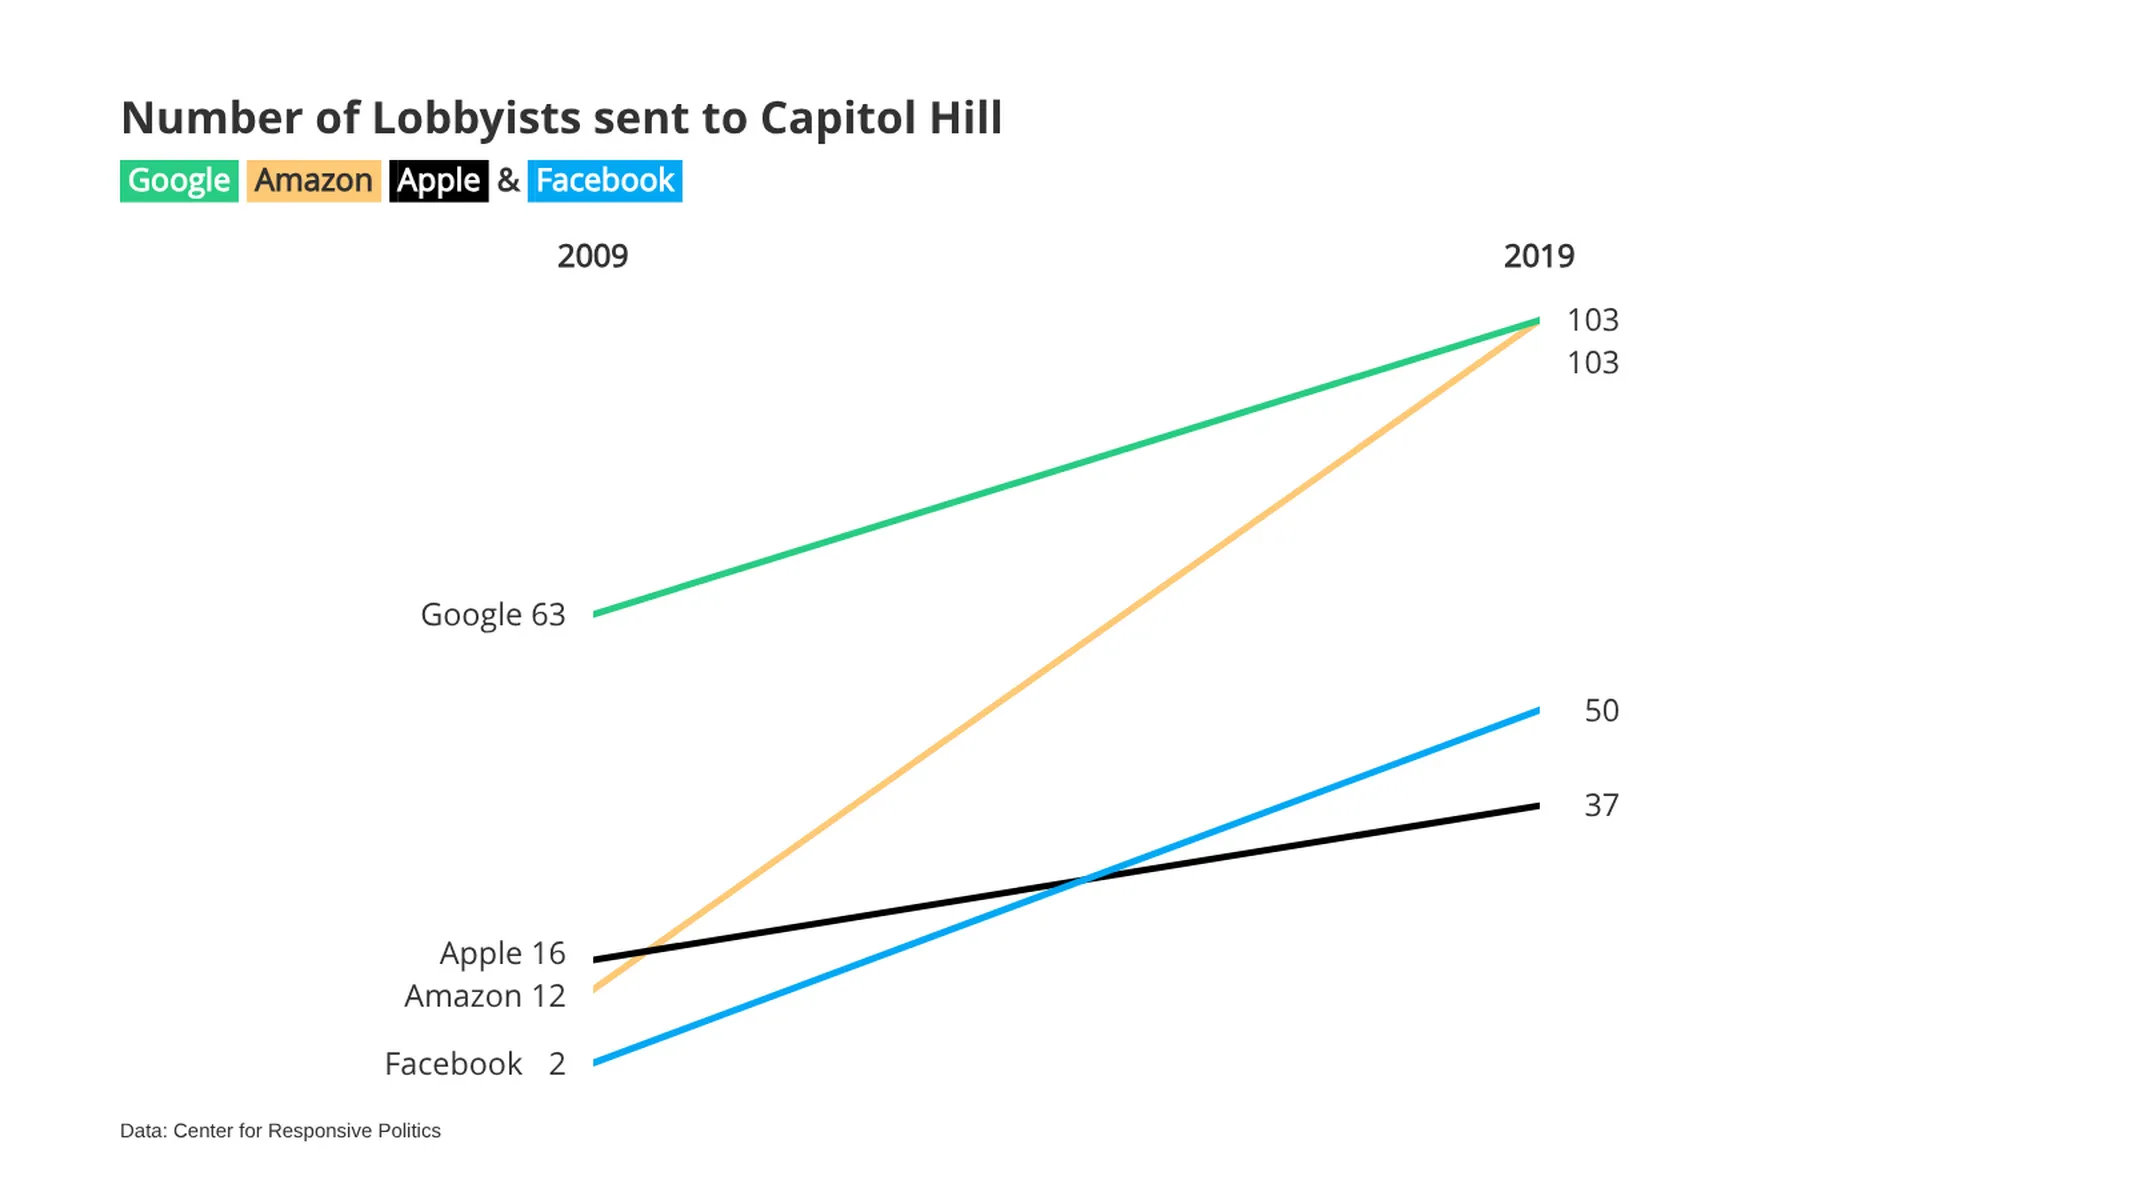
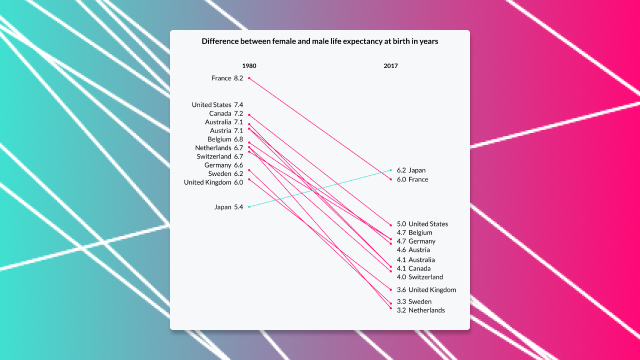
A slopegraph is a table-like visualization. It is simple, yet it communicates complex information. Typically, the chart tells a before and after story. Across the axis, the chart compares numbers over time. Reading the chart vertically on either side, it ranks a discrete variable.
The chart is revealing ranking, magnitude, and changes over time. The slopes indicate unusual patterns. The chart also goes by the name parallel coordinates. According to Edward Tufte, bumps charts can also be considered slopegraphs.
A brief history of the slopegraph
Edward Tufte, in his 1983 book The Visual Display of Quantitative Information, first showed a “table-graphic [that] organizes data for viewing in several directions.” Since then, slopegraphs become widely popular among data visualization experts for their rather simple, yet elegant design and their ability to carry a lot of information.
Best uses for a slopegraph
- compare values for many categories over two points in time
- display complex information hierarchically
- slopegraphs focus on changes
Slopegraph maker: key features
- change the color of the lines depending on their slope
- show or hide axis labels and values on either side
- adjust line width for all slopes simultaneously or individually
- show or hide grid and axis lines
- indicate line ends with a dot
Resources
Slopegraph: What's new?
Now supports individual value styling.
Most of our data visualisations now support SI prefixes, advanced number format options for axes and shown data labels.

Easier number formatting through some changes in the user interface. Showing and hiding values is possible in the same place as you format them.
We have completely revamped our slopegraph!
- Set colors differently for decreasing, increasing or equal values
- Adjust the line width for all lines or a single line
- Show/hide labels, values and legend
- Change the document layout and much more!
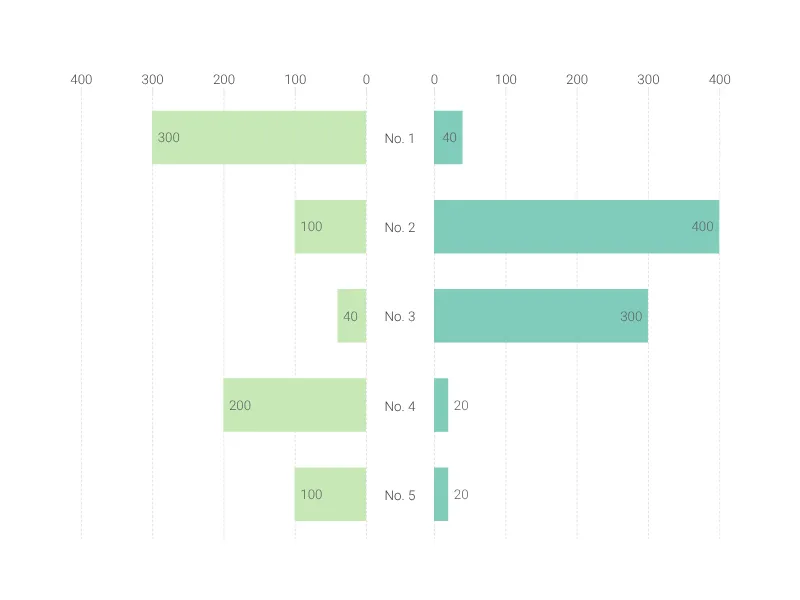
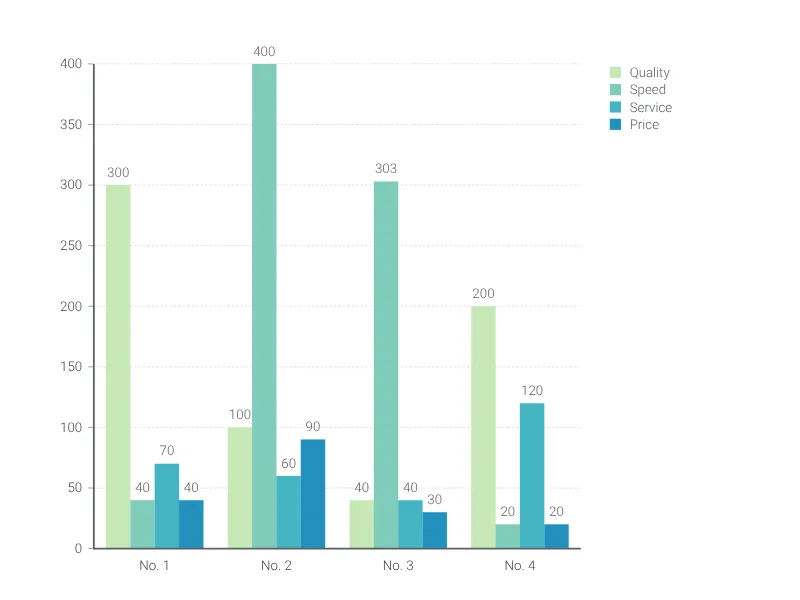
Slopegraph Alternatives

Enhance your productivity
Create a Slopegraph directly in the tools you love

Create a Slopegraph in PowerPoint with
Vizzlo's add-in

Loved by professionals around the world


Visualizations your audience won’t forget
Convey abstract concepts and data with professionally designed
charts and graphics you can easily edit and customize.