Chart Vizzard
Vizzlo's AI-based chart generatorHow to Create a Pie Chart in Excel
Let’s be honest, Excel is neither the quickest nor the most beautiful way to create a pie chart - so we’ve added the Vizzlo method in the video below to show you a better way, with the step-by-step Excel instructions just a short scroll beneath.
Getting Started
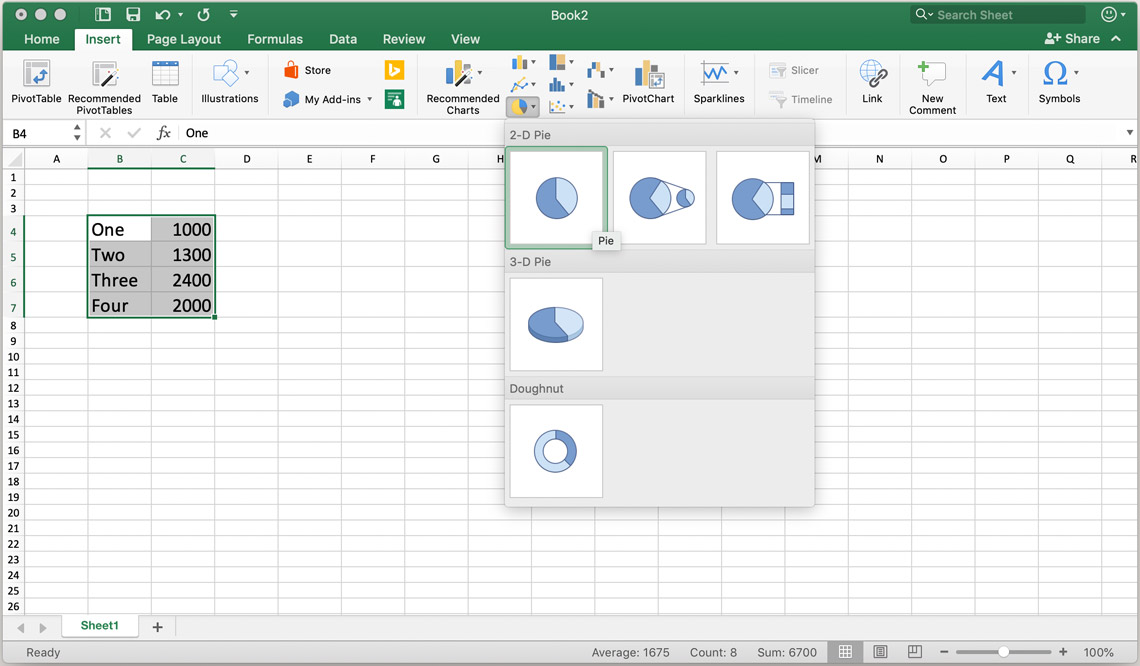
Start with a blank worksheet in Excel and enter your data. Keep in mind, that a pie chart can only visualize a single data series. Select your data set and in the “Insert” tab, then select the pie chart from the chart options. You can select between different styles like 2-D or 3-D and a Doughnut chart.
For a bigger selection of designer-grade pie chart variants, check out our pie chart creator!
Edit Data
To edit any of your data, you don’t need to create a new chart. You can simply change the data and your chart should update automatically. If it’s implemented in other office documents, it should update there as well. For third-party documents, you need to insert your updated chart again.
Design
Once you created your pie chart, you have the option to edit the design of the chart either by selecting one of the pre-made designs as well as changing color schemes in the “Chart Design” tab. Alternatively, right-click on the pie chart and select “Format Data Series” and choose your colors, gradients, opacity, and other elements like a glow or 3-D and shading.

However, if you want pre-made, easy-to-edit, designer-grade color schemes and design variants, check out our free pie chart creator!
Slice Positioning
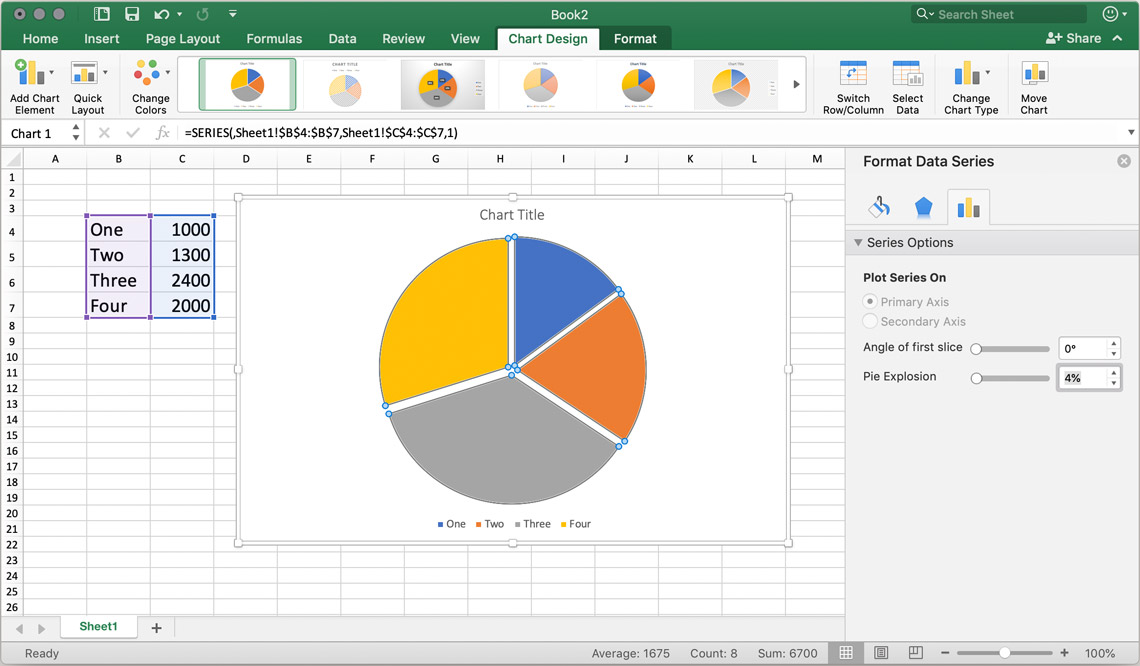
To rotate your pie chart in Excel, select “Format Data Series” and, under “Series Options,” rotate by changing the “Angle of First Slice” slider until you reach the desired position.
To explode your slices, either click and drag the slide you want to explode or, if you want to explode all slices evenly, use the “Point Explosion” slider also under the “Series Options.”
Move Chart
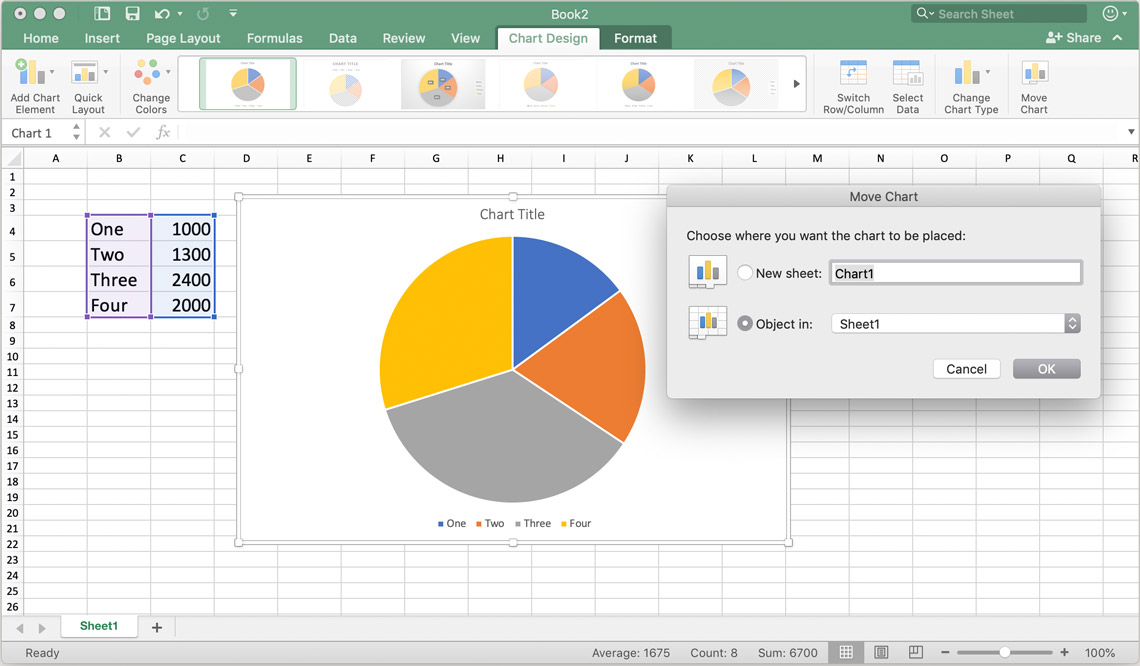
To re-position your chart, simply click and drag it to the desired position. If you want to move the chart to another sheet, right-click it, select “Move Chart” and choose either an existing sheet or create a new sheet to move it to.
Change Font
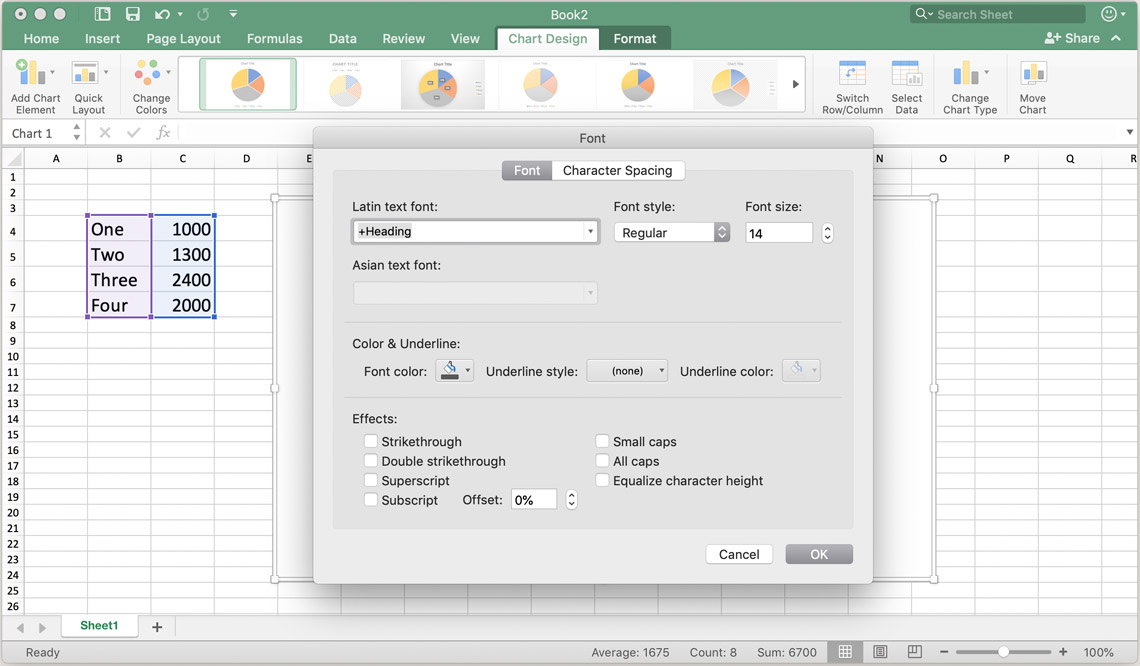
To change the font of any of your text boxes, right-click them and select “Font….” In the following menu you can edit the font, size, spacing, color, and add some additional design effects.
If you want an easier way to create and customize a pie chart, why not check out our pie chart Vizzard page!
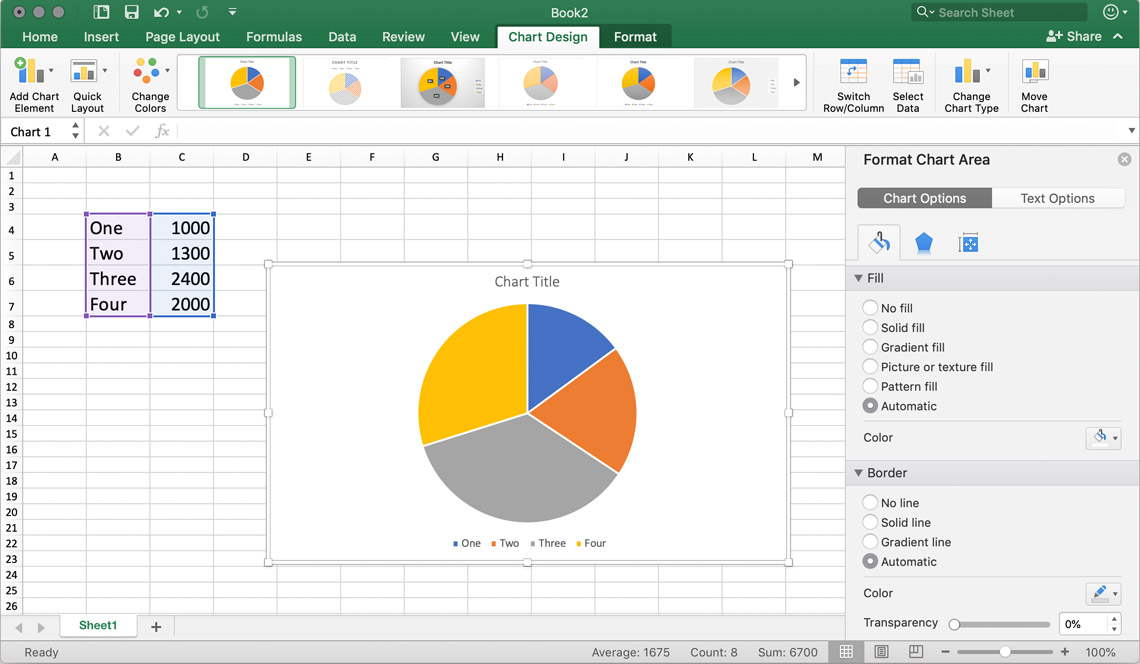
Edit Background
To edit the background, right-click the chart area, and select “Format Chart Area—” here you have the options to change borders, fill, and size of the whole chart, and add glow and 3-D effects. You also edit the text elements under the “Text Options” field. However, keep in mind that all text formats you change here will apply to any text, meaning title, legend, and labels. To edit them individually, follow the steps below:
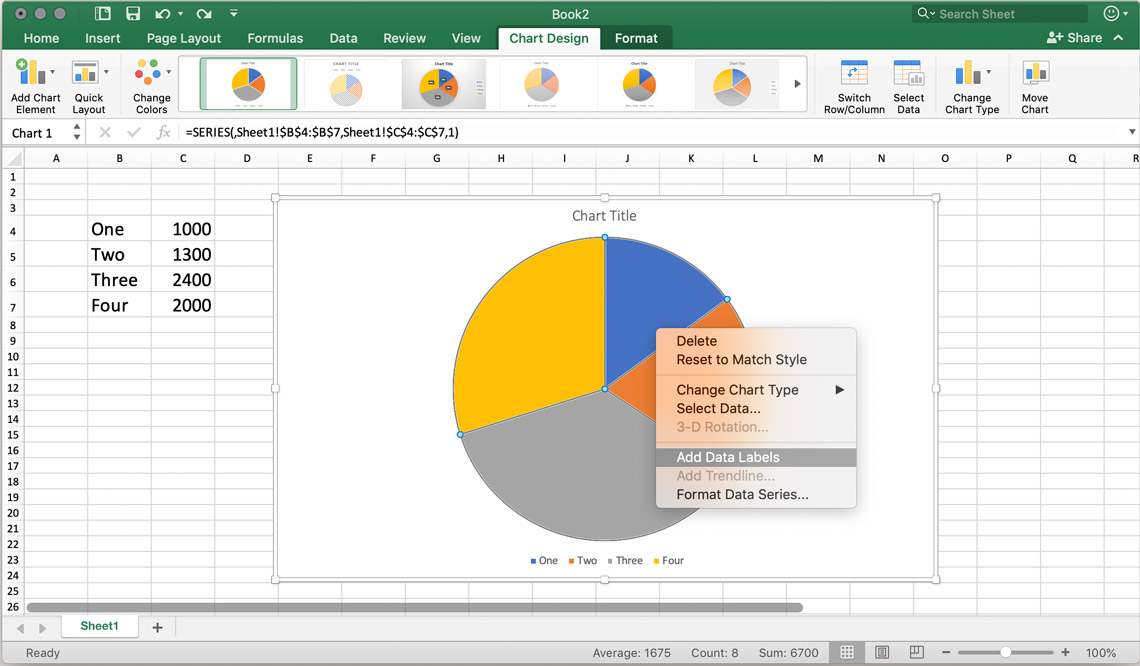
Labels & Title
Data labels should automatically appear when creating your chart. If this is not the case, right-click your chart and select “Add Data Labels.” To edit size and color, right-click one of the labels and select “Edit Data Labels”. To re-position your labels, simply click and drag them to the desired position.
To format the chart title, right click it and select “Format Chart Title.”
For an easier way to add and re-position labels, check out our free pie chart Vizzard!
Legend
To edit the legend, simply right-click your legend and select “Format Legend” to change the position, as well as color and design options like gradients or opacity.
Start designing your own charts and business graphics.
Try Vizzlo for free