Chart Vizzard
Vizzlo's AI-based chart generatorFisher's iris data

Today (February 17th) would be statistician Sir Ronald Aylmer Fisher’s 130th birthday!
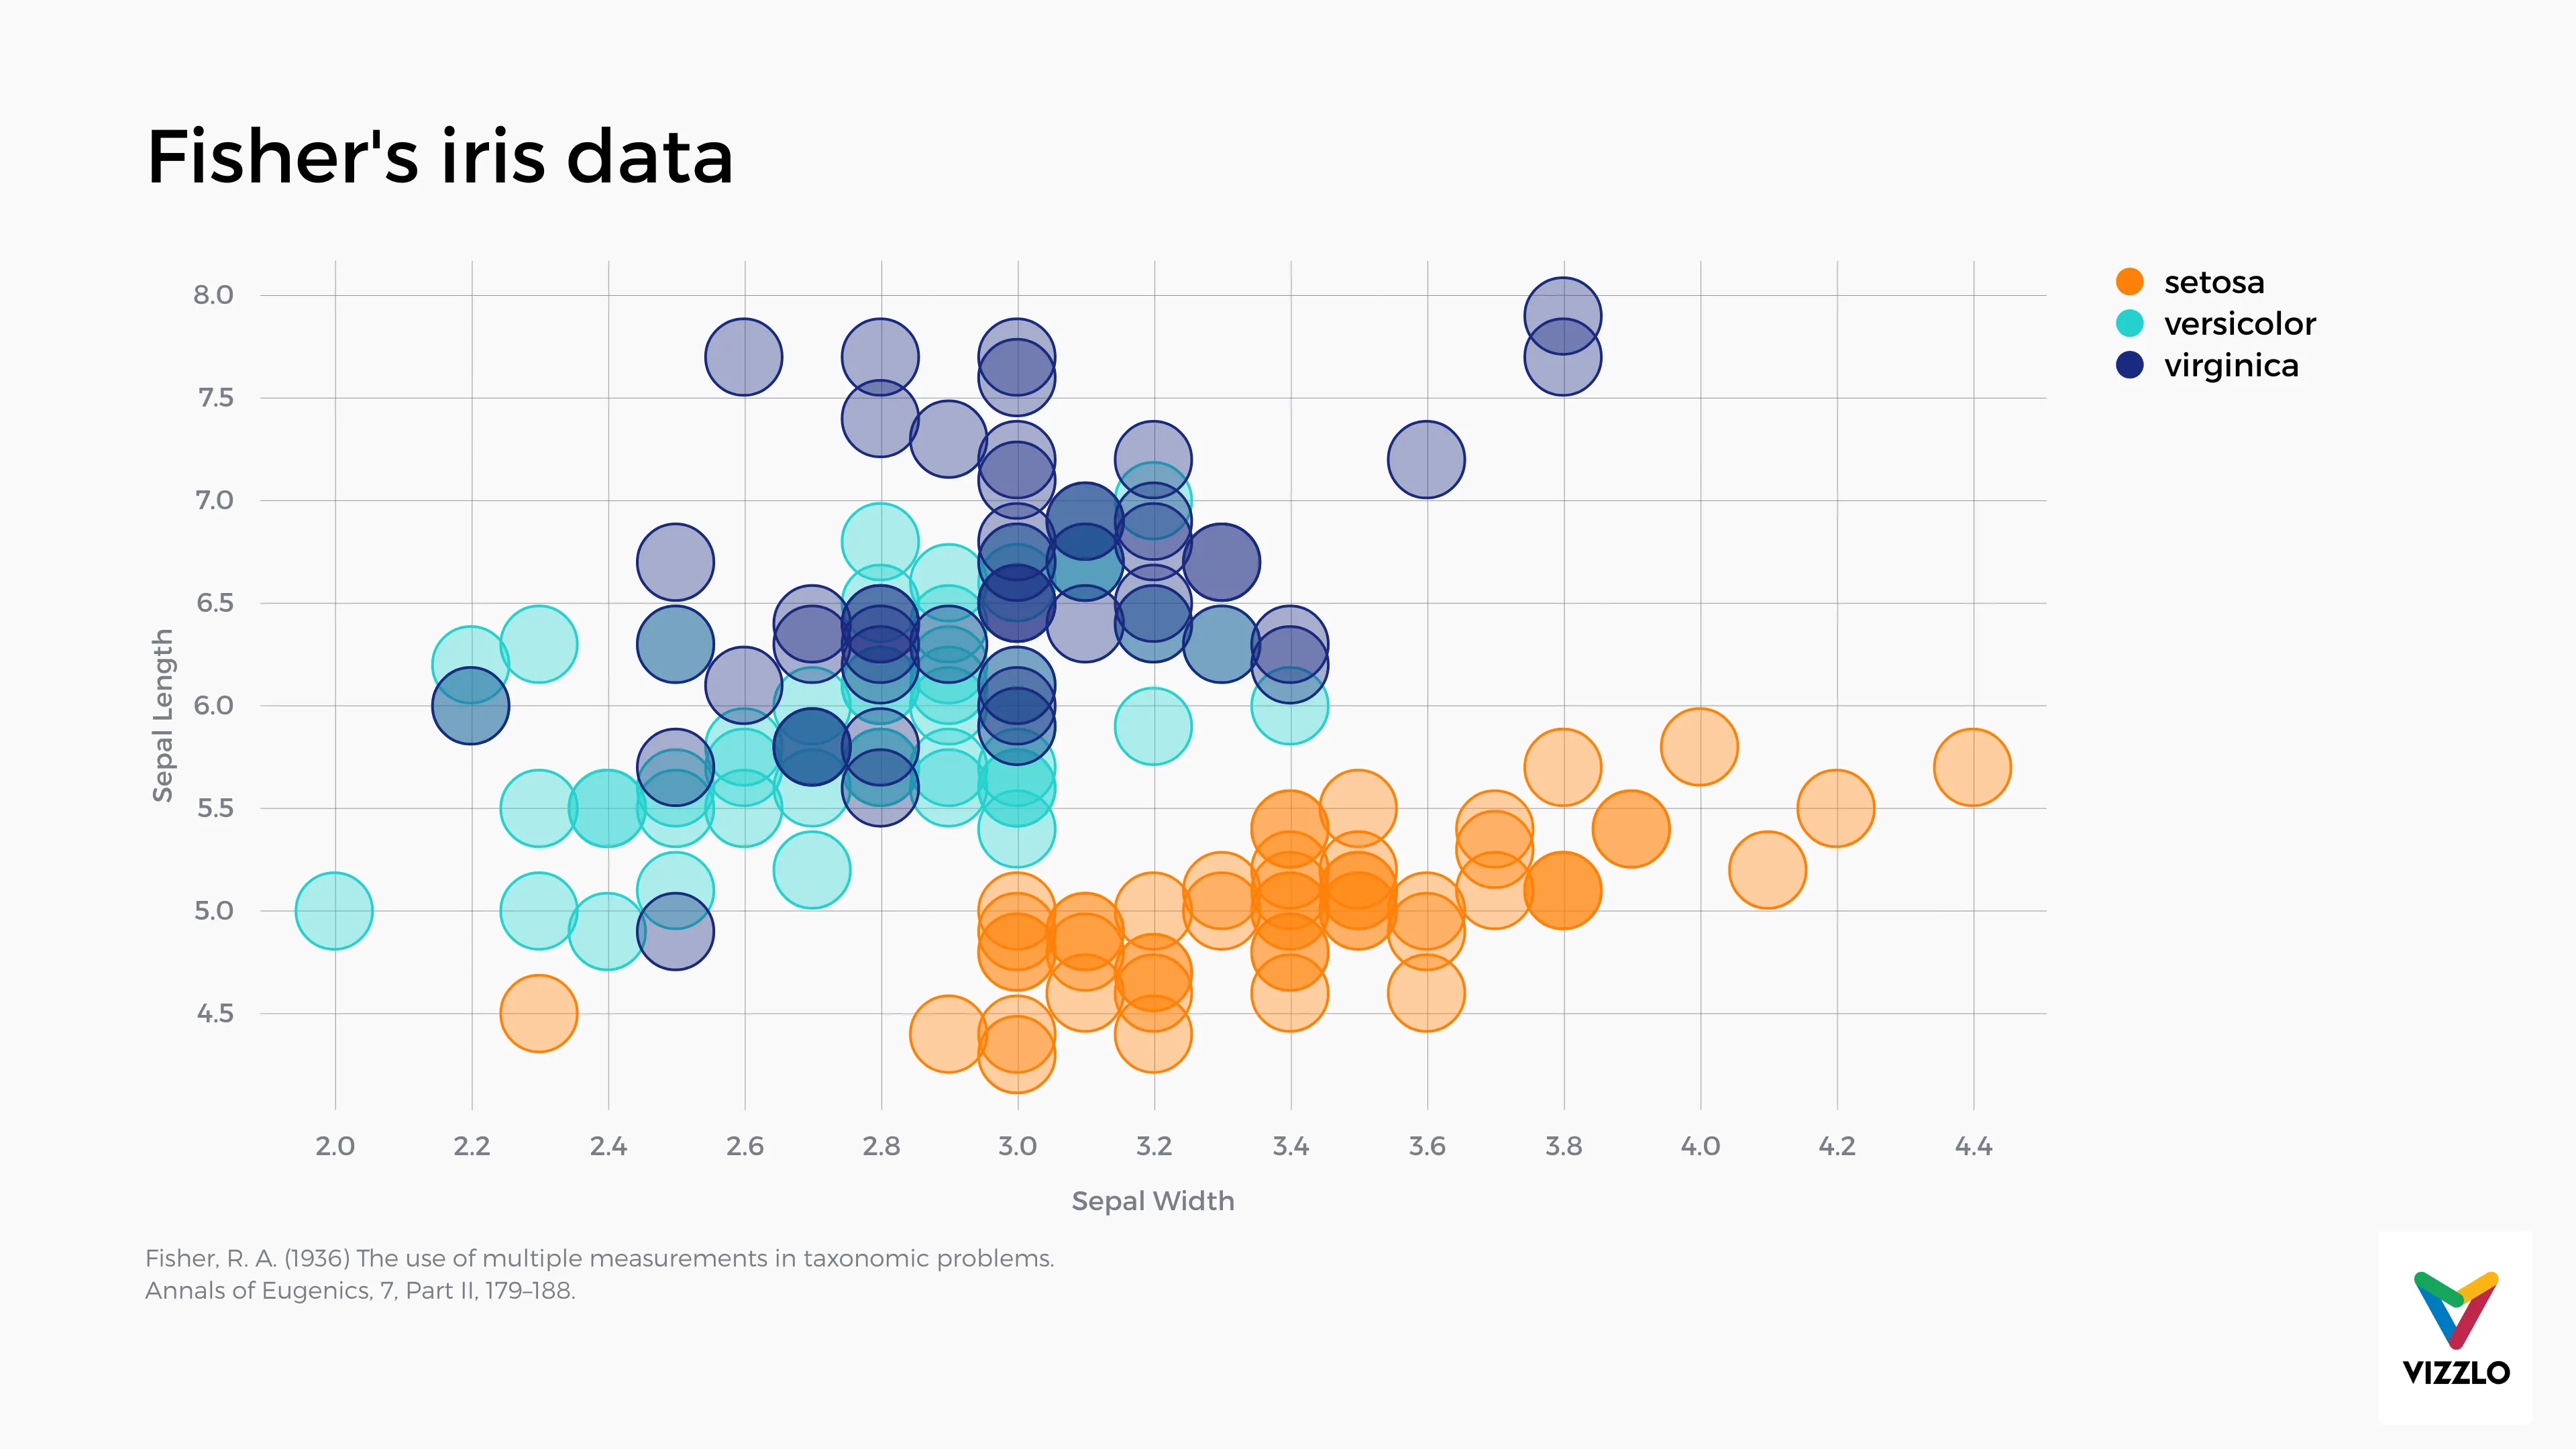
Famous for his contributions to biology, creating the foundations for modern statistical science, and (most importantly for datavisualization nerds like us) this Iris flower data set.
The data set shows 50 samples from each of three species of iris, measuring two different features–the length and width of the sepals. Based on the combination of these two features, Fisher developed a linear discriminant model to distinguish the species from one another.

This is an example of Vizzlo's “Bubble Chart”
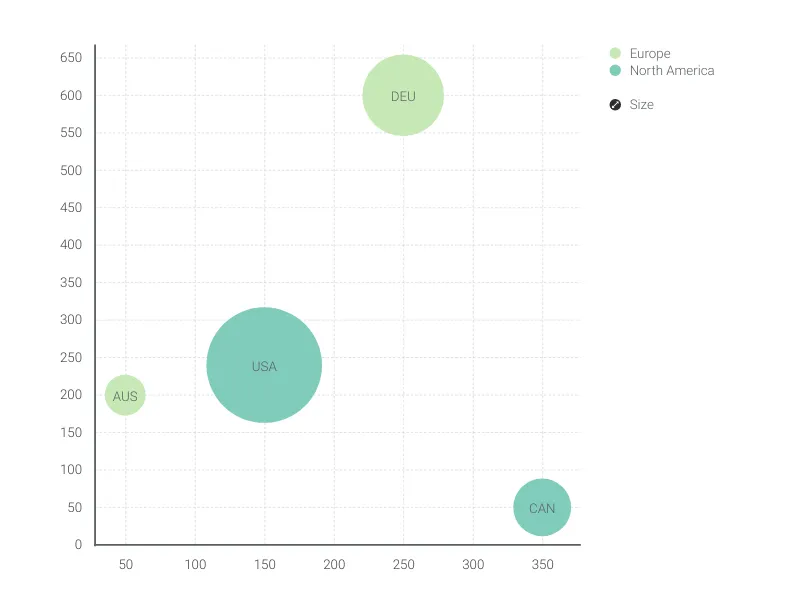
A multivariable graph for visualizing and comparing up to four dimension of your data.
Finance & Economics Sales & Marketing Scatter plots & Bubble charts