Chart Vizzard
Vizzlo's AI-based chart generatorDistribution of TikTok users worldwide
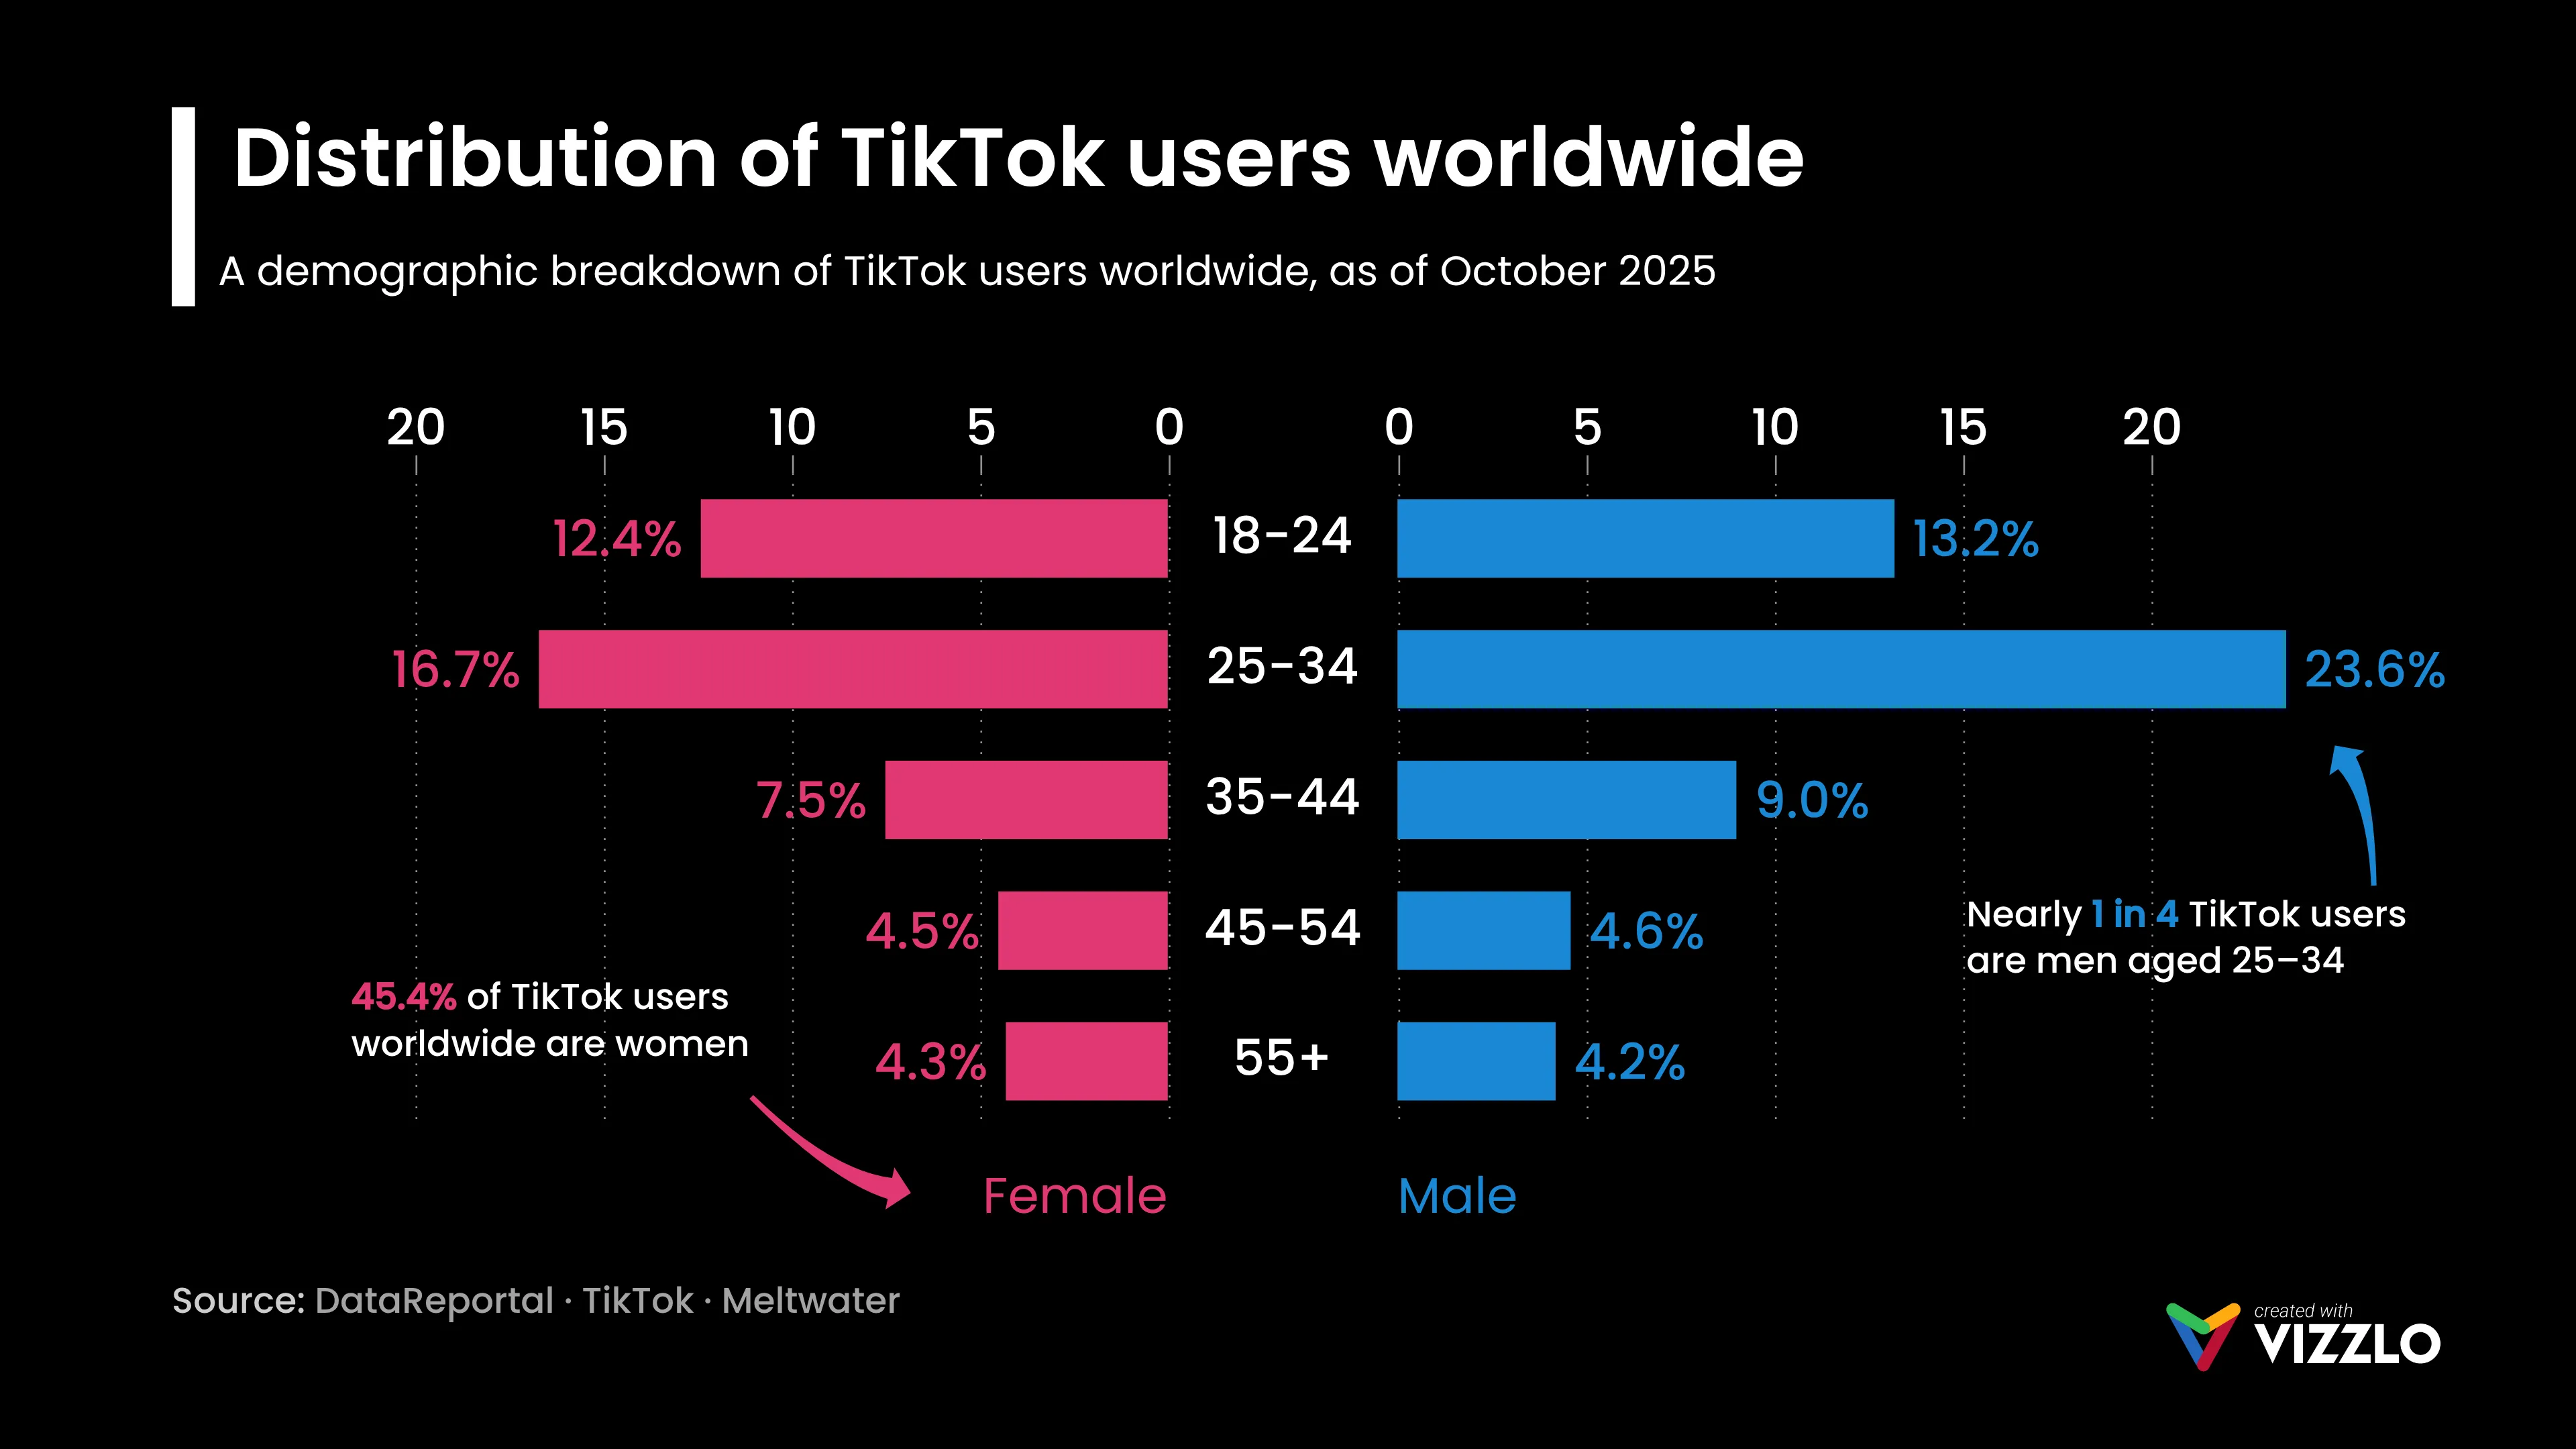
This butterfly chart visualizes the distribution of TikTok users worldwide as of October 2025, segmented by age group and gender. The chart compares the percentage share of female and male TikTok users across key demographic categories, including ages 18–24, 25–34, 35–44, 45–54, and 55+, providing a clear overview of TikTok’s global audience composition.
The visualization highlights how strongly TikTok is dominated by younger audiences, particularly users aged 25–34, which represents the platform’s single largest demographic segment. The chart also shows that TikTok’s audience extends beyond Gen Z, with significant adoption among Millennials and older age groups. Female users account for a large share of TikTok’s worldwide audience, while male users aged 25–34 make up nearly one quarter of the platform’s total user base.
Designed as a mirrored horizontal bar chart, also known as a butterfly chart or population pyramid chart, the visualization makes it easy to compare gender distribution side by side. The dark-themed design, combined with contrasting pink and blue color coding, improves readability and helps emphasize differences between demographic segments.
This chart serves as a useful example of how demographic data visualization can be used to analyze social media audiences, platform demographics, digital consumer behavior, and generational trends. It is particularly relevant for marketing analysis, social media strategy, audience segmentation, advertising insights, and data storytelling related to TikTok, Gen Z, Millennials, and global social media usage trends.
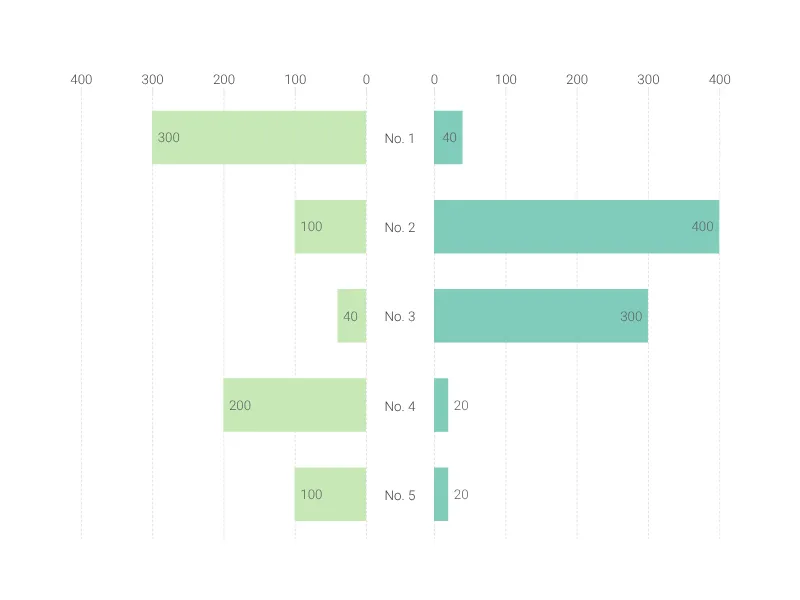
This is an example of Vizzlo's “Butterfly Chart”
Create a butterfly chart to compare two data sets side by side.