Chart Vizzard
Vizzlo's AI-based chart generatorAll Hail Robert Lewandowski

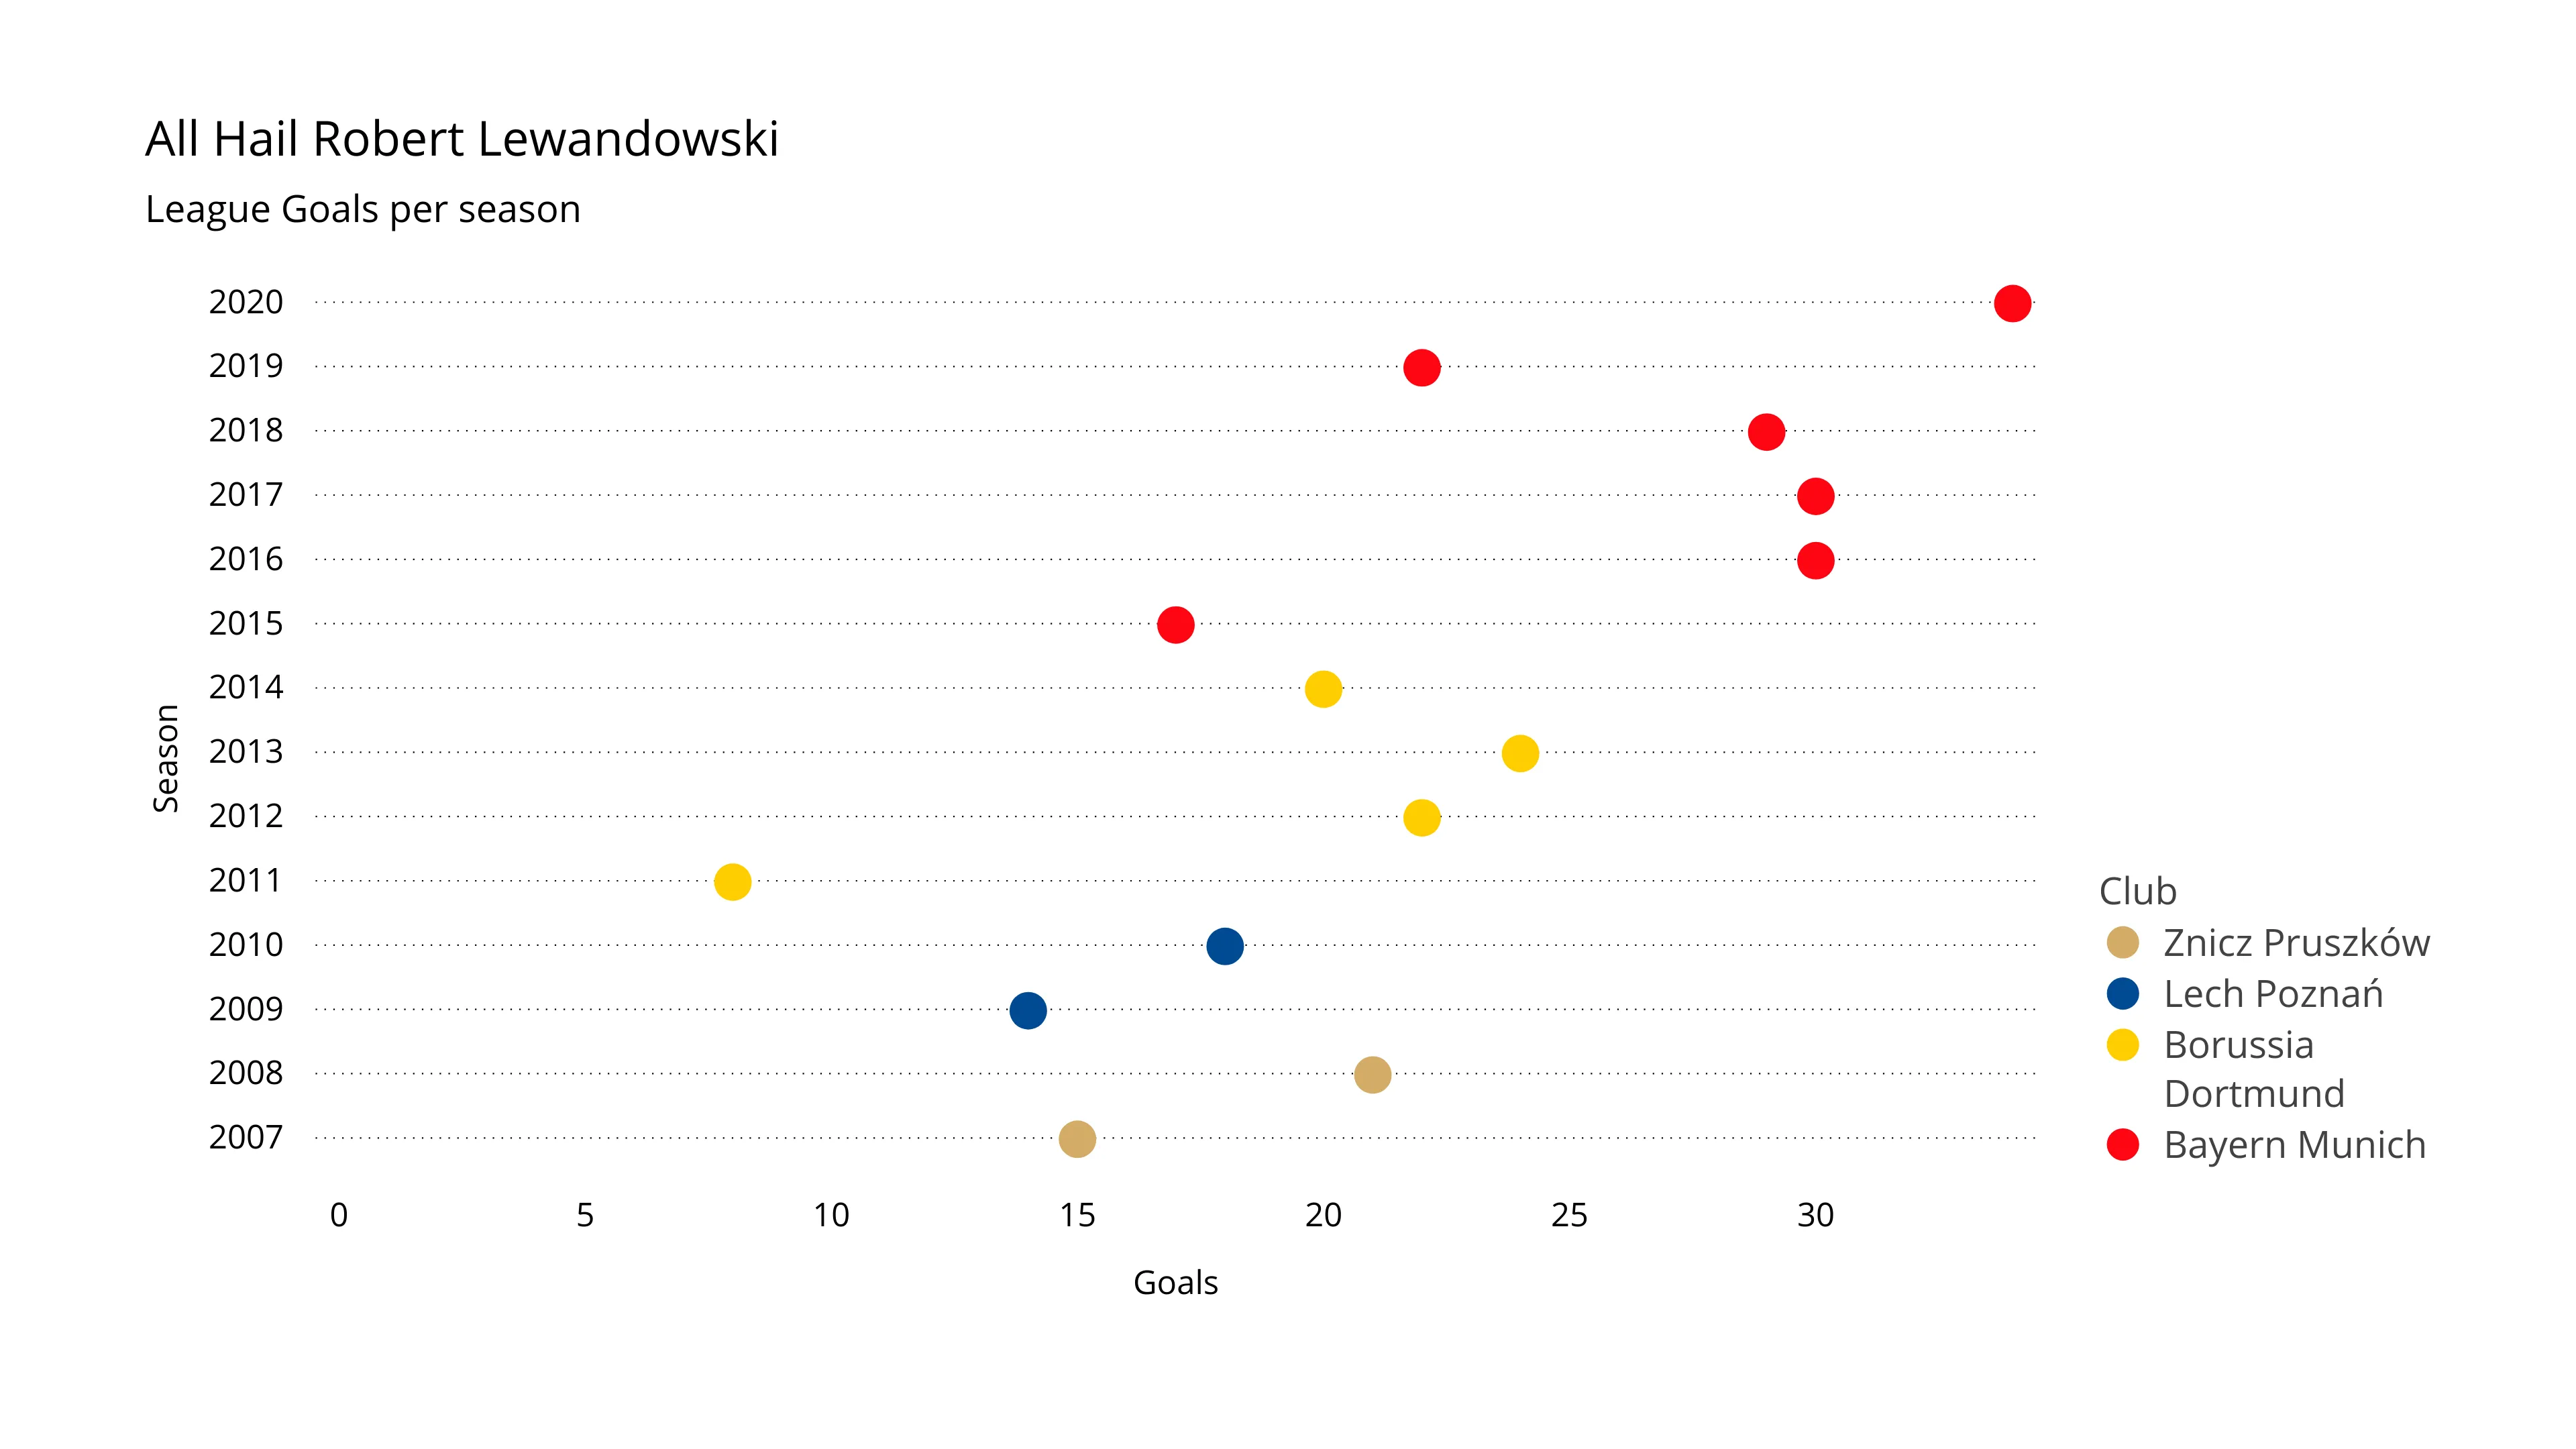
The Bundesliga season has come to an end. For the fifth time in his career, Robert Lewandowski was top scorer. He is clearly one of the best strikers of his generation. Unforgotten are his 4 goals for Borussia Dortmund in the Champions League semi-final against Real Madrid. Or his 5 goals within 9 minutes. Bayern Munich manager Pep Guardiola said at the time that he could “not explain” Lewandowski’s performance. This season Lewandowski scored 34 goals in 31 games. With a total of 236 goals in 321 matches, Lewandowski ranks third behind Gerd Müller and Klaus Fischer in the list of the Bundesliga’s best scorers of all time.

This is an example of Vizzlo's “Dot Plot Chart”
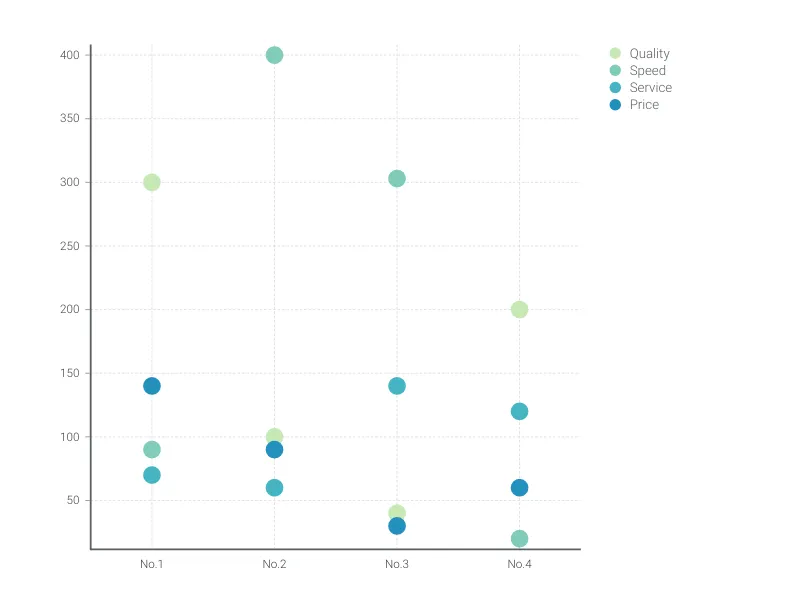
The dot plot chart is a visually appealing alternative to the bar chart for single or multiple categories of data.