Chart Vizzard
Vizzlo's AI-based chart generatorHoard Britannia

We are living through strange times full of fear, hope, and a dearth of toilet roll stock. But who is to blame?!
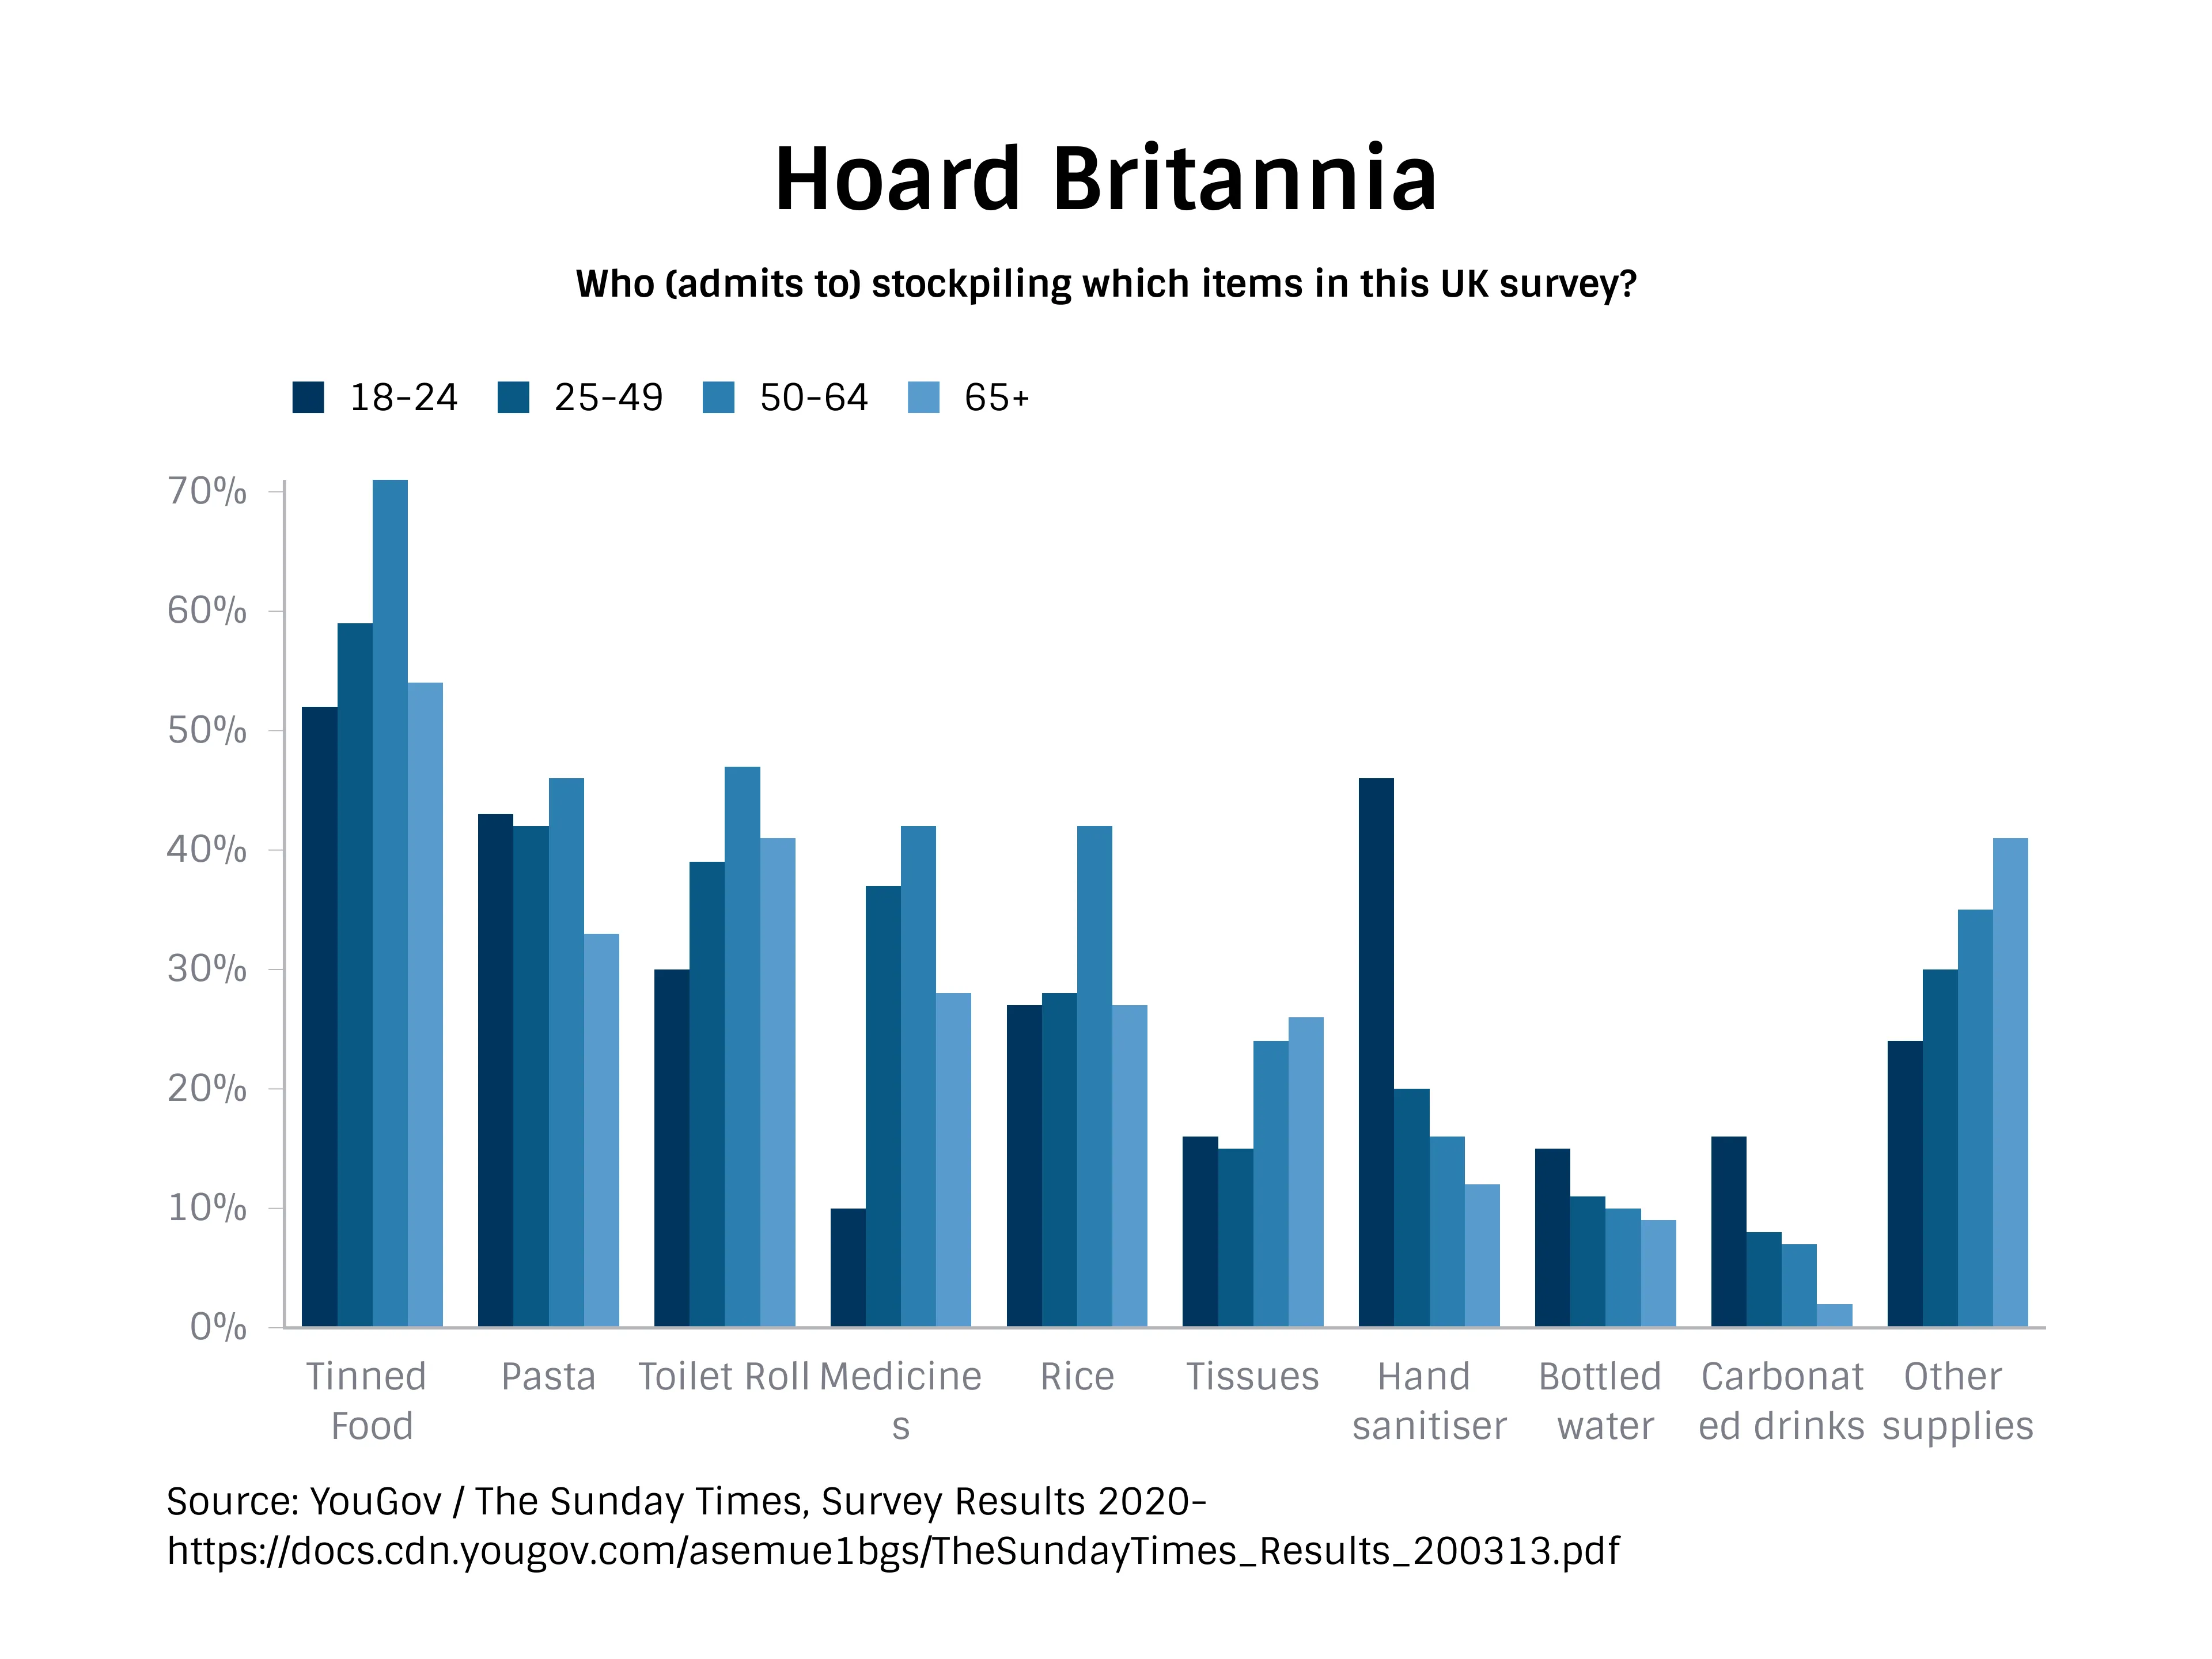
In an exciting twist for Millennials, constant disparaging of their “Ok, Boomer” parents may have some grounds this time around. In the case of the missing toilet roll, as well as tinned foods, rice, pasta, and medicine, it appears the group most responsible for stockpiling are the 50-64 age bracket (but the numbers don’t lie, folks - we are all responsible).
Gen Z appears to have a pretty different attitude to the rest of the ages surveyed, shunning staples like, errm, medicine… for carbonated drinks and a very robust stock of hand sanitizer. Is this the wisdom of the digital generation, safeguarding for prevention rather than cure? Or is the idea of being parted from their Pamplemousse La Croix worse than death?
While the 65+ age group is mostly stocking up on tinned goods, their second highest category is the mysteriously labelled “Other Supplies”. While I have absolutely no evidence to support this assertion, I’m betting that other supplies = weapons. Watch out for grandpa, he’s going on a post-pandemic zombie-hunting rampage.

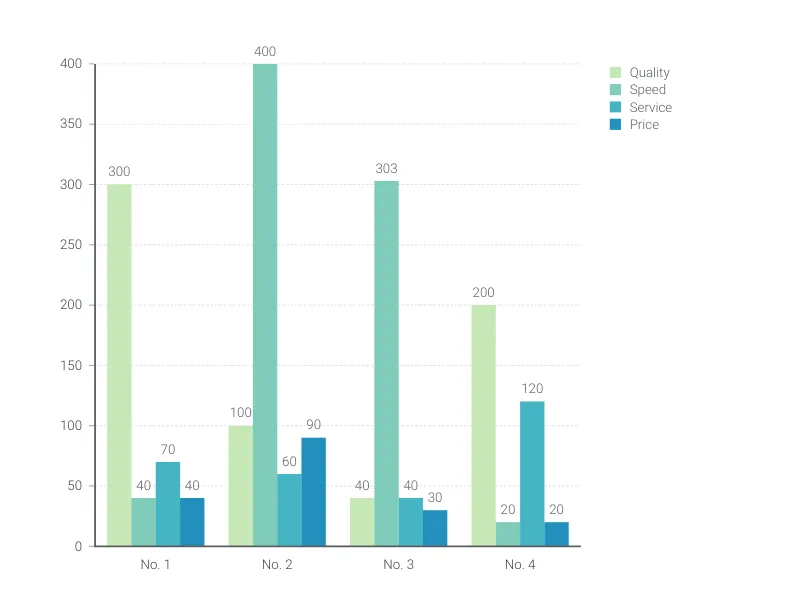
This is an example of Vizzlo's “Grouped Bar Chart”
Use a grouped bar chart to compare the same categories within different groups.