Chart Vizzard
Vizzlo's AI-based chart generatorFire cause US cities to go top for world's worst air pollution

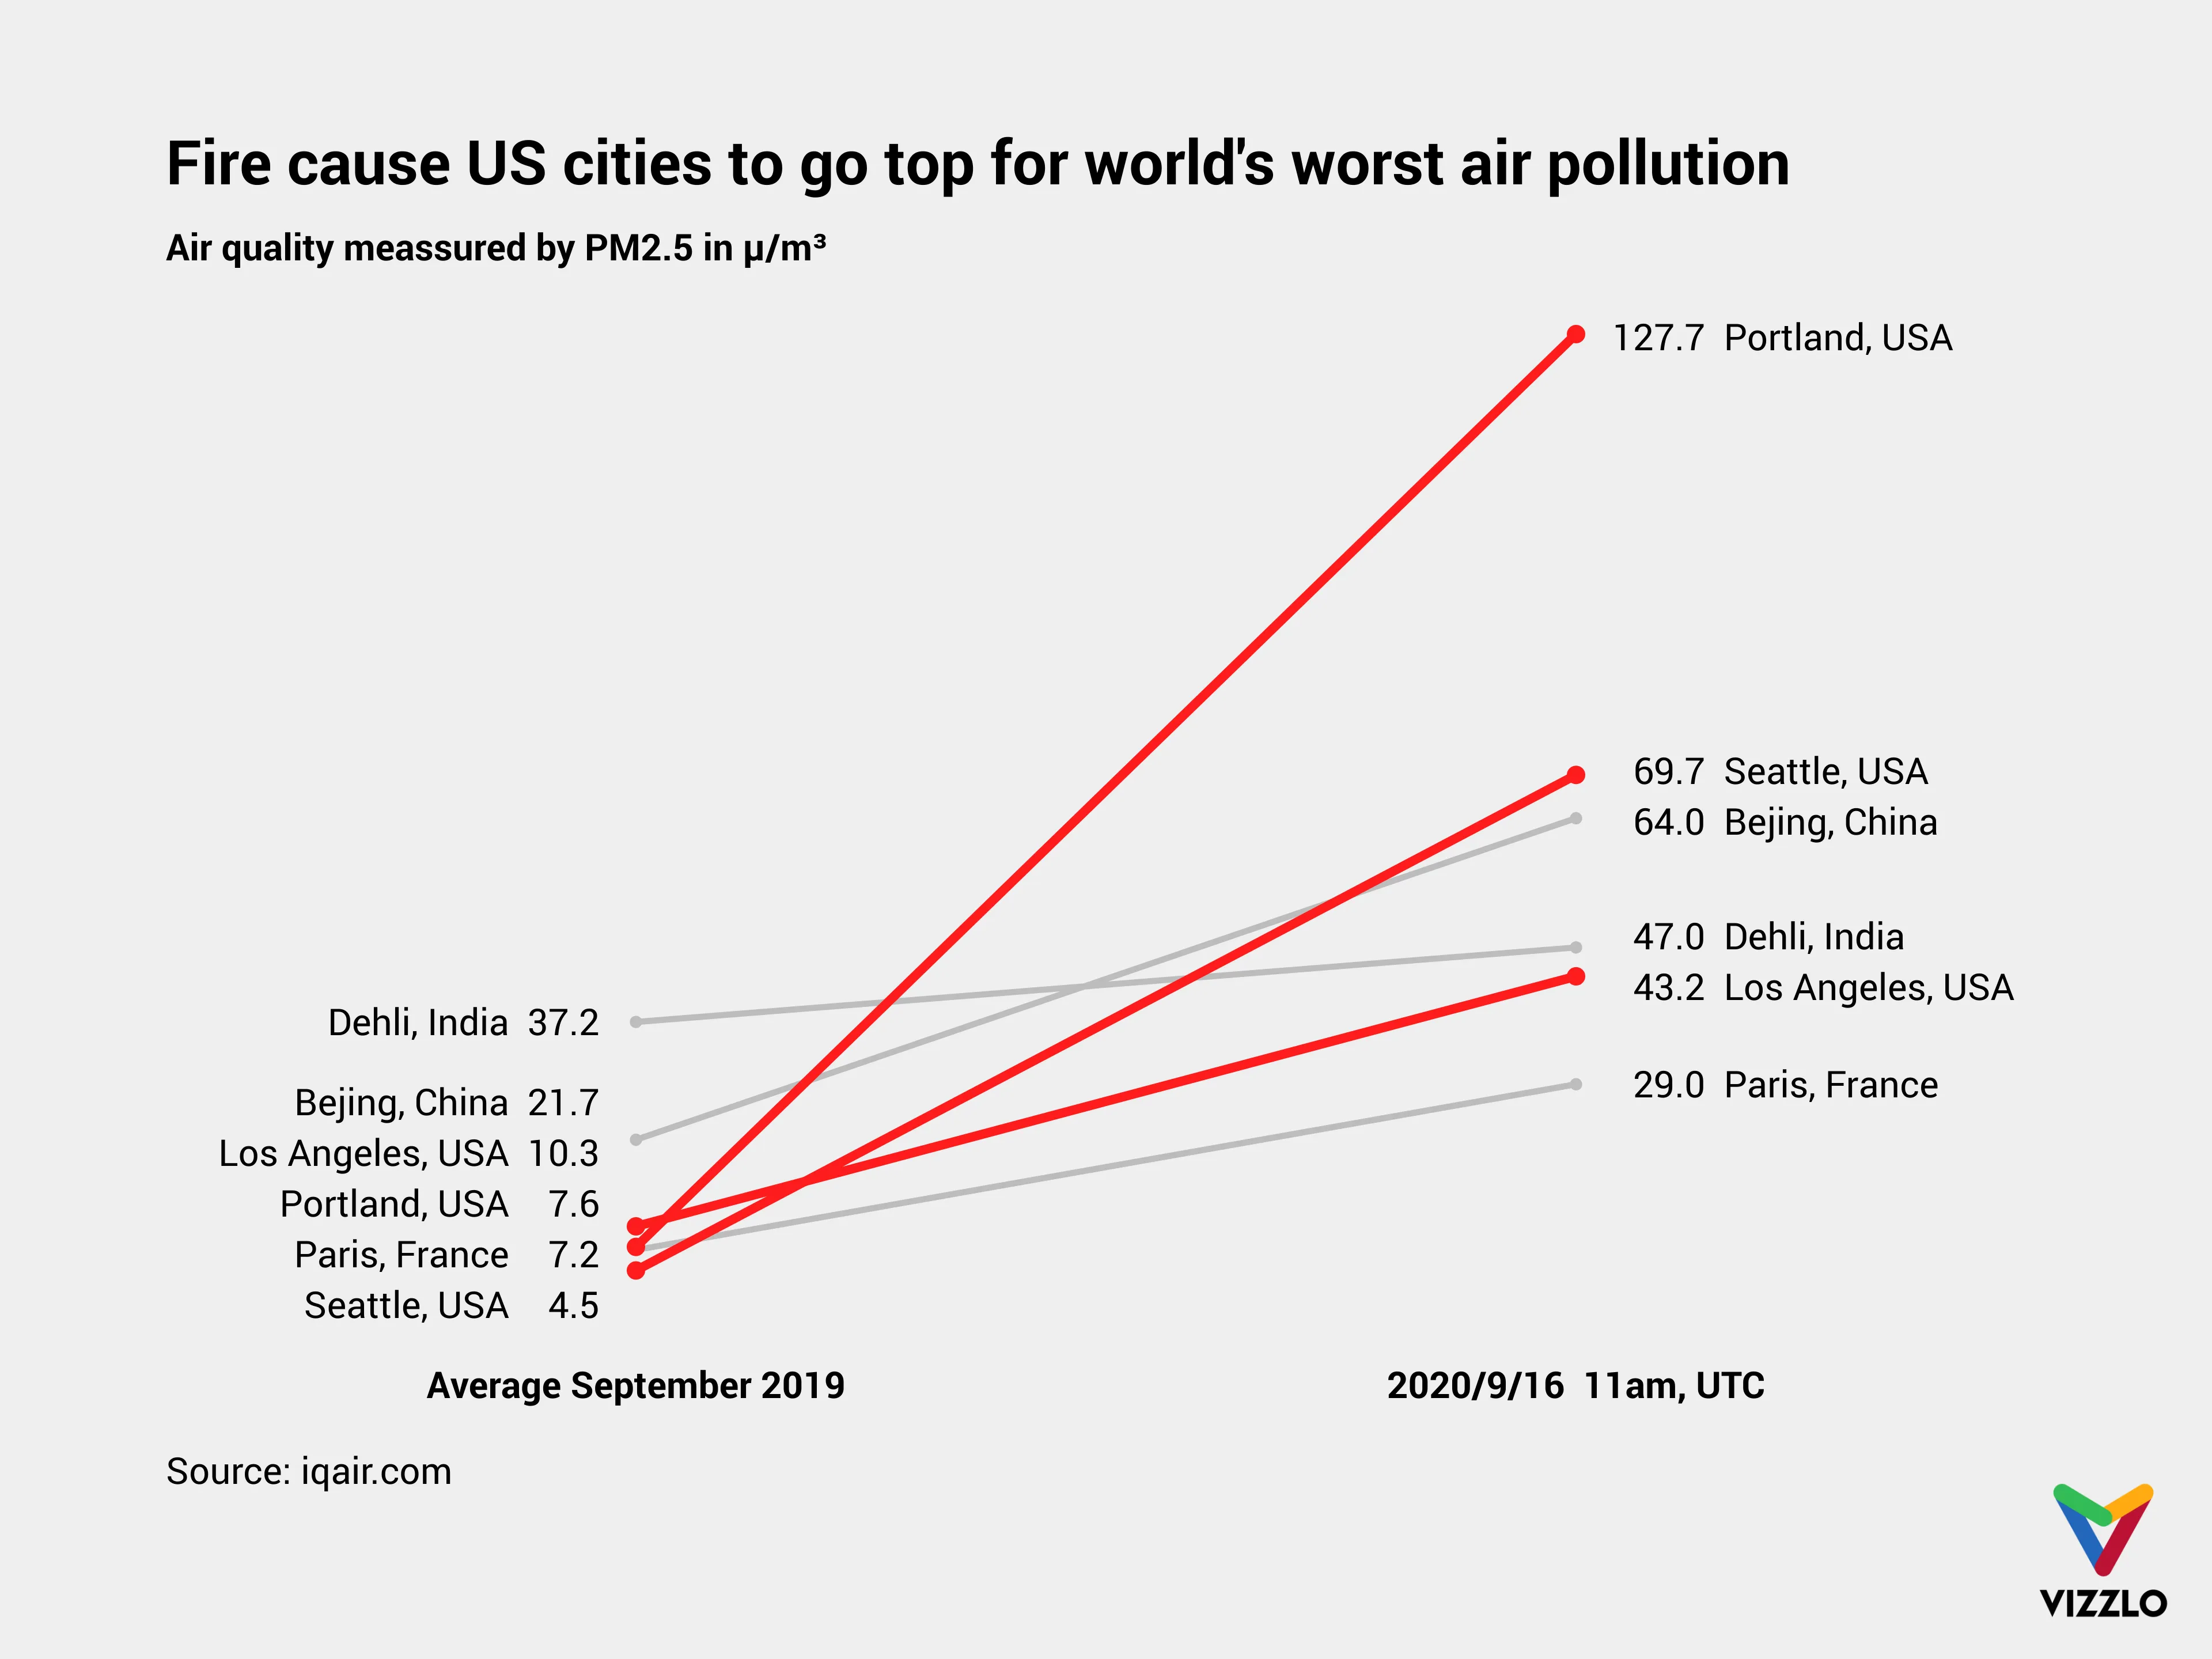
In mid-September of 2020, northwestern US cities rank for dirtiest air cities in the United States and, in some cases, the entire world due to the outbreak of several major wildfires. In addition to the damage to nature and life caused by the fire, large quantities of pollutants are released, pushing air pollution to life-threatening levels.
Particulate matter (PM) is a mixture of solid and liquid particles suspended in the air. PM2.5 refers to particles that have diameter less than 2.5 micrometres (more than 100 times thinner than a human hair) and remain suspended for longer. These particles are formed as a result of burning fuel and chemical reactions that take place in the atmosphere.
Taking the whole year 2019 into account, the average value was highest in Ghaziabad (110.2μ/m³), Hotan (110.1μ/m³), and Gujranwala (105.2μ/m³). The WHO recommends that daily PM2.5 pollution exposure not exceed 25μ/m³.

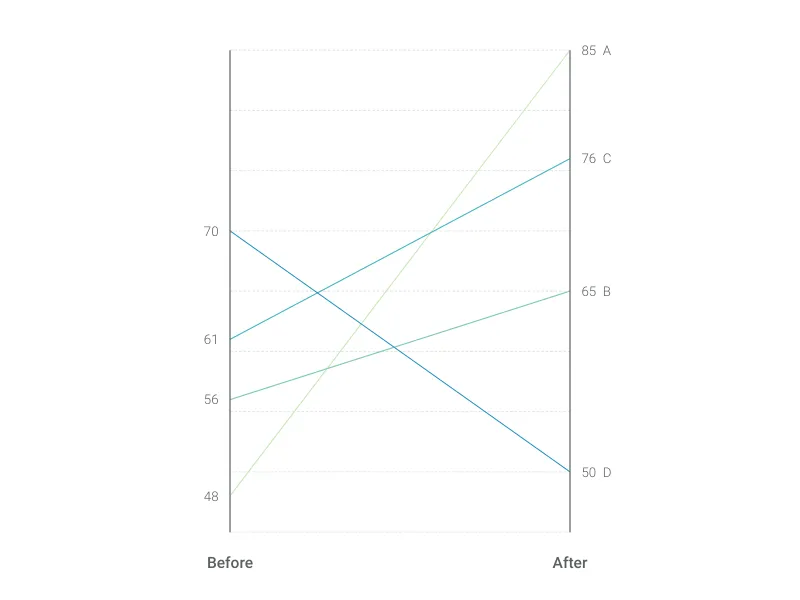
This is an example of Vizzlo's “Slopegraph”
Visualize a before and after story with a focus on slopes.