Chart Vizzard
Vizzlo's AI-based chart generatorWorldwide natural disasters

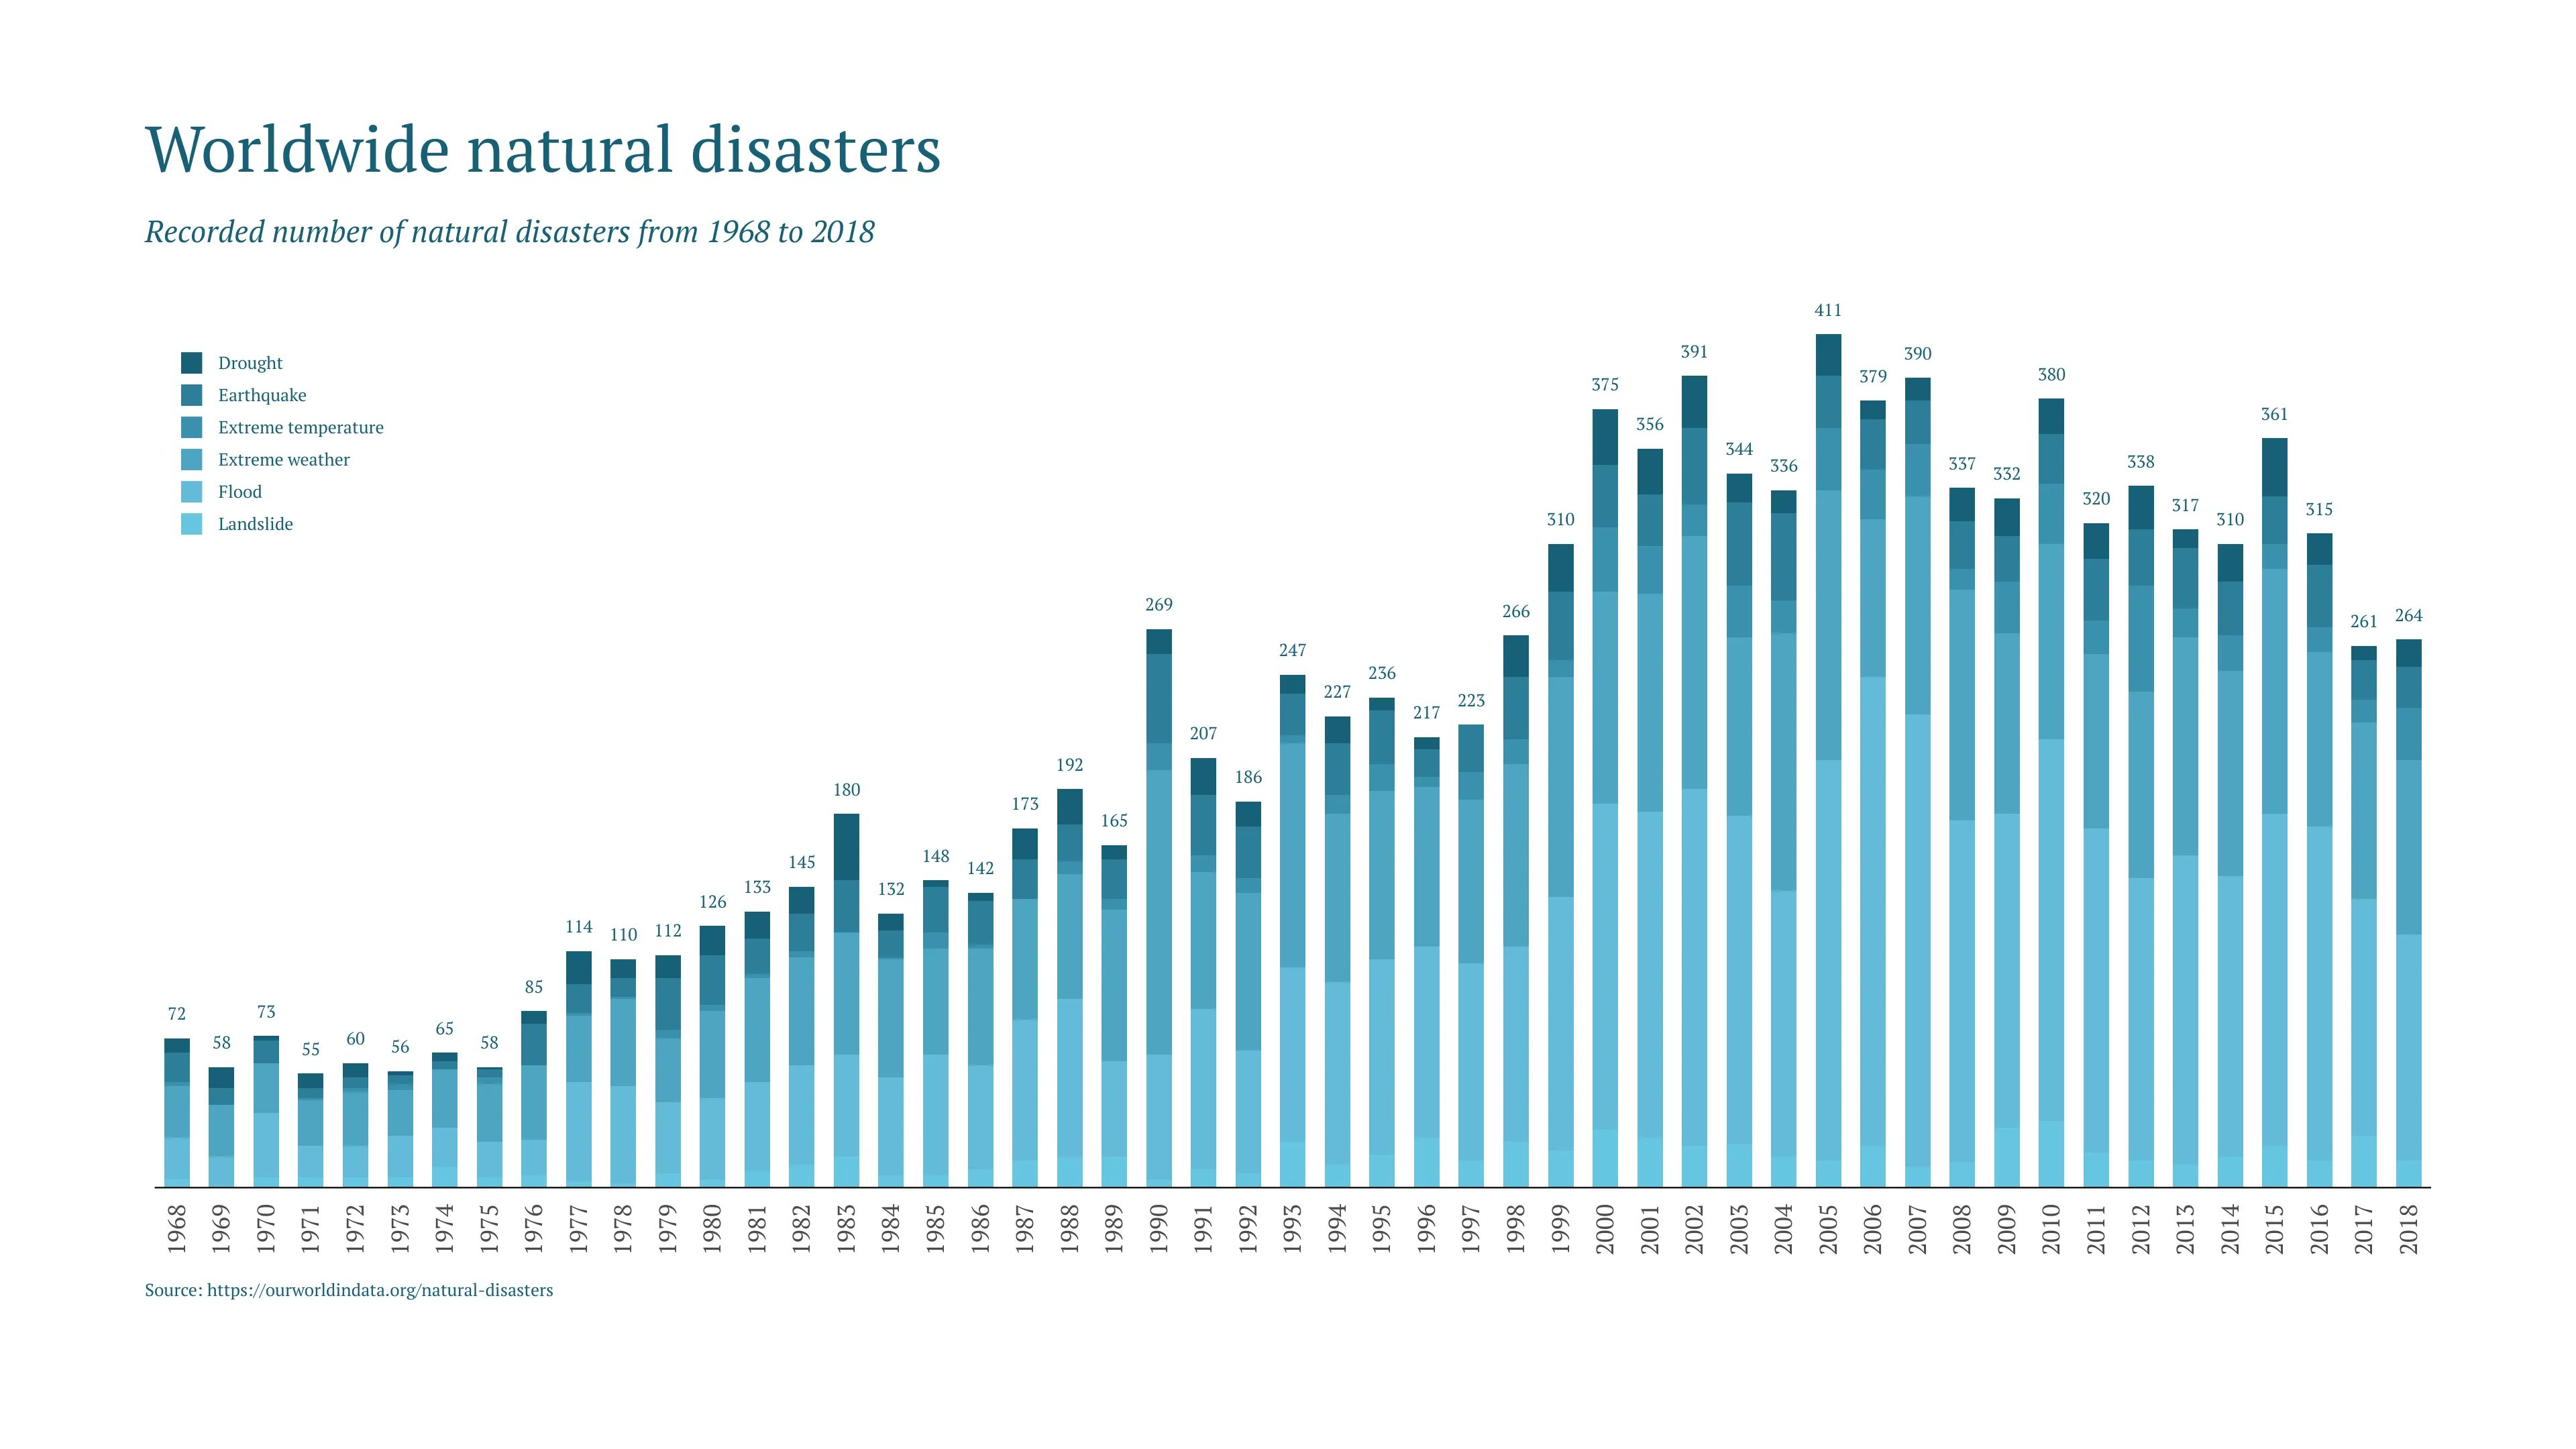
Global warming is increasing the average temperature of the Earth’s climate system, leading to more intense storms, including hurricanes. The graph reported the worldwide number of natural disaster from 1968 to 2018. In relation to the previous decade (2000-2017), in 2018 there were fewer disasters compared to the annual average of 365 events. This decrease is due to the reduction of massive disaster events such as the Hurricane Katrina (2005) and the Haiti Earthquake (2010). However, you can see that overall natural disasters have been increasing at an exponential rate since we started collecting data in 1968.

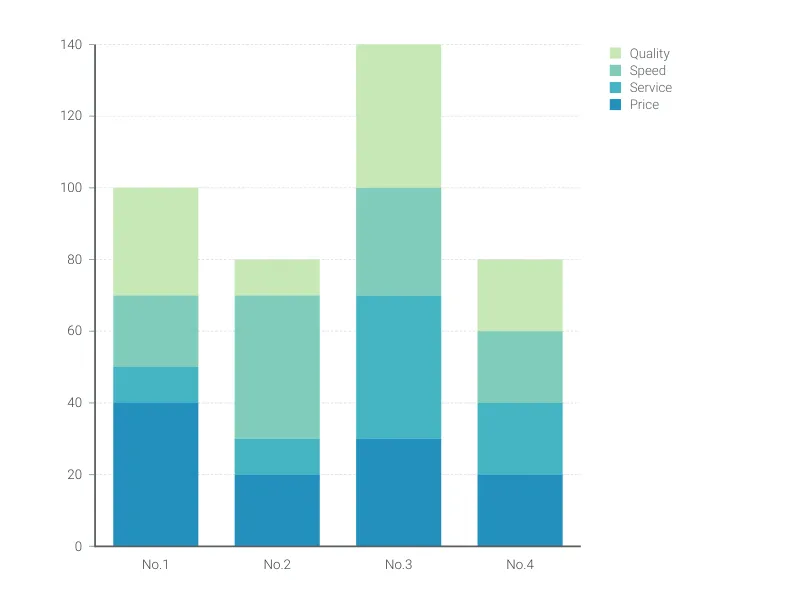
This is an example of Vizzlo's “Stacked Bar Chart”
Highlight the part-to-whole relationships of categories and compare various groups with this stacked bar graph.