Chart Vizzard
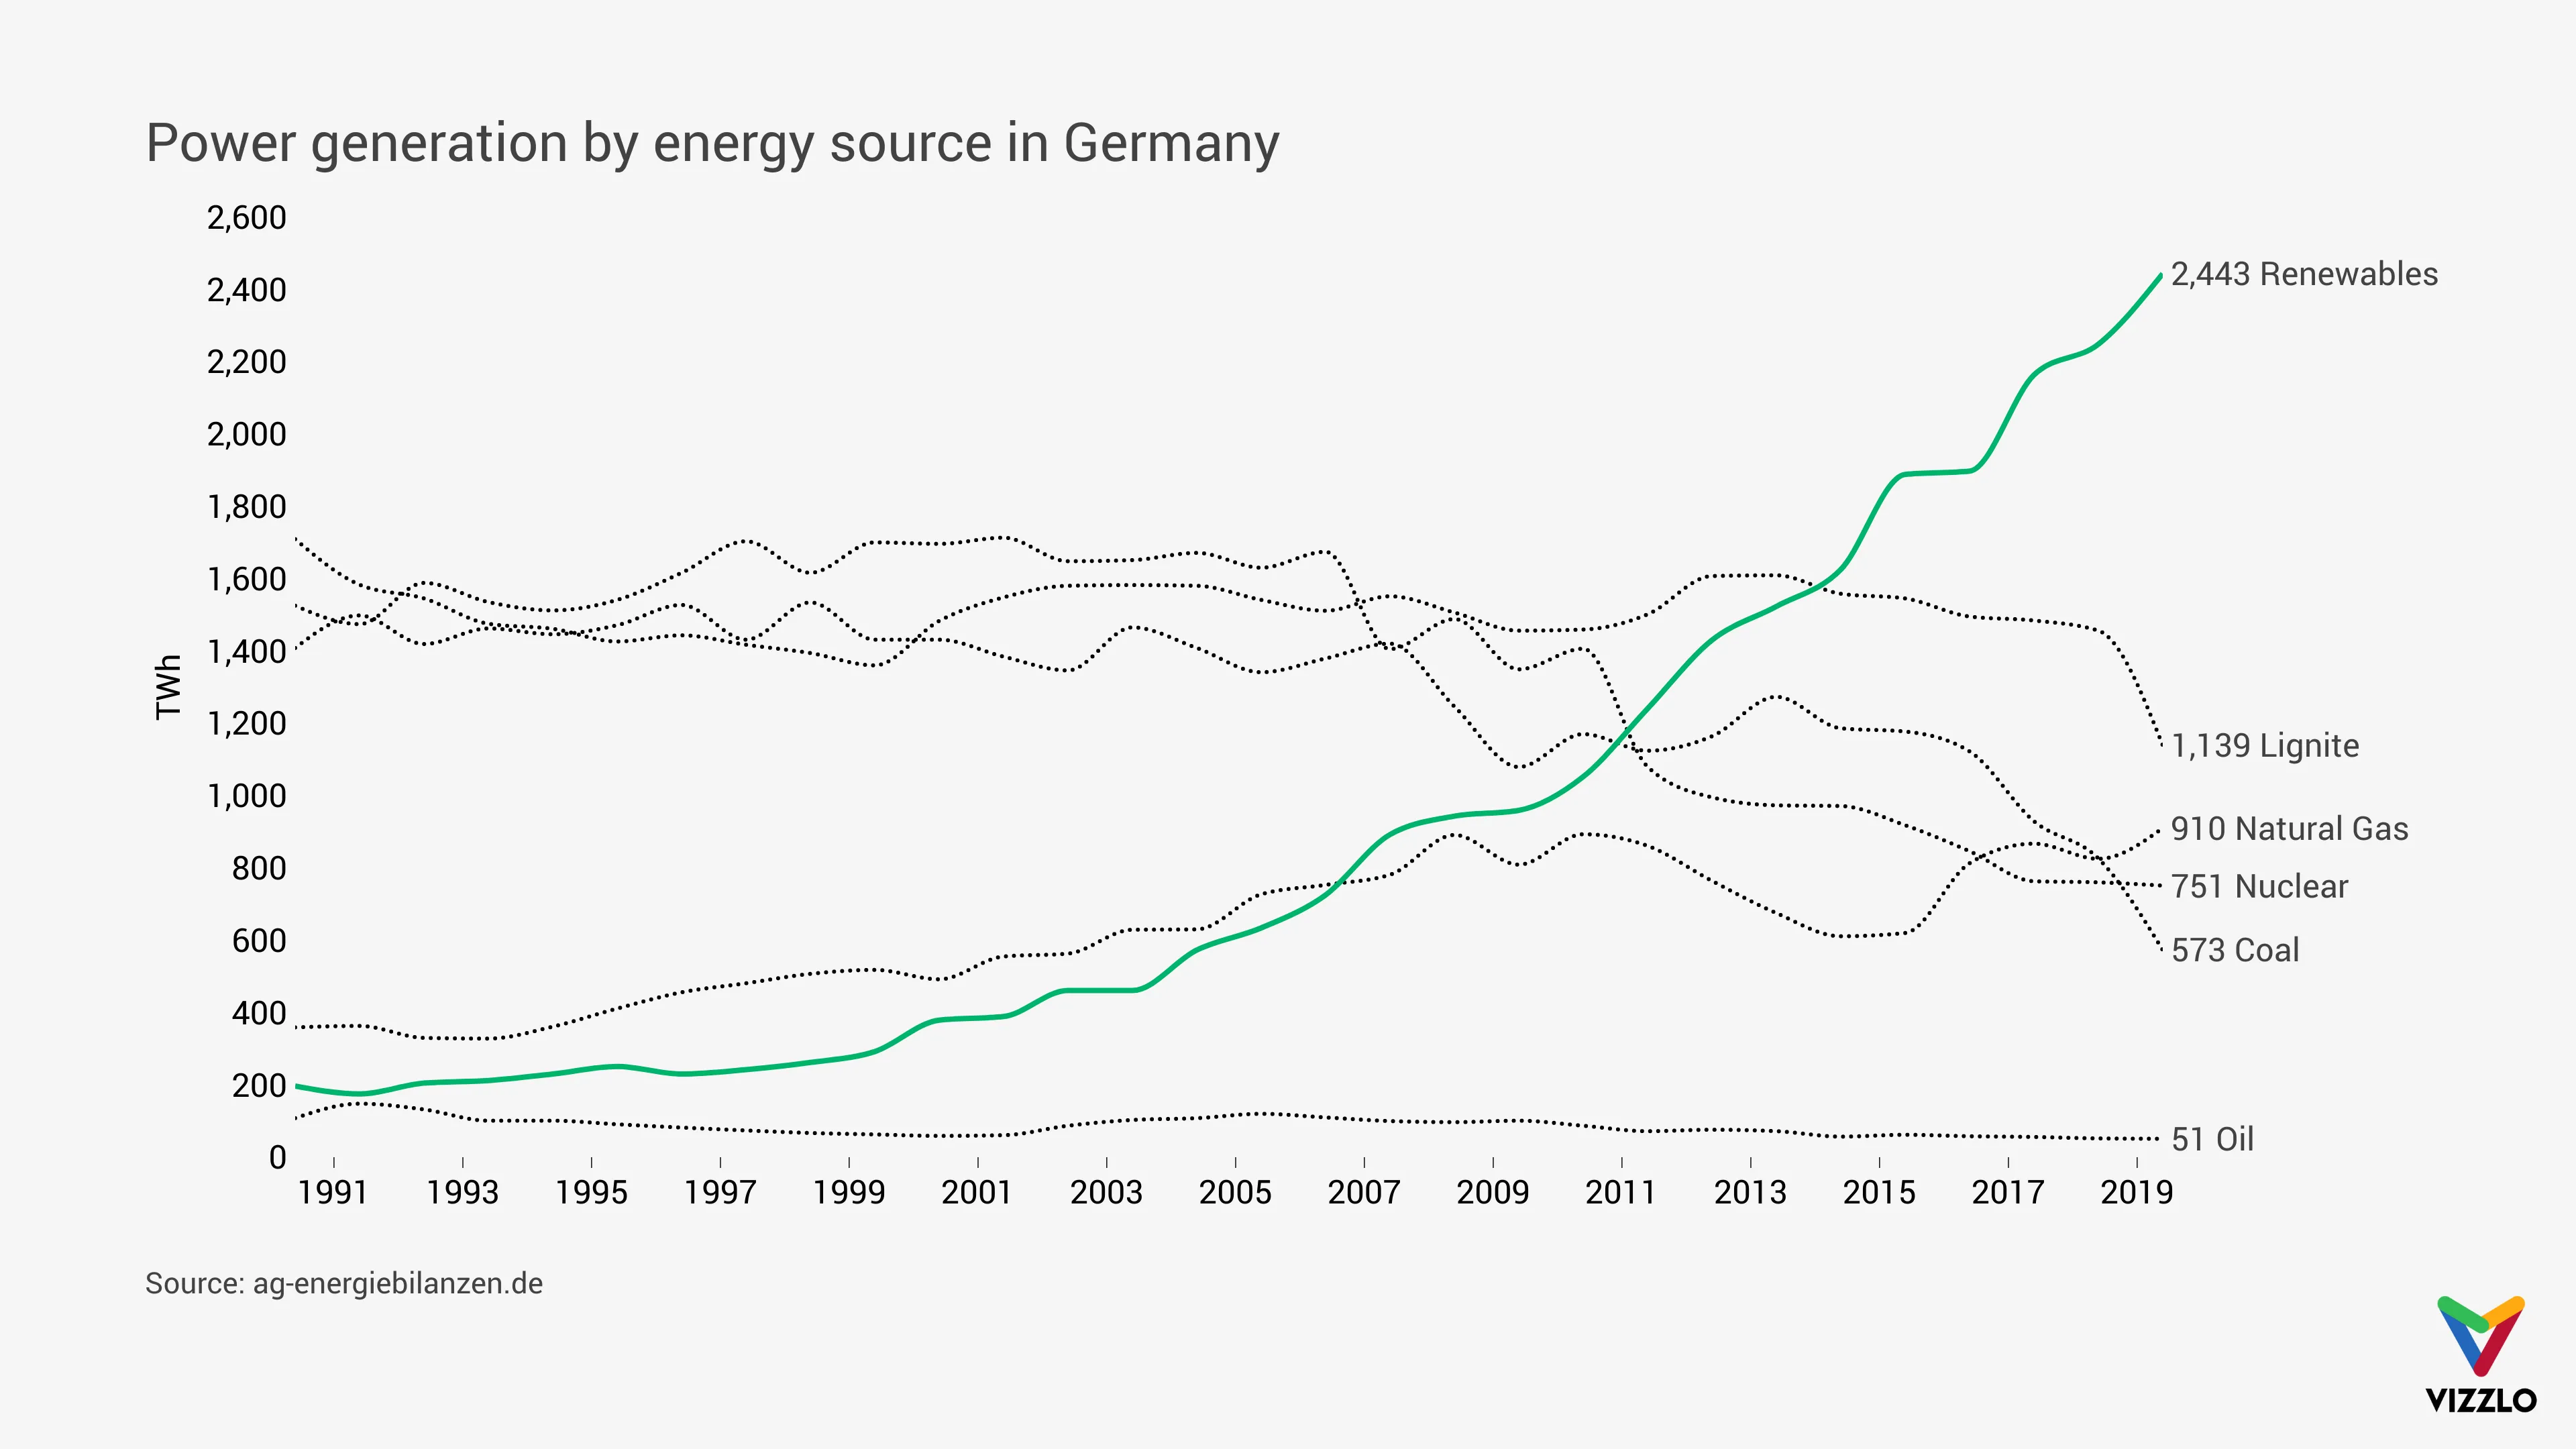
Vizzlo's AI-based chart generatorPower generation by energy source in Germany

The structure of gross electricity generation in Germany has changed significantly since 1990: The share of the energy sources lignite, hard coal, and nuclear energy in gross electricity generation has decreased. Today, these three energy sources together account for a share of only 40%, compared to 84% in 1990. The use of natural gas for electricity generation is almost three times as high as in 1990. The share of renewable energies has increased more than twelvefold since 1990. Hydroelectric power is only growing slightly overall, so that although it was responsible for the lion’s share of renewable electricity production until around 2000, it has since been significantly overtaken by photovoltaic, wind, and biomass plants.

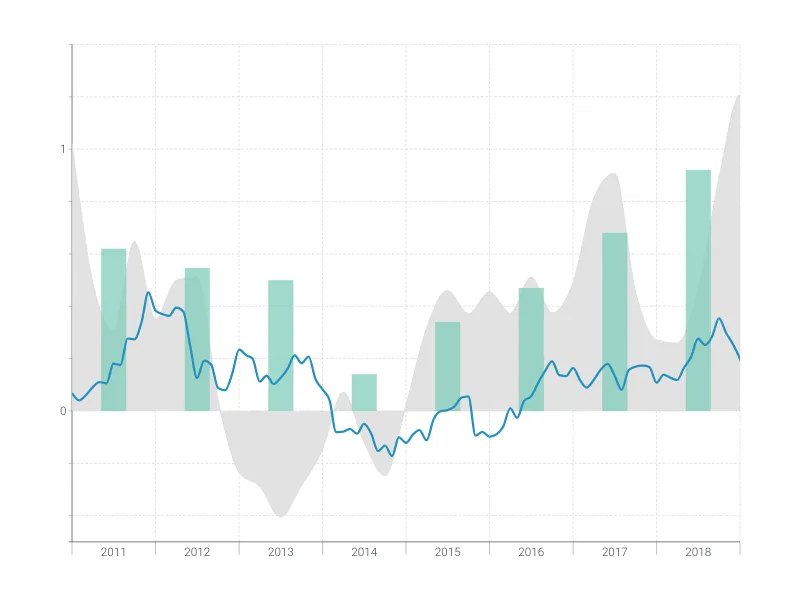
This is an example of Vizzlo's “Time Series Graph”
Complex time series graph to visualize detailed financial data.
Finance & Economics Bar & Column charts Line & Area charts Time-based charts