Chart Vizzard
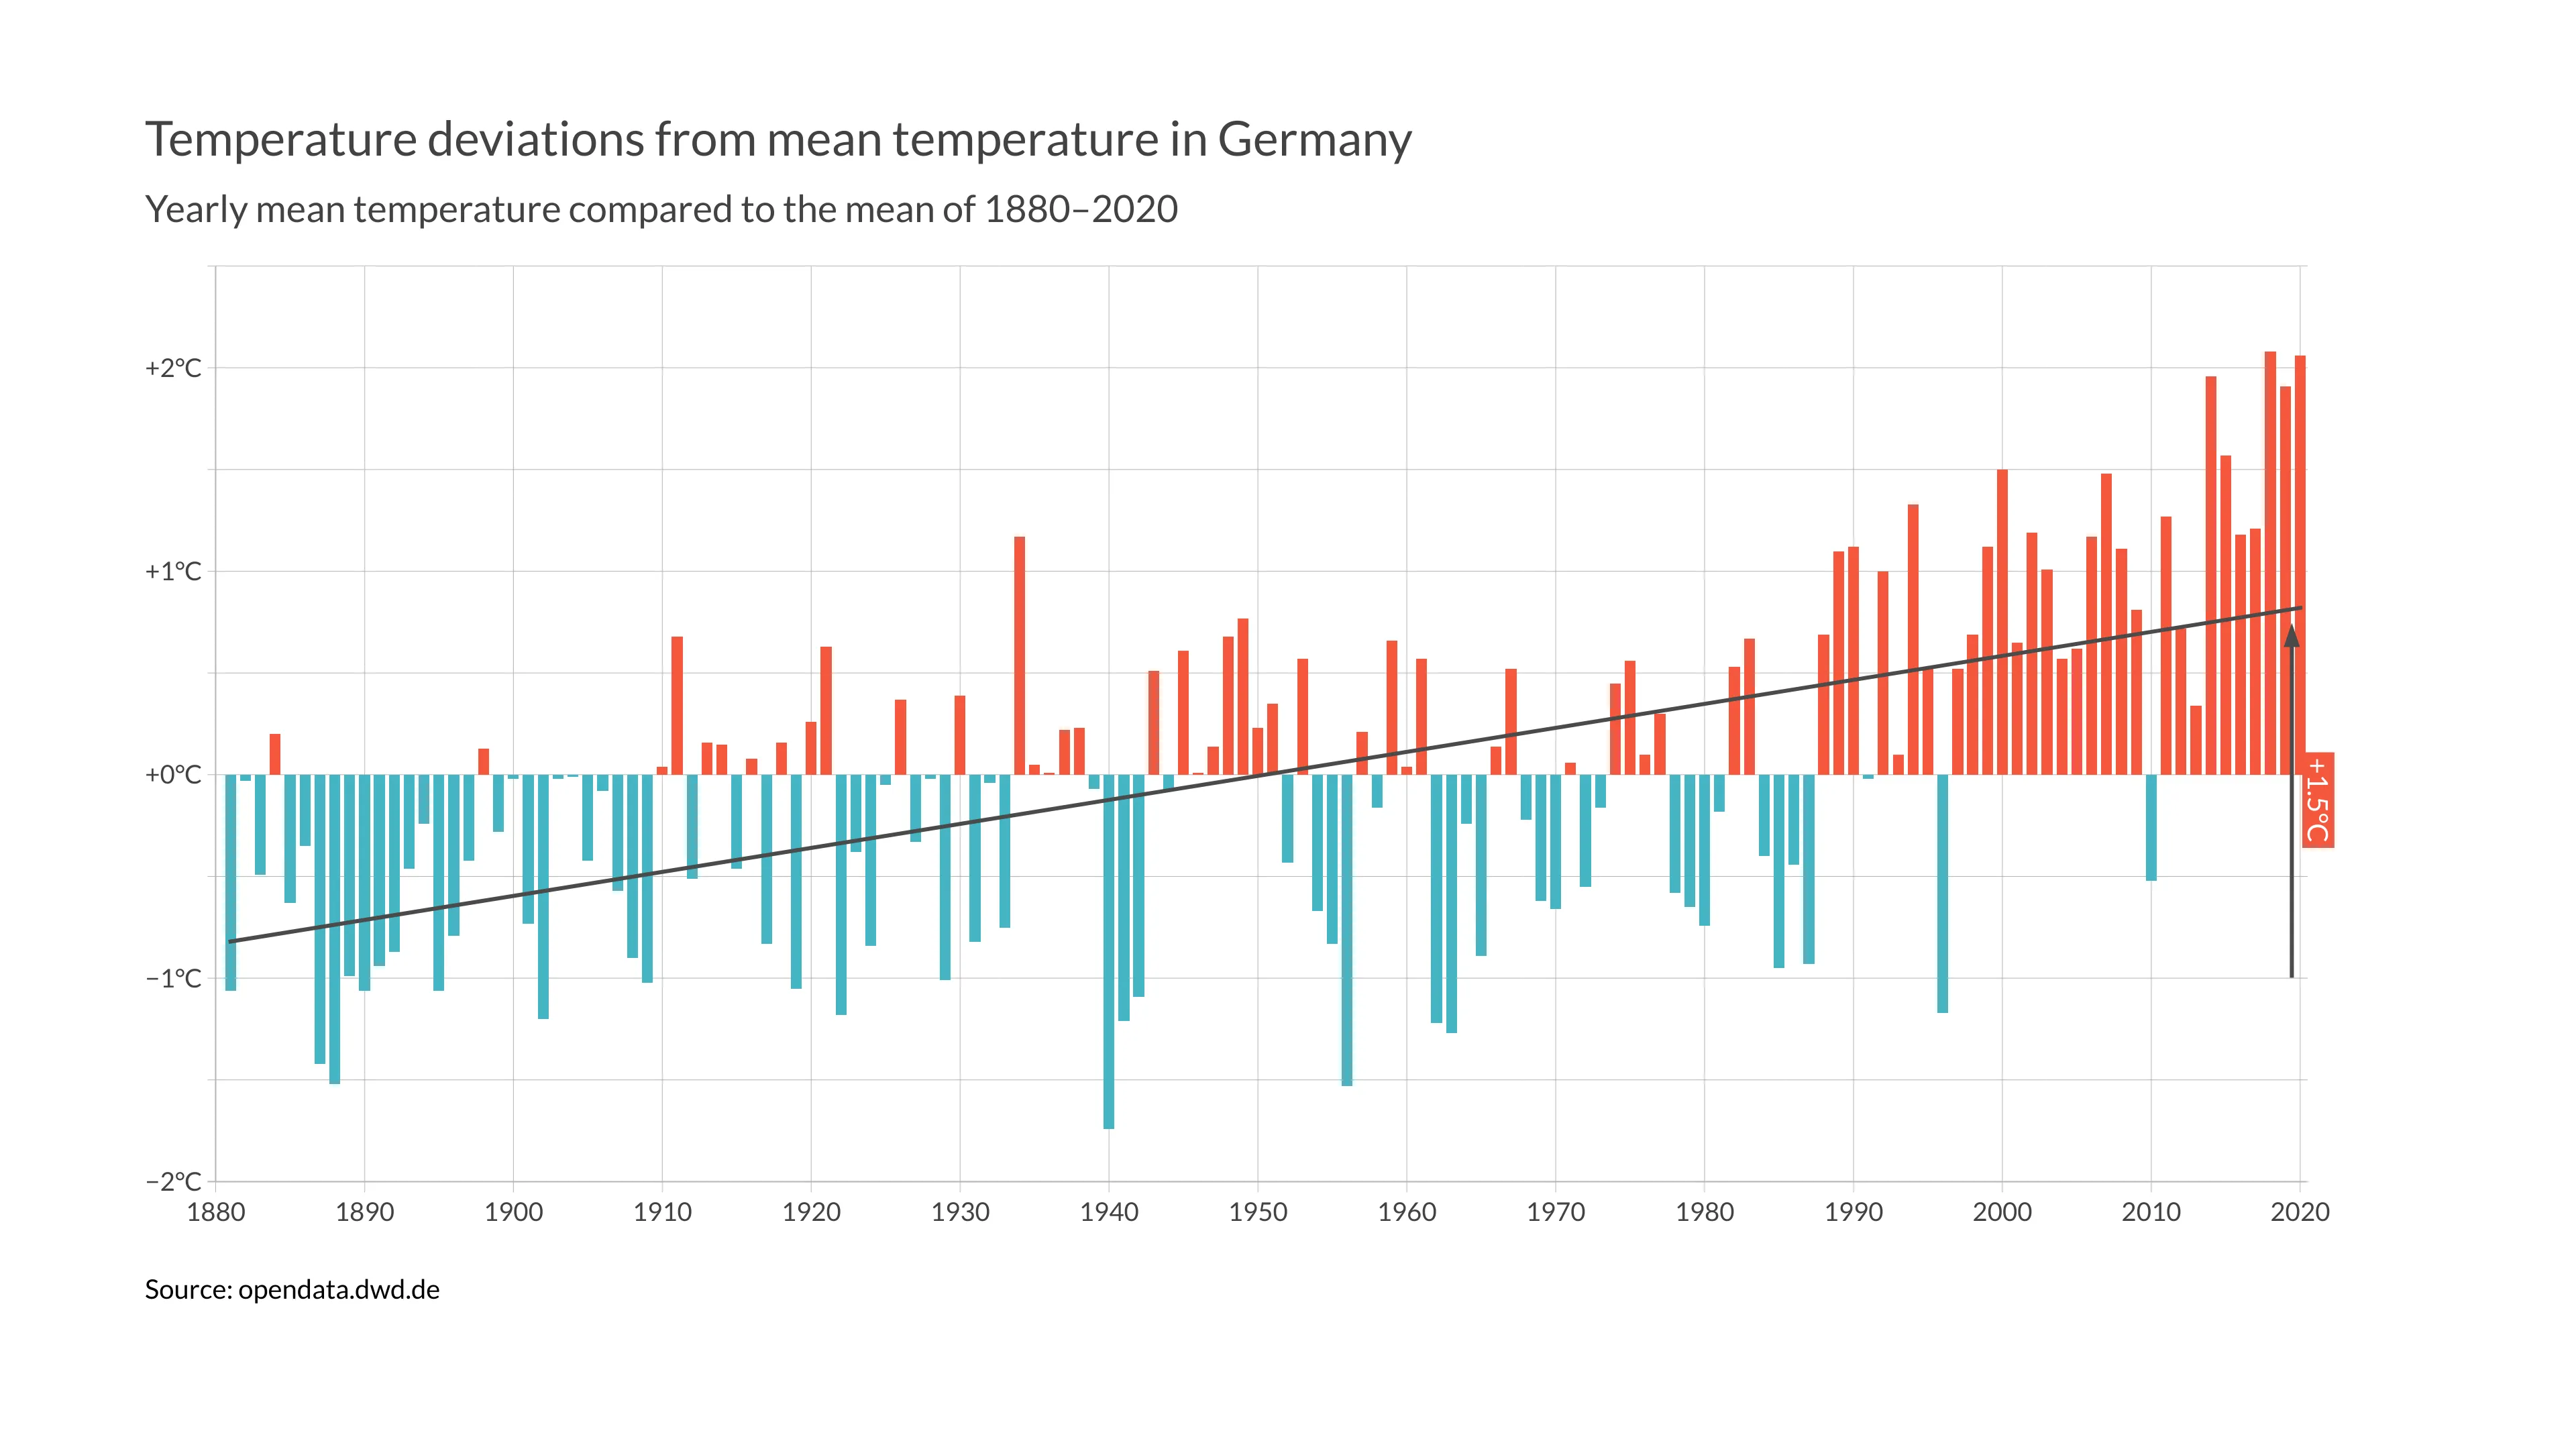
Vizzlo's AI-based chart generatorTemperature deviations from mean temperature in Germany

Since the beginning of industrialization the global mean surface temperature increased by about 1°C due to the man-made Climate change. Currently the Earth heats up around 0.2°C every decade.
The Intergovernmental Panel on Climate Change (IPCC) warns, that global warming by more than 2°C until 2100 can have serious consequences. Without a limit of climate-damaging greenhouse gas emissions, an increase in global average temperature by more than 3°C is very likely. The negative consequences are increased periods of drought, heavy rain events, a rise in sea levels and a loss of Biodiversity.
As one of the largest economies of the world, Germany has contributed almost five percent to global warming since the beginning of industrialization. The annual per capita CO2 emissions in Germany were around 9.6 tons in 2018 - about twice as high as the international average of 4.8 tons per capita. Germany is increasingly affected by climate change. At around 1.5°C, the increase in the average temperature is significantly higher than the global mean.

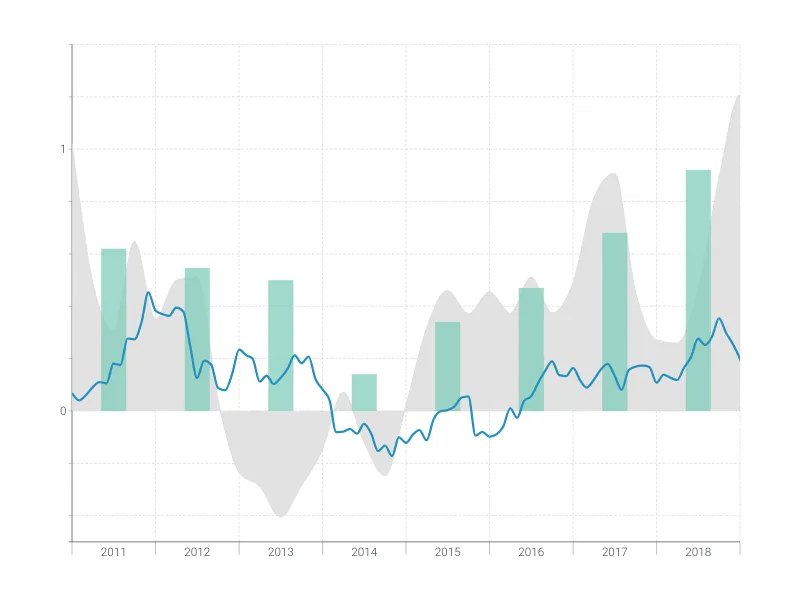
This is an example of Vizzlo's “Time Series Graph”
Complex time series graph to visualize detailed financial data.
Finance & Economics Bar & Column charts Line & Area charts Time-based charts