Chart Vizzard
Vizzlo's AI-based chart generatorVisas issued for the USA from the Mexico City consulate

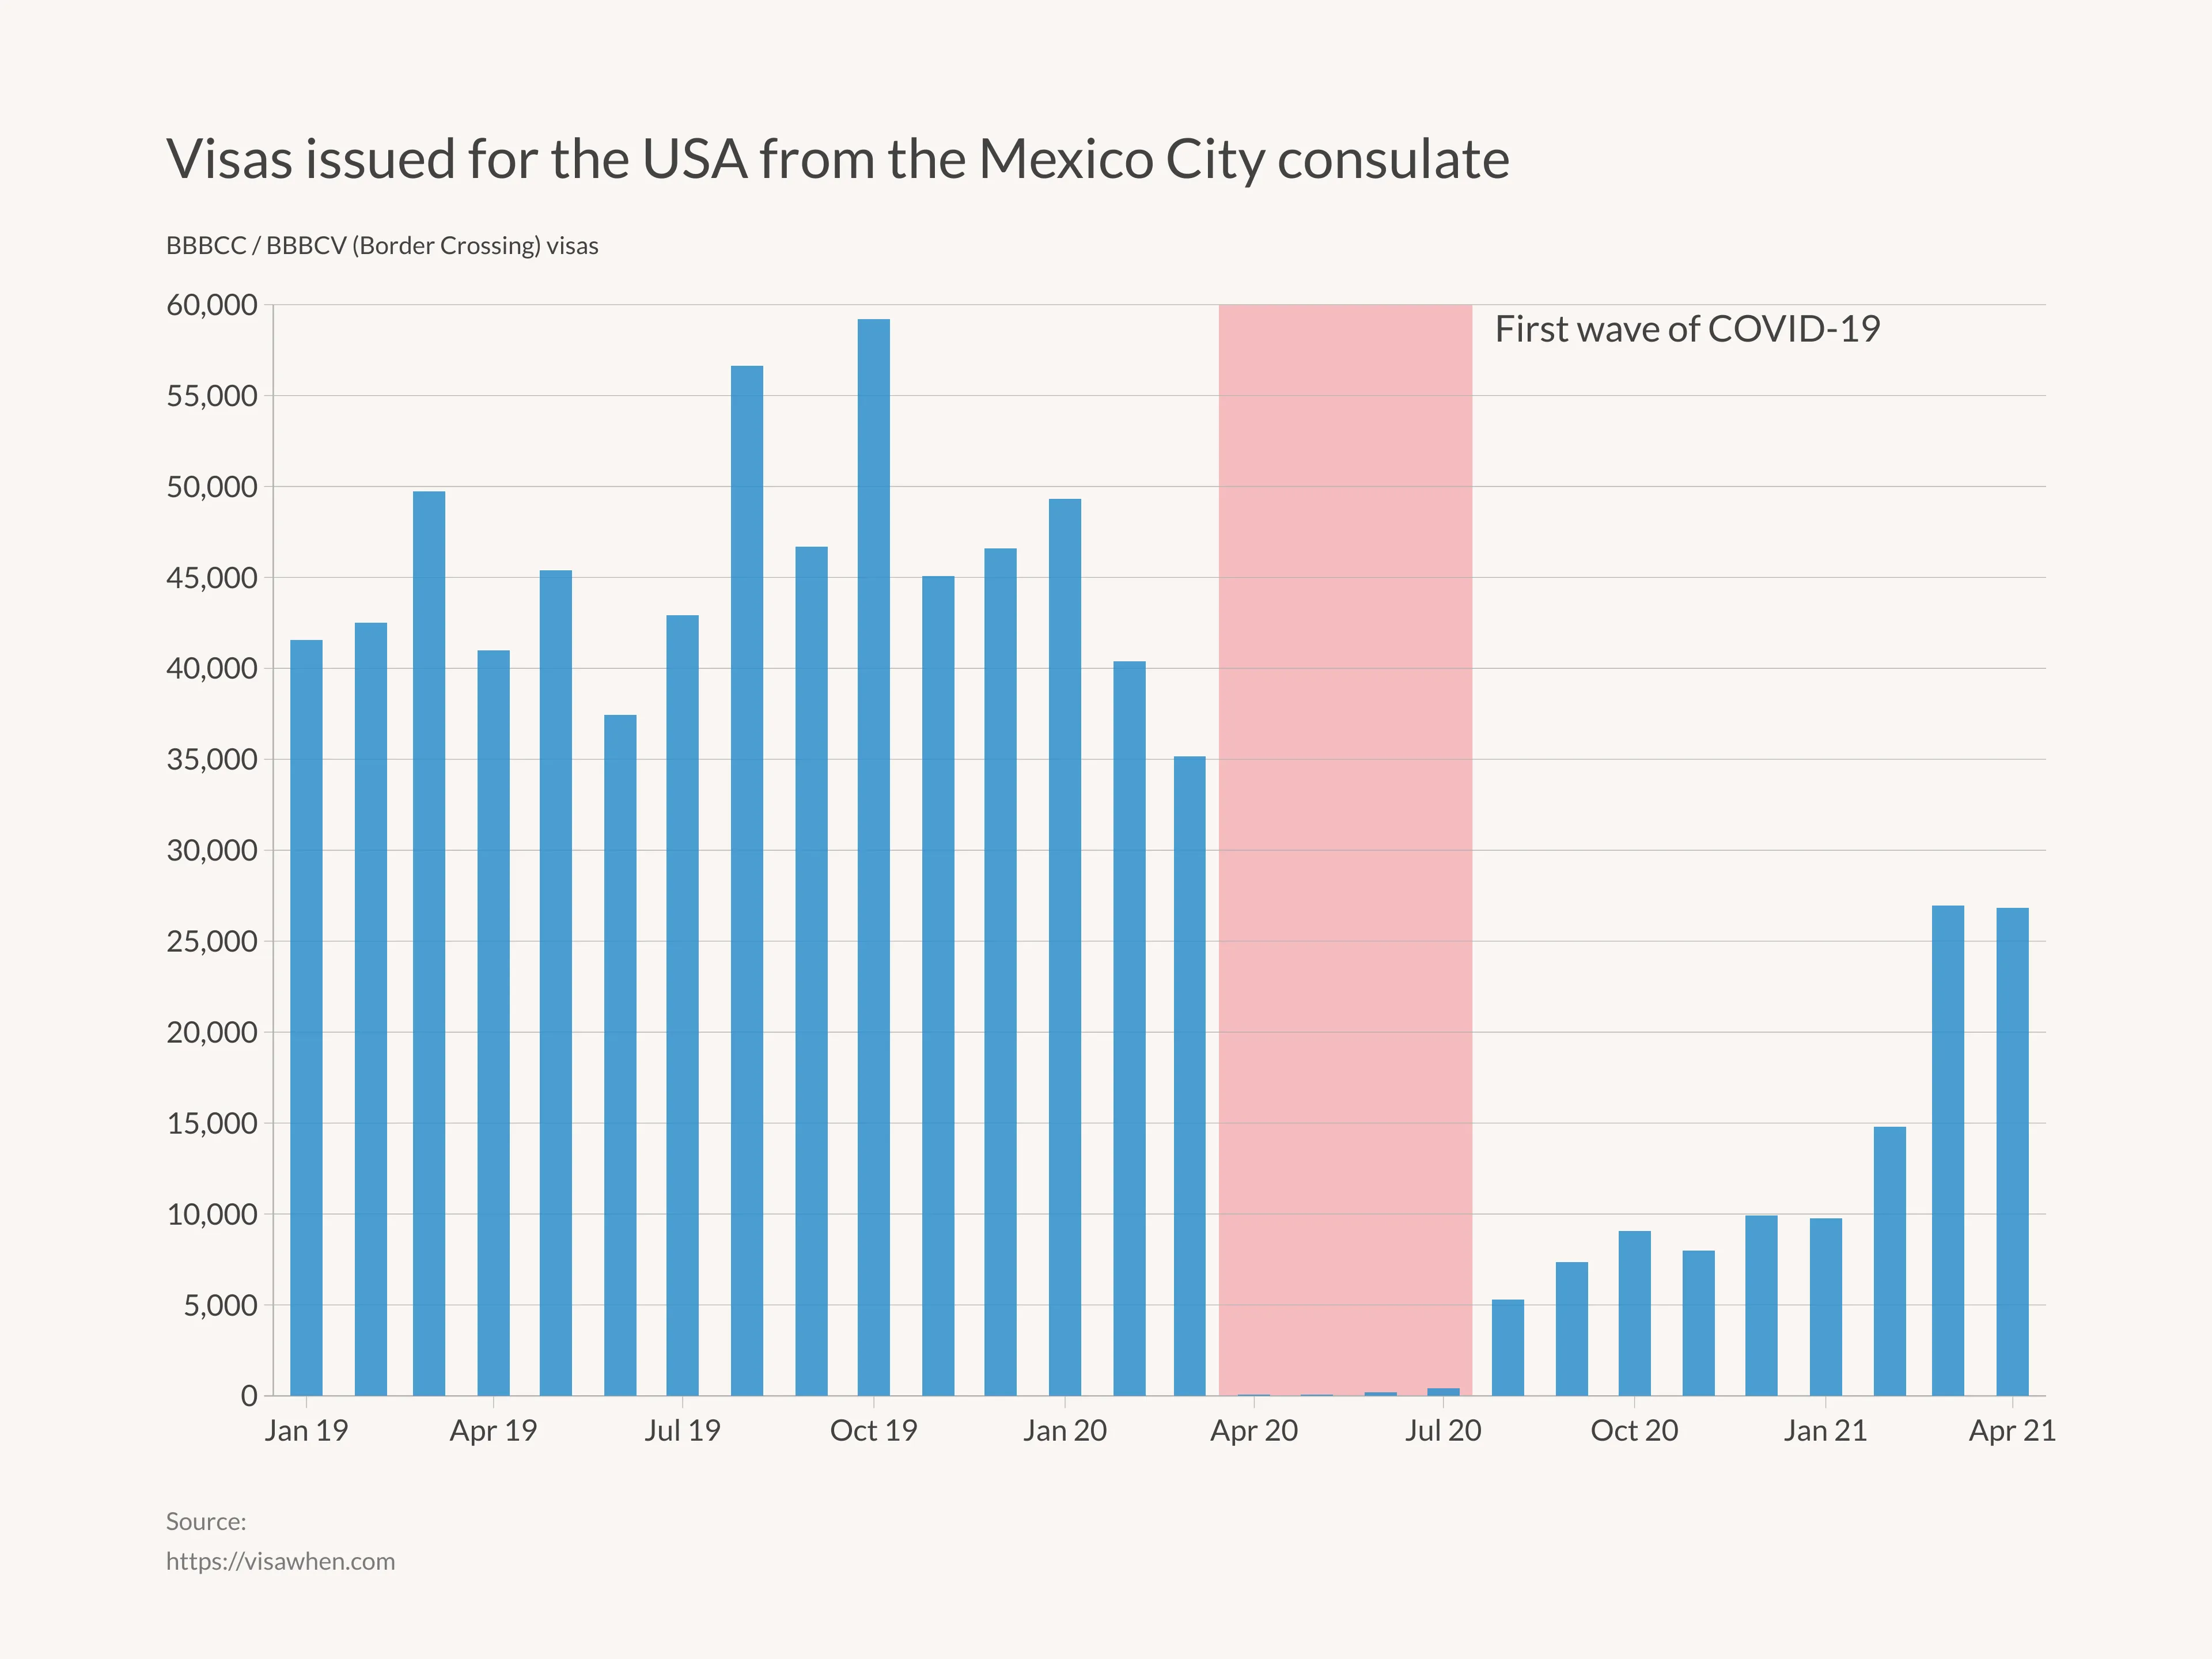
The US consulate in Mexico City is the one that provides most visas worldwide with an average of over 46000 issued monthly.
In March 2020, as the world came to a standstill, this number decreased drastically to less than 100. Only one year later, in March 2021 the number of visas processed started to be notably higher with just over 26000 monthly issuances. One can only wonder what kind of backlog they must have accumulated.
Source: https://visawhen.com/

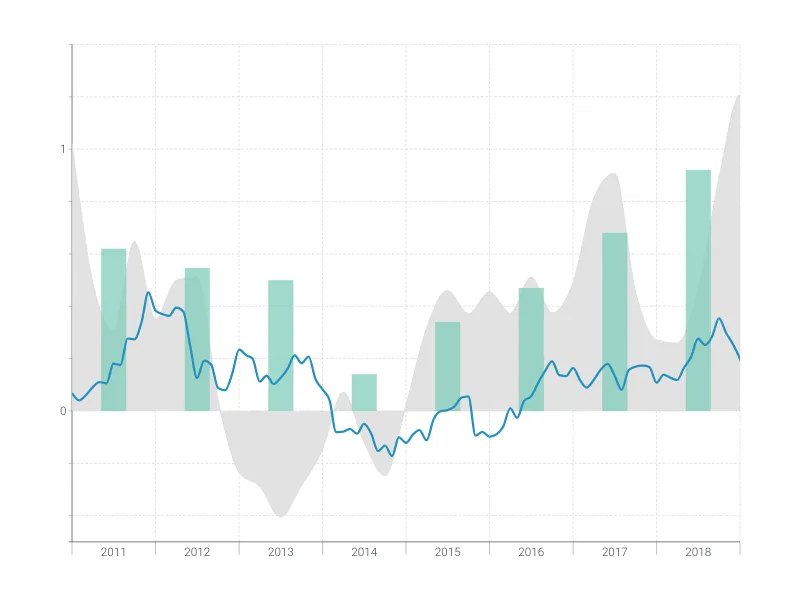
This is an example of Vizzlo's “Time Series Graph”
Complex time series graph to visualize detailed financial data.
Finance & Economics Bar & Column charts Line & Area charts Time-based charts