Chart Vizzard
Vizzlo's AI-based chart generatorGrowing Leaf Chart
Communicate your project growth with a visual metaphor of growing leaves on a tree.
Features
- Custom colors
- Freely adjustable sizes
What is a growing leaf chart?
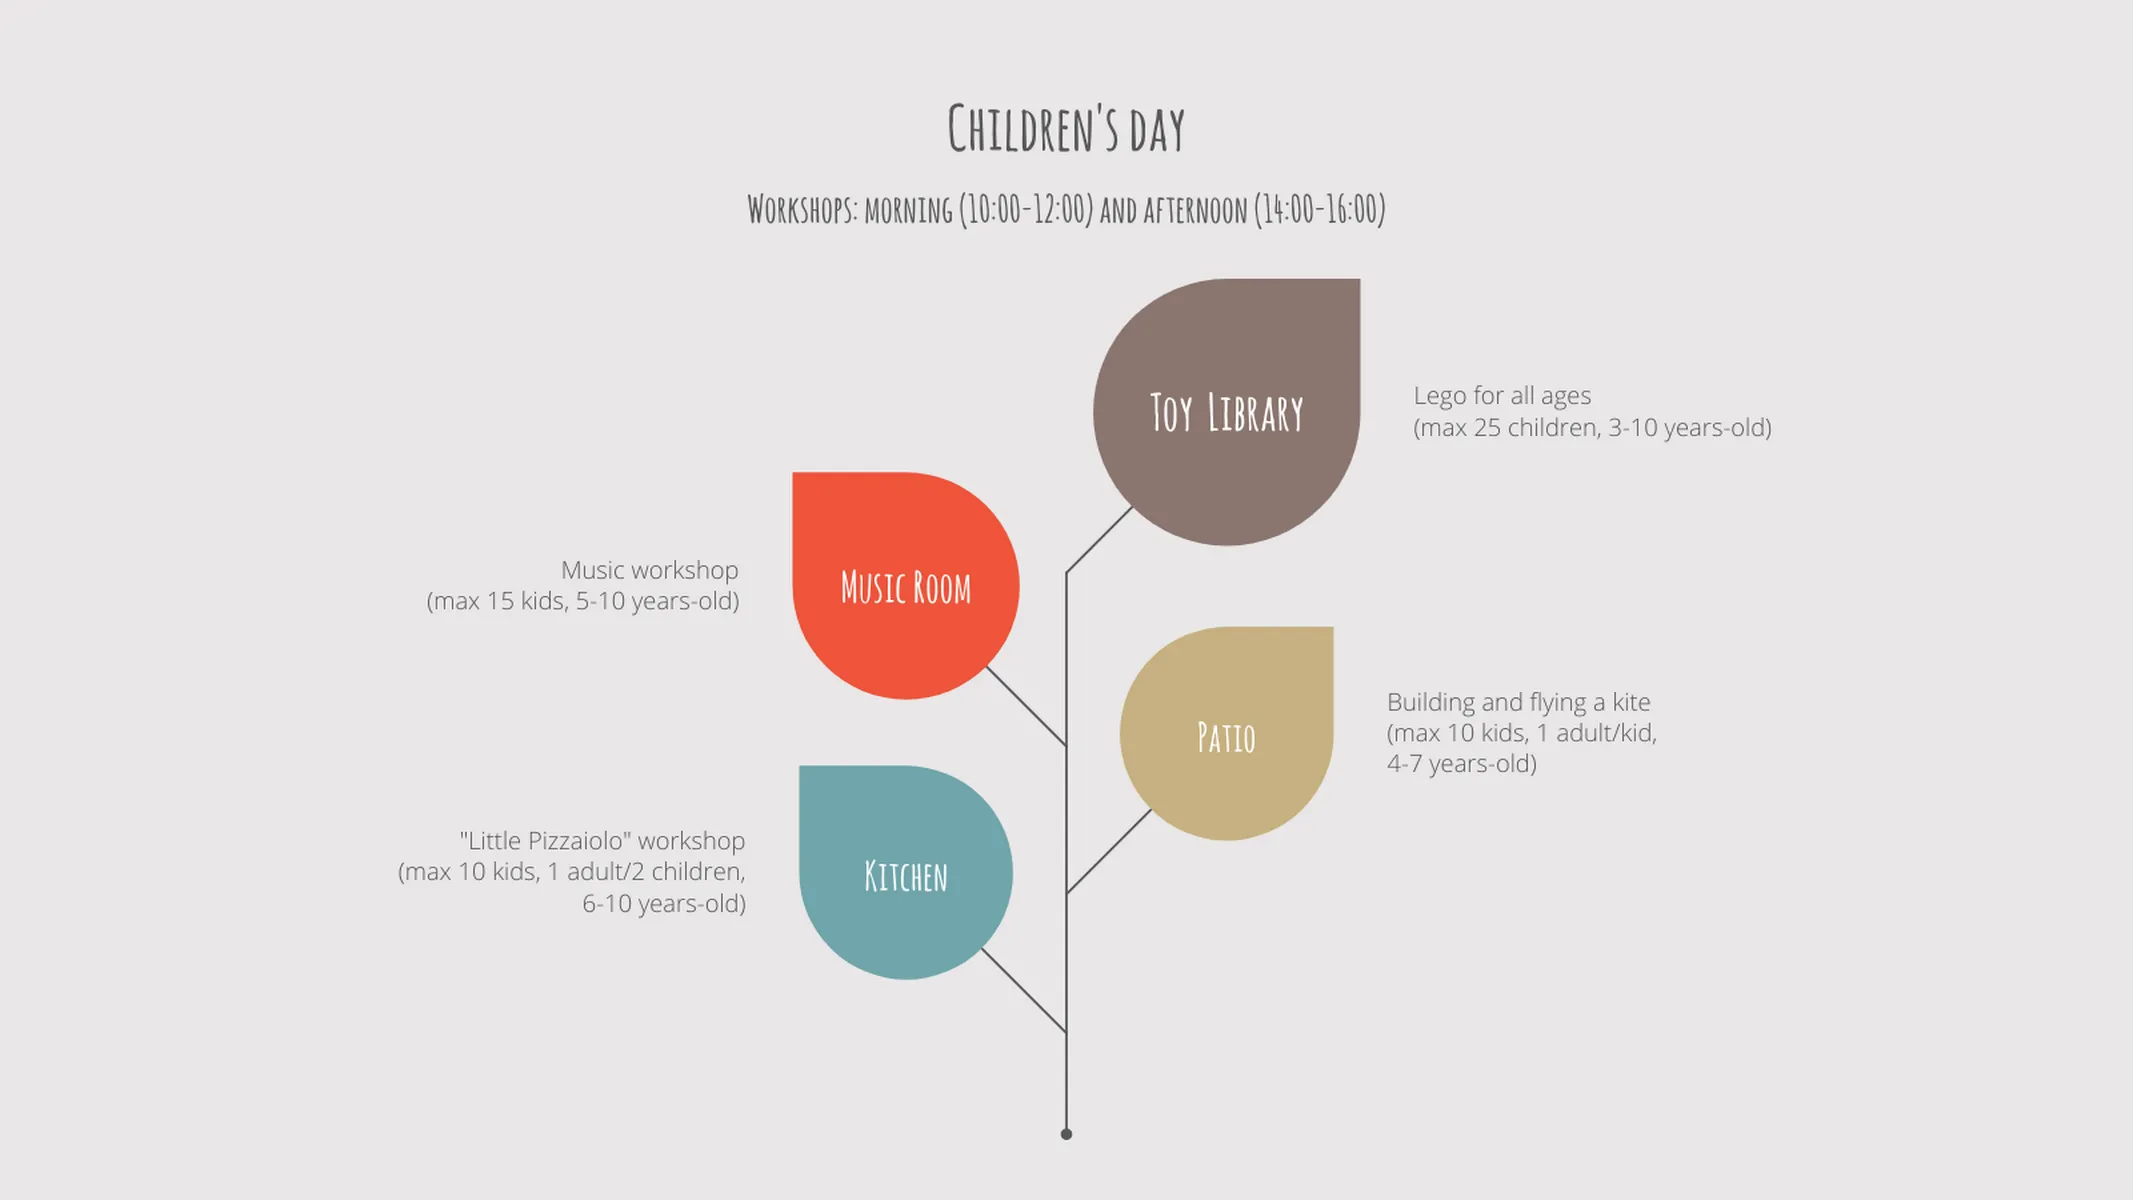
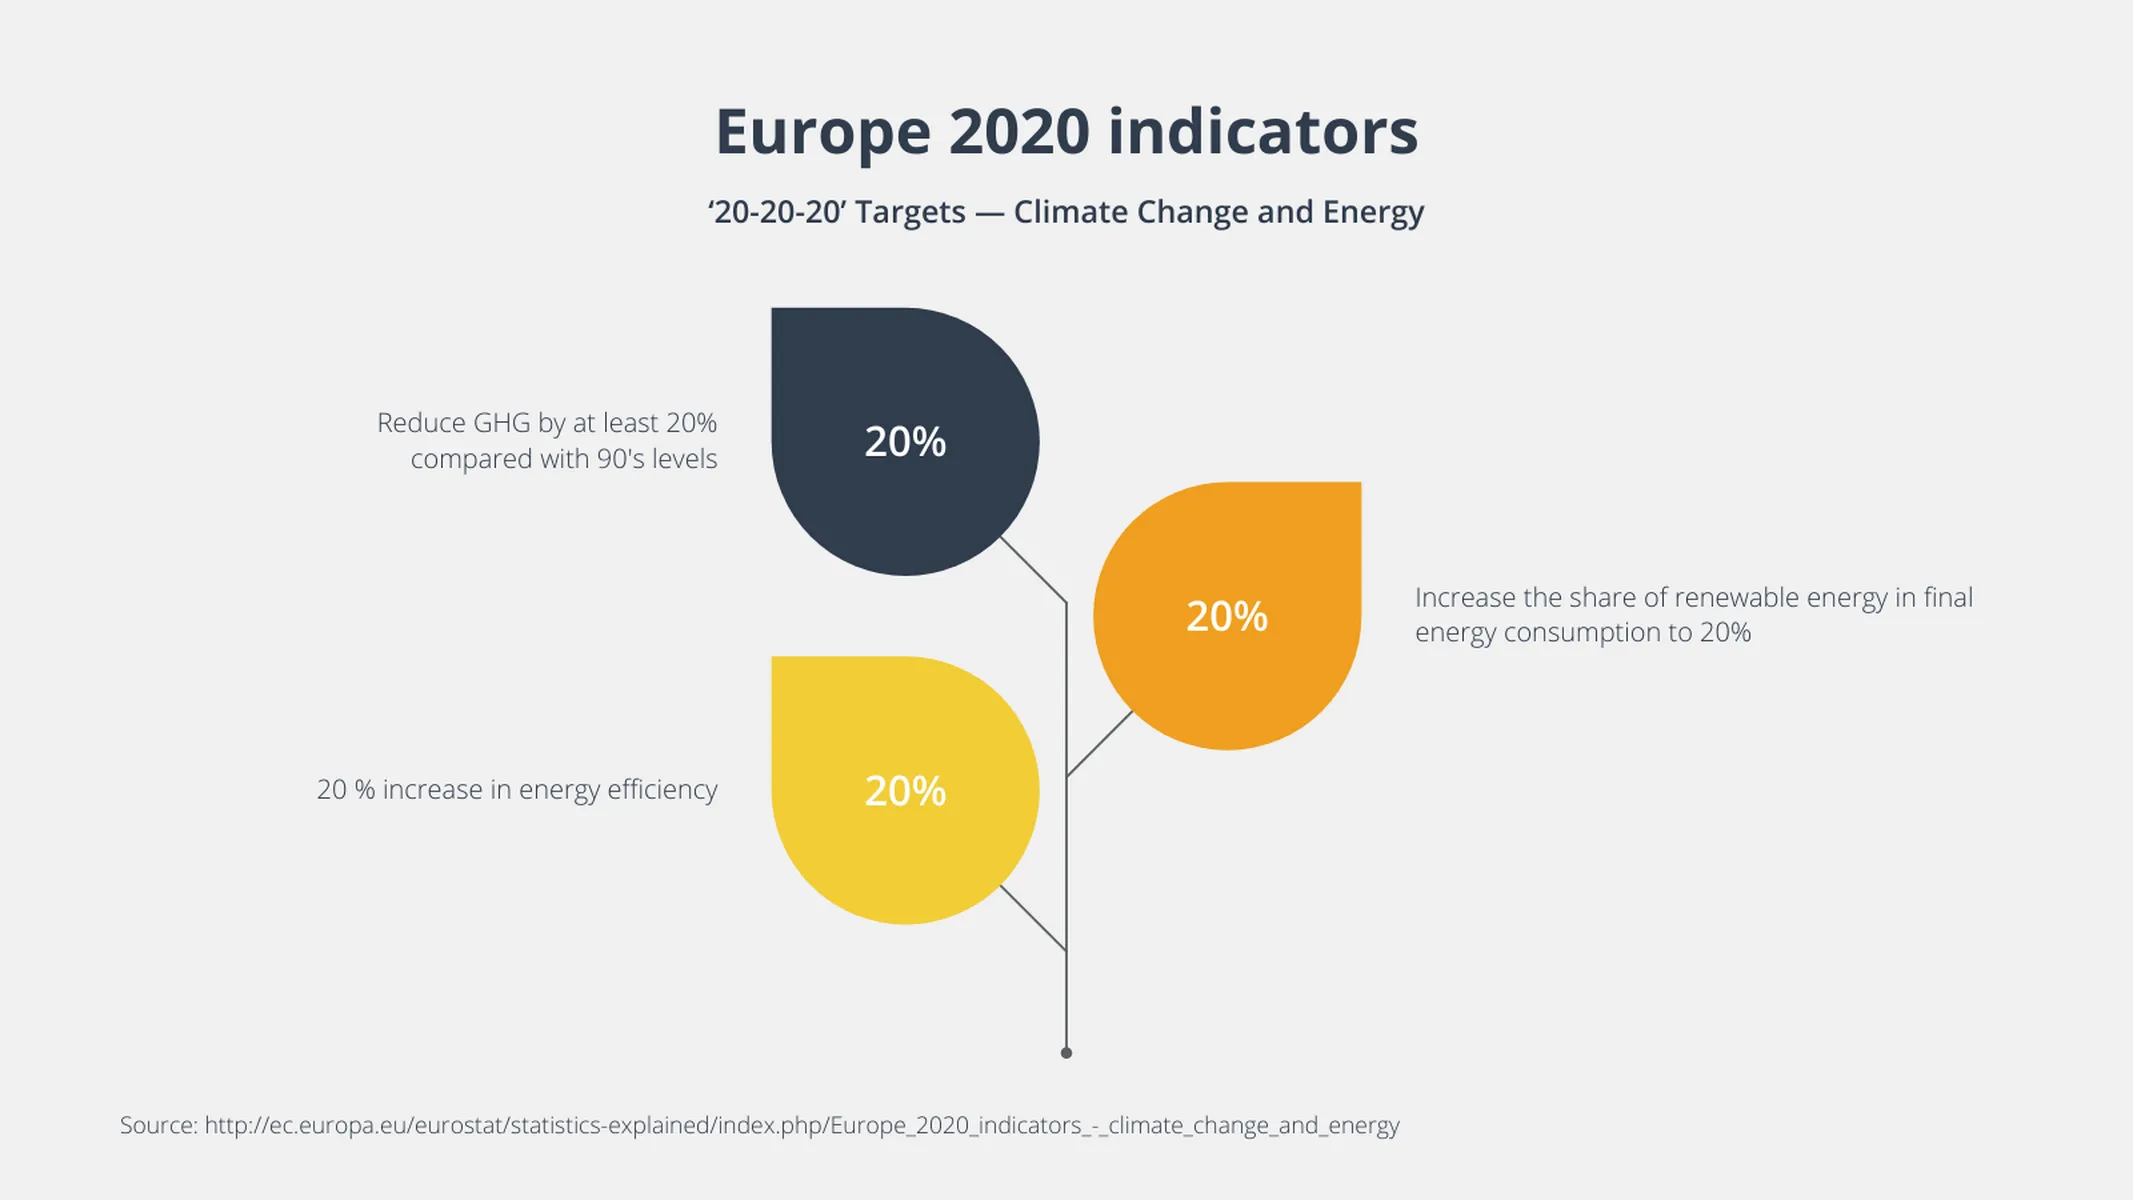
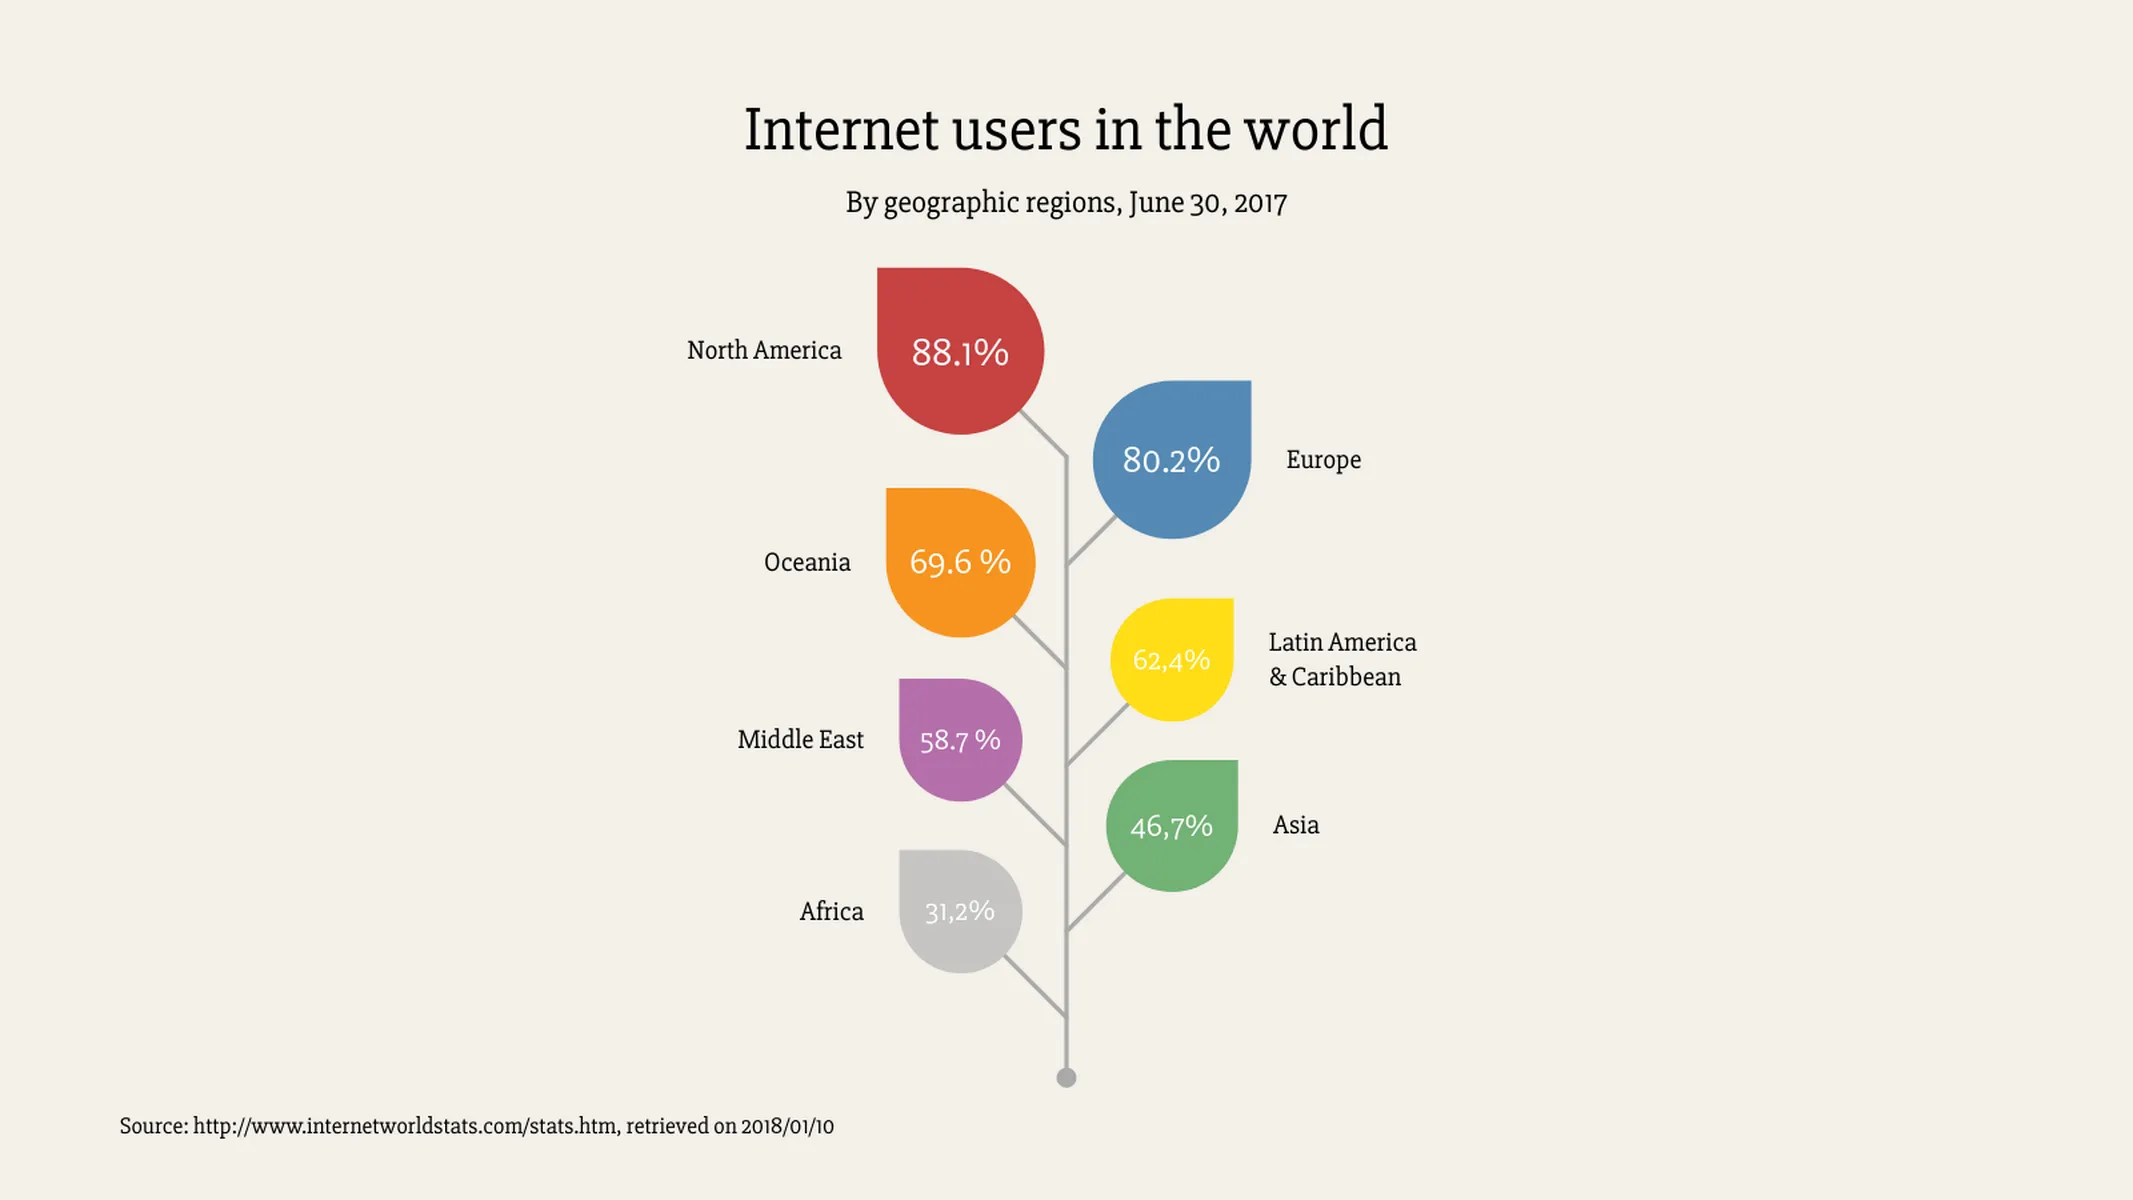
A growing leaf chart is a pictorial chart, in which you can quickly illustrate connected developments and results of a process. Because of its visual analogy of nature and spring, this beautiful chart is ideal for communicating progress and growth.
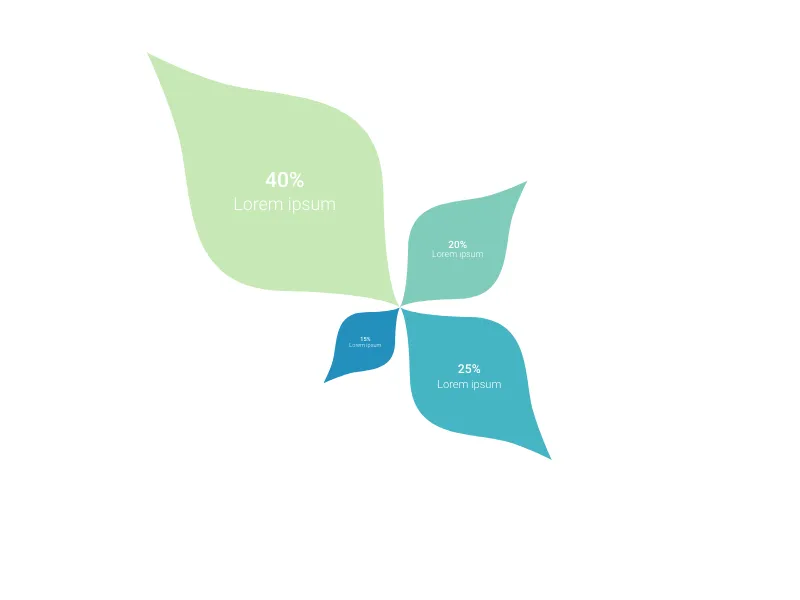
In this plugin, you can define the size and colors of leaves reflecting, for example, the increase of sales figures or projecting your growth goals for the year ahead.
How to make a growing leaf chart with Vizzlo?
Create a stunning growing leaf chart in seconds! Check the examples to get inspired and follow these easy steps:
- Click on the leaves to edit them: you can use numbers or text inside them. Use the handles to adjust their sizes.
- Add beside each leaf a small description.
- Alternatively, use the cards in the sidebar to quickly enter your text, and change the size and colors of the leaves.
- Hover the mouse over the stem to add new leaves. Drag and drop them to reorganize your content as you wish.
- Explore the colors and font combinations of the Vizzlo themes in the tab “Appearance” of the sidebar or customize your own.
Growing Leaf Chart: What's new?
Growing Leaf Chart Alternatives
Enhance your productivity
Create a Growing Leaf Chart directly in the tools you love

Create a Growing Leaf Chart in PowerPoint with
Vizzlo's add-in
Loved by professionals around the world


Visualizations your audience won’t forget
Convey abstract concepts and data with professionally designed
charts and graphics you can easily edit and customize.
