Chart Vizzard
Vizzlo's AI-based chart generatorIcon Timeline
Create a simple timeline with icons.
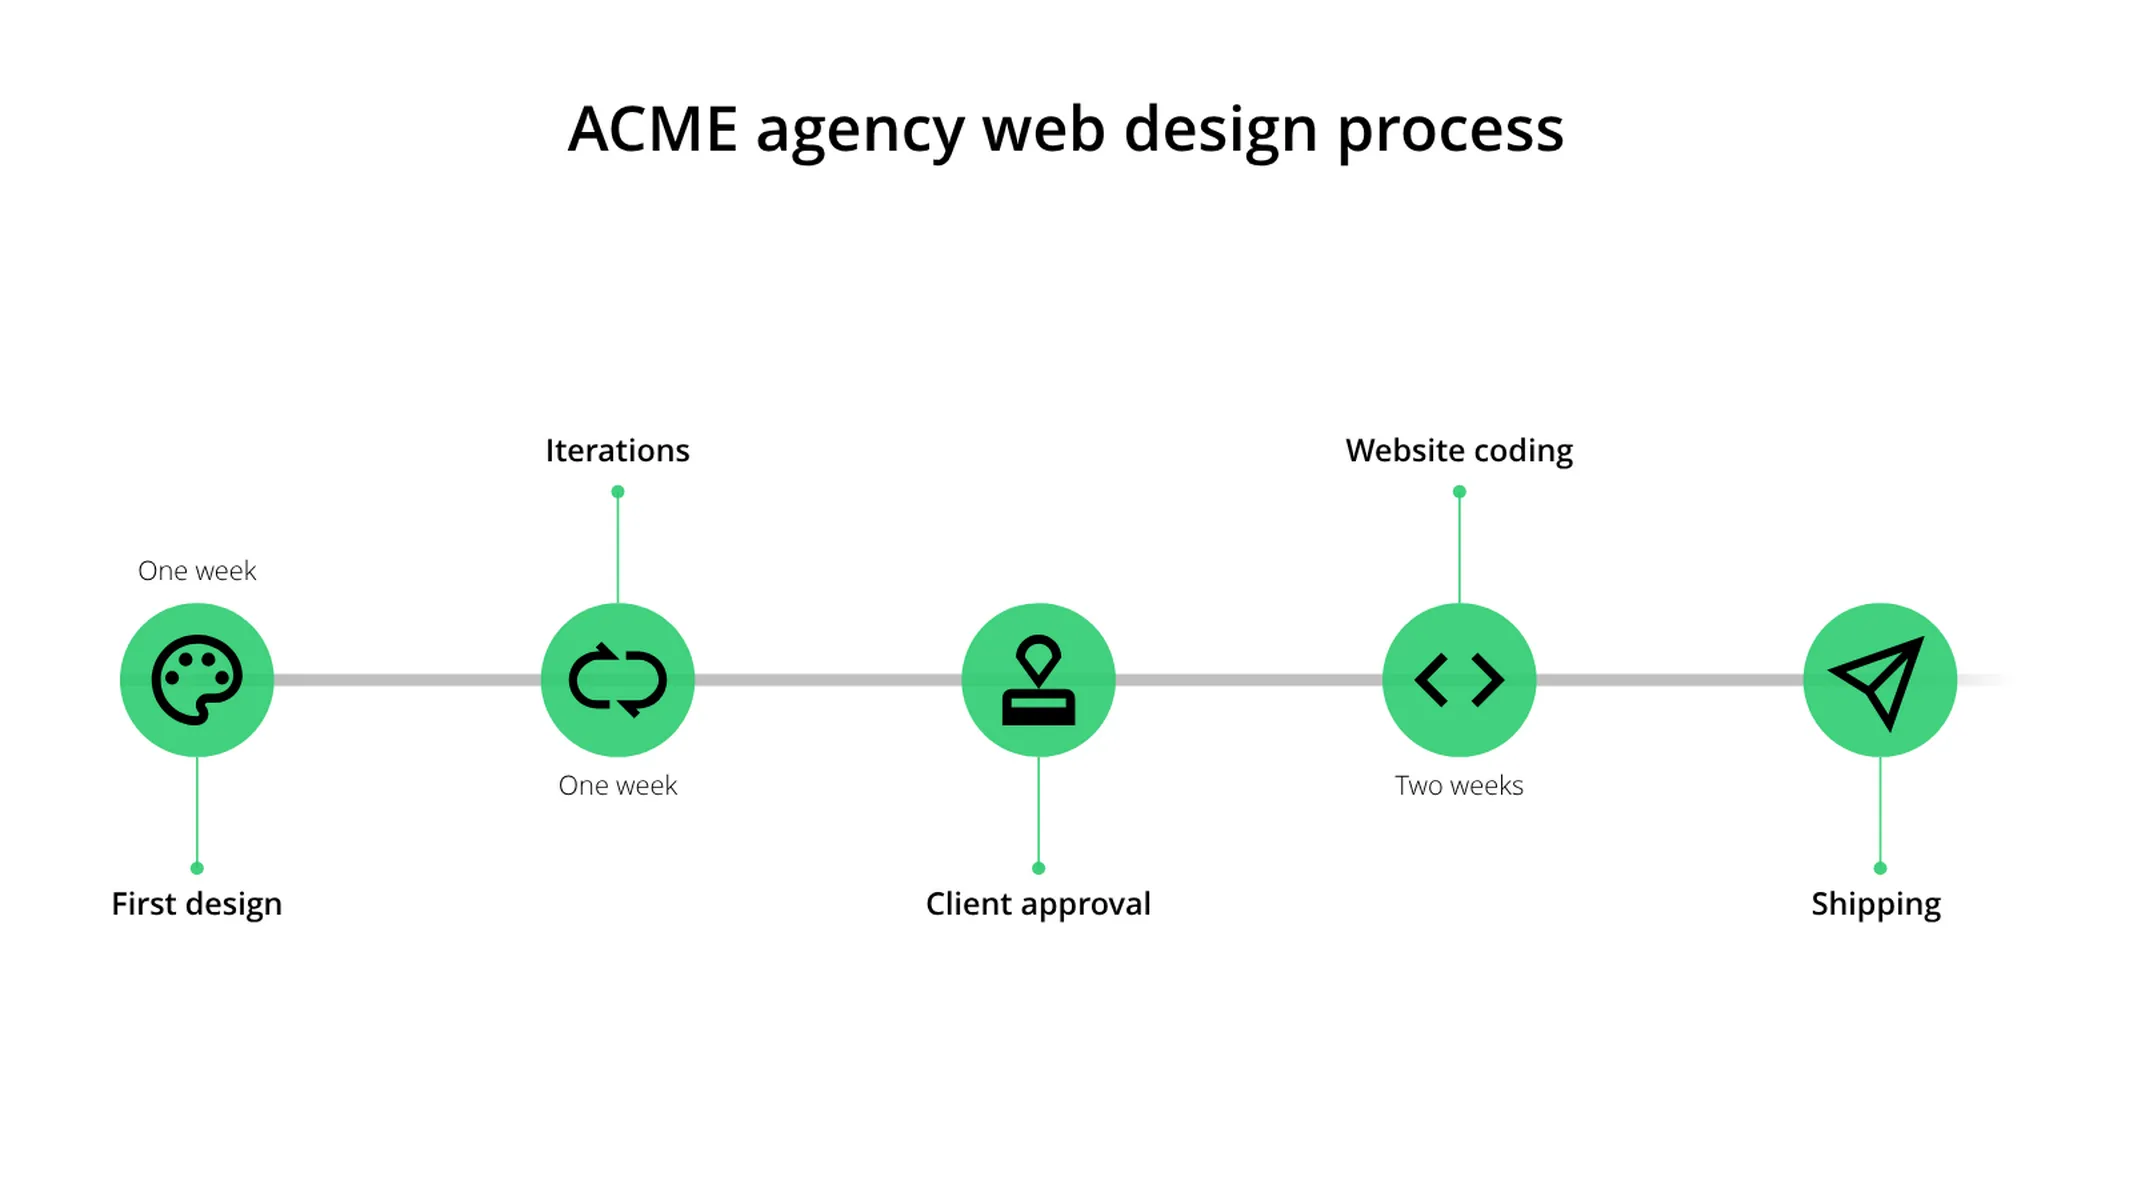
What is an Icon Timeline?
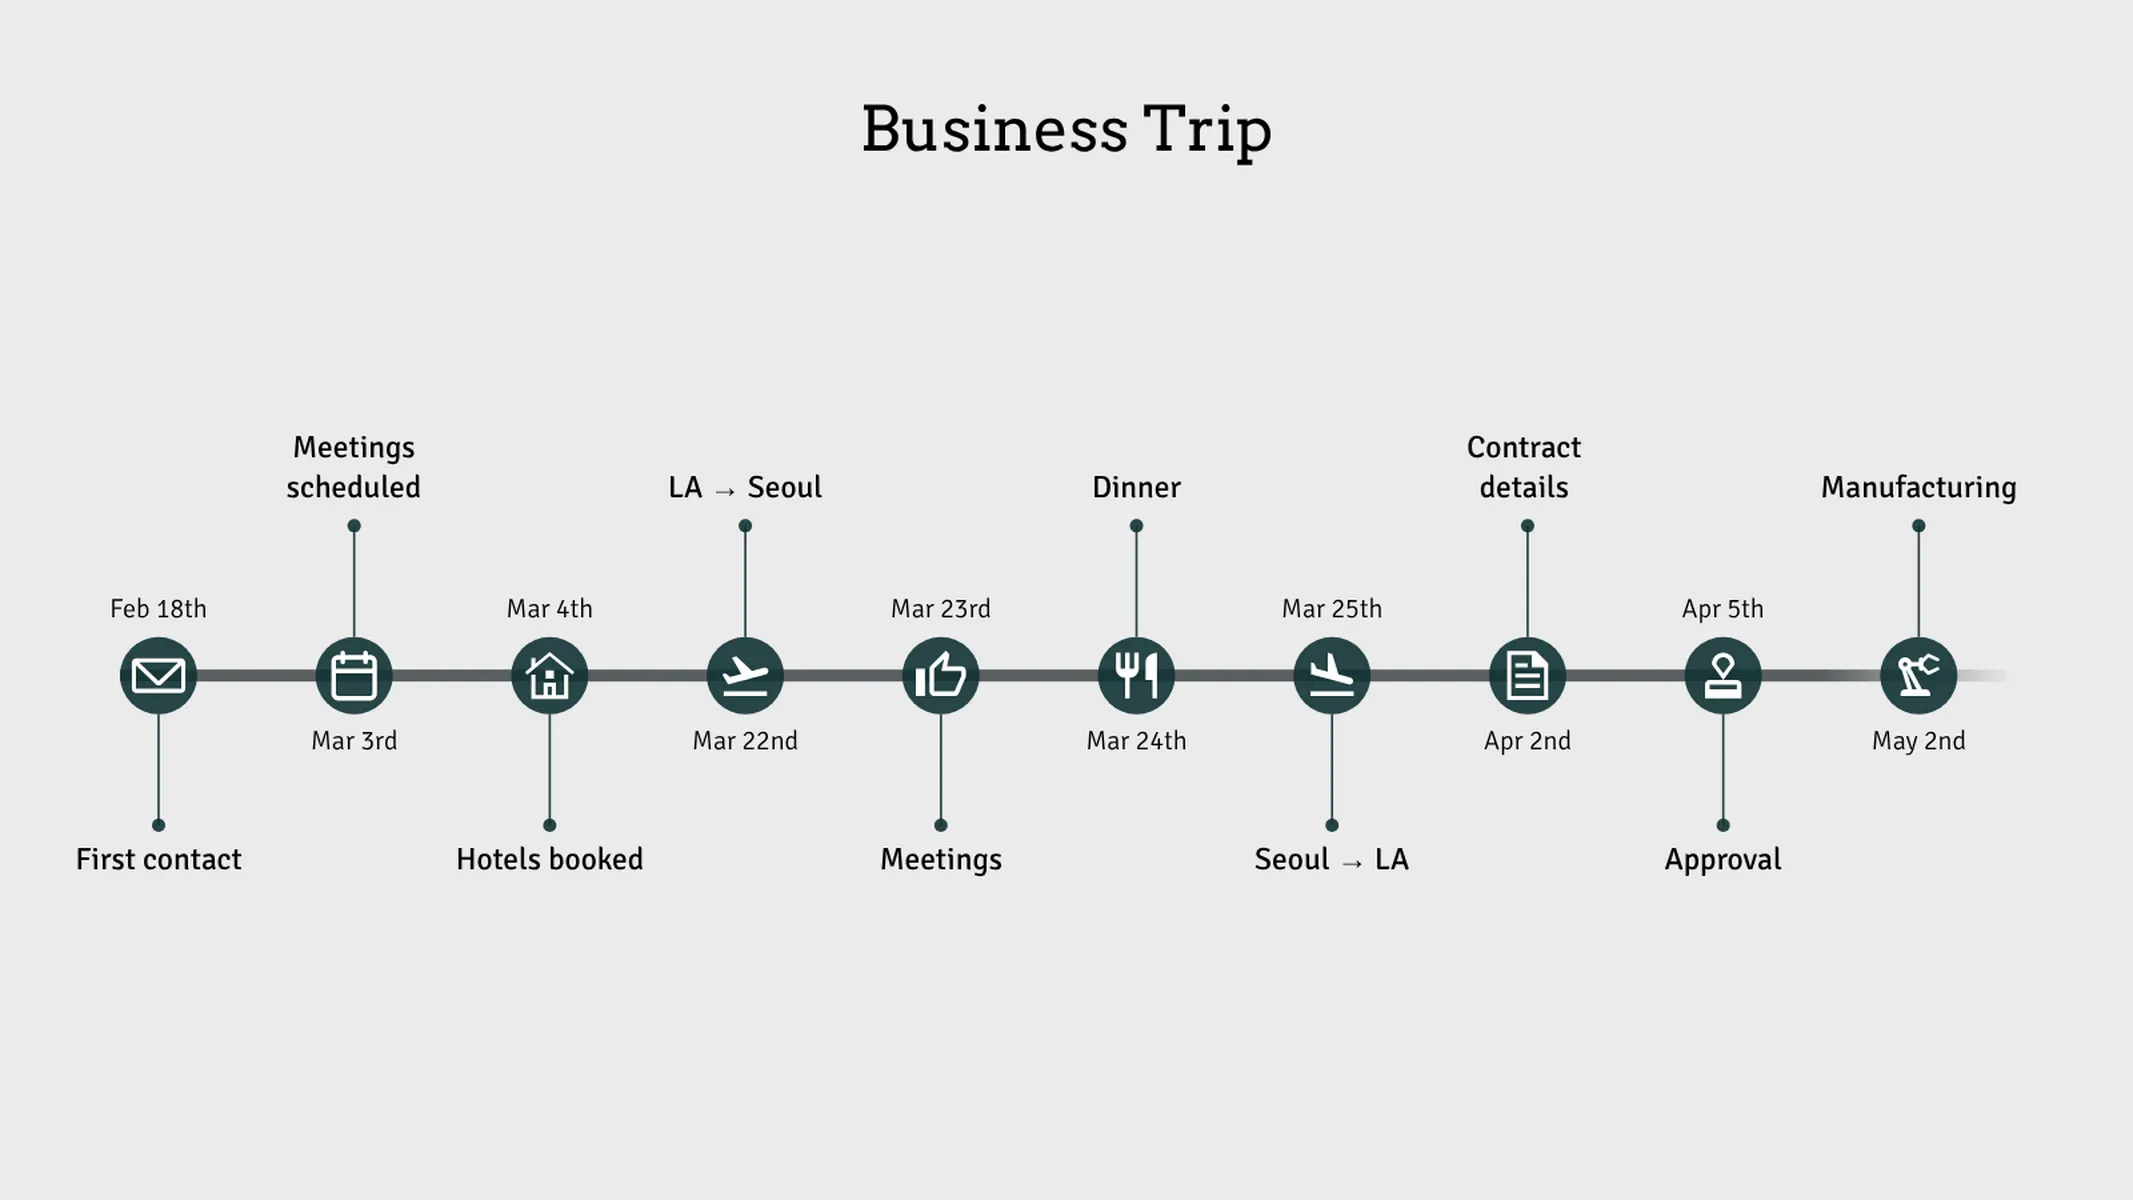
The Icon Timeline transforms chronological data into a visually engaging timeline with meaningful icons. This versatile visualization is perfect for documenting project milestones, business journeys, process steps, or any sequence of events that benefits from clear visual markers.
Key Features
- Visual milestone markers: Icons inside colored circles mark each event on the timeline
- Customizable appearance: Full color control for milestone elements with theme integration
- Extensive icon library: Over 70 icons covering business, travel, communication, and personal categories
- Adjustable icon size: Slider control for optimal visual balance
- Rich text support: Formatted titles and dates for each milestone
- Drag-and-drop reordering: Easily rearrange milestones directly on the canvas
Best Use Cases
- Project timelines: Document key phases and deliverables in a project
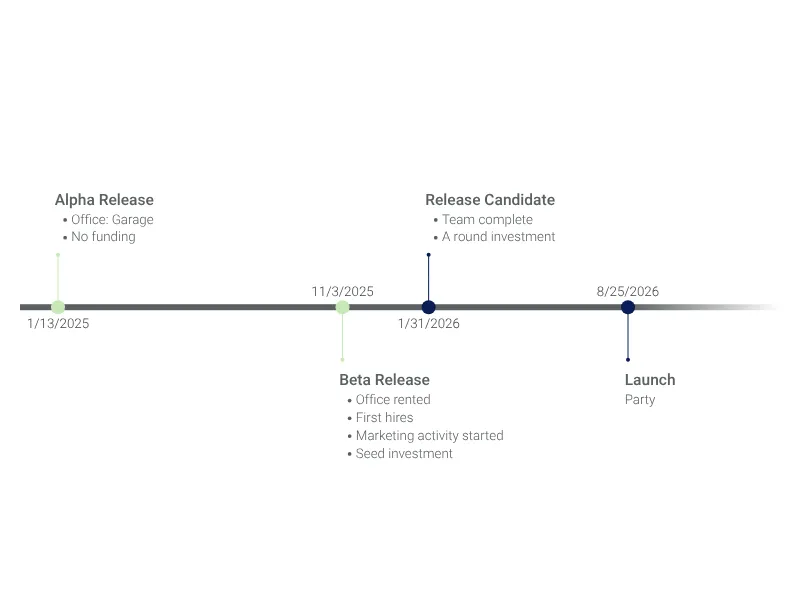
- Company milestones: Showcase business achievements and growth over time
- Process documentation: Illustrate step-by-step workflows and procedures
- Event planning: Outline conference schedules or product launch sequences
- Travel itineraries: Map out business trips or vacation plans
- Personal achievements: Track career progression or educational milestones
- Product roadmaps: Communicate feature releases and development stages
Configuration Options
Customize your timeline with intuitive controls:
- Icon size: Slider control (0-100%) to adjust milestone marker size
- Milestone color: Custom color picker for timeline markers, with automatic icon contrast adjustment
Icon Library
Choose from over 70 meaningful icons organized by category:
- Business: Key, approval, dollar, euro, money, file, calendar, chart, gear wheel, manufacturing, tools
- Communication: Letter, phone, send message, campaign, @ sign, info
- Travel: Flight, flight takeoff, flight landing, house, tour, running, walking
- Time: Clock, alarm, hourglass, calendar
- Status: Check mark, close, warning sign, denied, thumbs up, thumbs down, flag
- Creative: Light bulb, design, palette, pen, scissors, magic wand, code
- Celebration: Cake, gift, trophy, star, cocktail, wine, restaurant
- Nature: Sun, snowflake, flower, tree, palm
- Personal: Heart, letter, lips, rings, rose, lightning
Data Structure
Each milestone consists of three elements:
- Icon: Visual symbol representing the event type
- Title: Heading text describing the milestone
- Date: Timestamp or label for when the event occurred
Support for up to 20 milestones allows comprehensive timeline documentation while maintaining visual clarity.
Presentation Strategies
Effective use typically includes:
- Chronological flow: Arrange events from earliest to latest (or vice versa)
- Icon variety: Use different icons to distinguish event types at a glance
- Concise labels: Keep titles brief for readability; use dates for context
- Visual balance: Adjust icon size based on the number of milestones
The Icon Timeline transforms ordinary chronological data into clear, memorable visual stories that communicate progress, processes, and sequences effectively.
Icon Timeline: What's new?
Create visualizations of timelines with the new icon timeline chart type!
Icon Timeline Alternatives
Enhance your productivity
Create a Icon Timeline directly in the tools you love

Create a Icon Timeline in PowerPoint with
Vizzlo's add-in

Loved by professionals around the world


Visualizations your audience won’t forget
Convey abstract concepts and data with professionally designed
charts and graphics you can easily edit and customize.