Chart Vizzard
Vizzlo's AI-based chart generatorCreate your Marimekko Chart in seconds
Our free chart maker tool helps you create beautiful data visualizations in no time. Online, in PowerPoint, or Google Slides.
Create your chart in 3 simple steps
- Create new Marimekko Chart
- Add your data
- Export or share
Why Vizzlo?
- Create professional charts in seconds
- Fully customizable, no design skills needed
- Create directly in PowerPoint & Google Slides
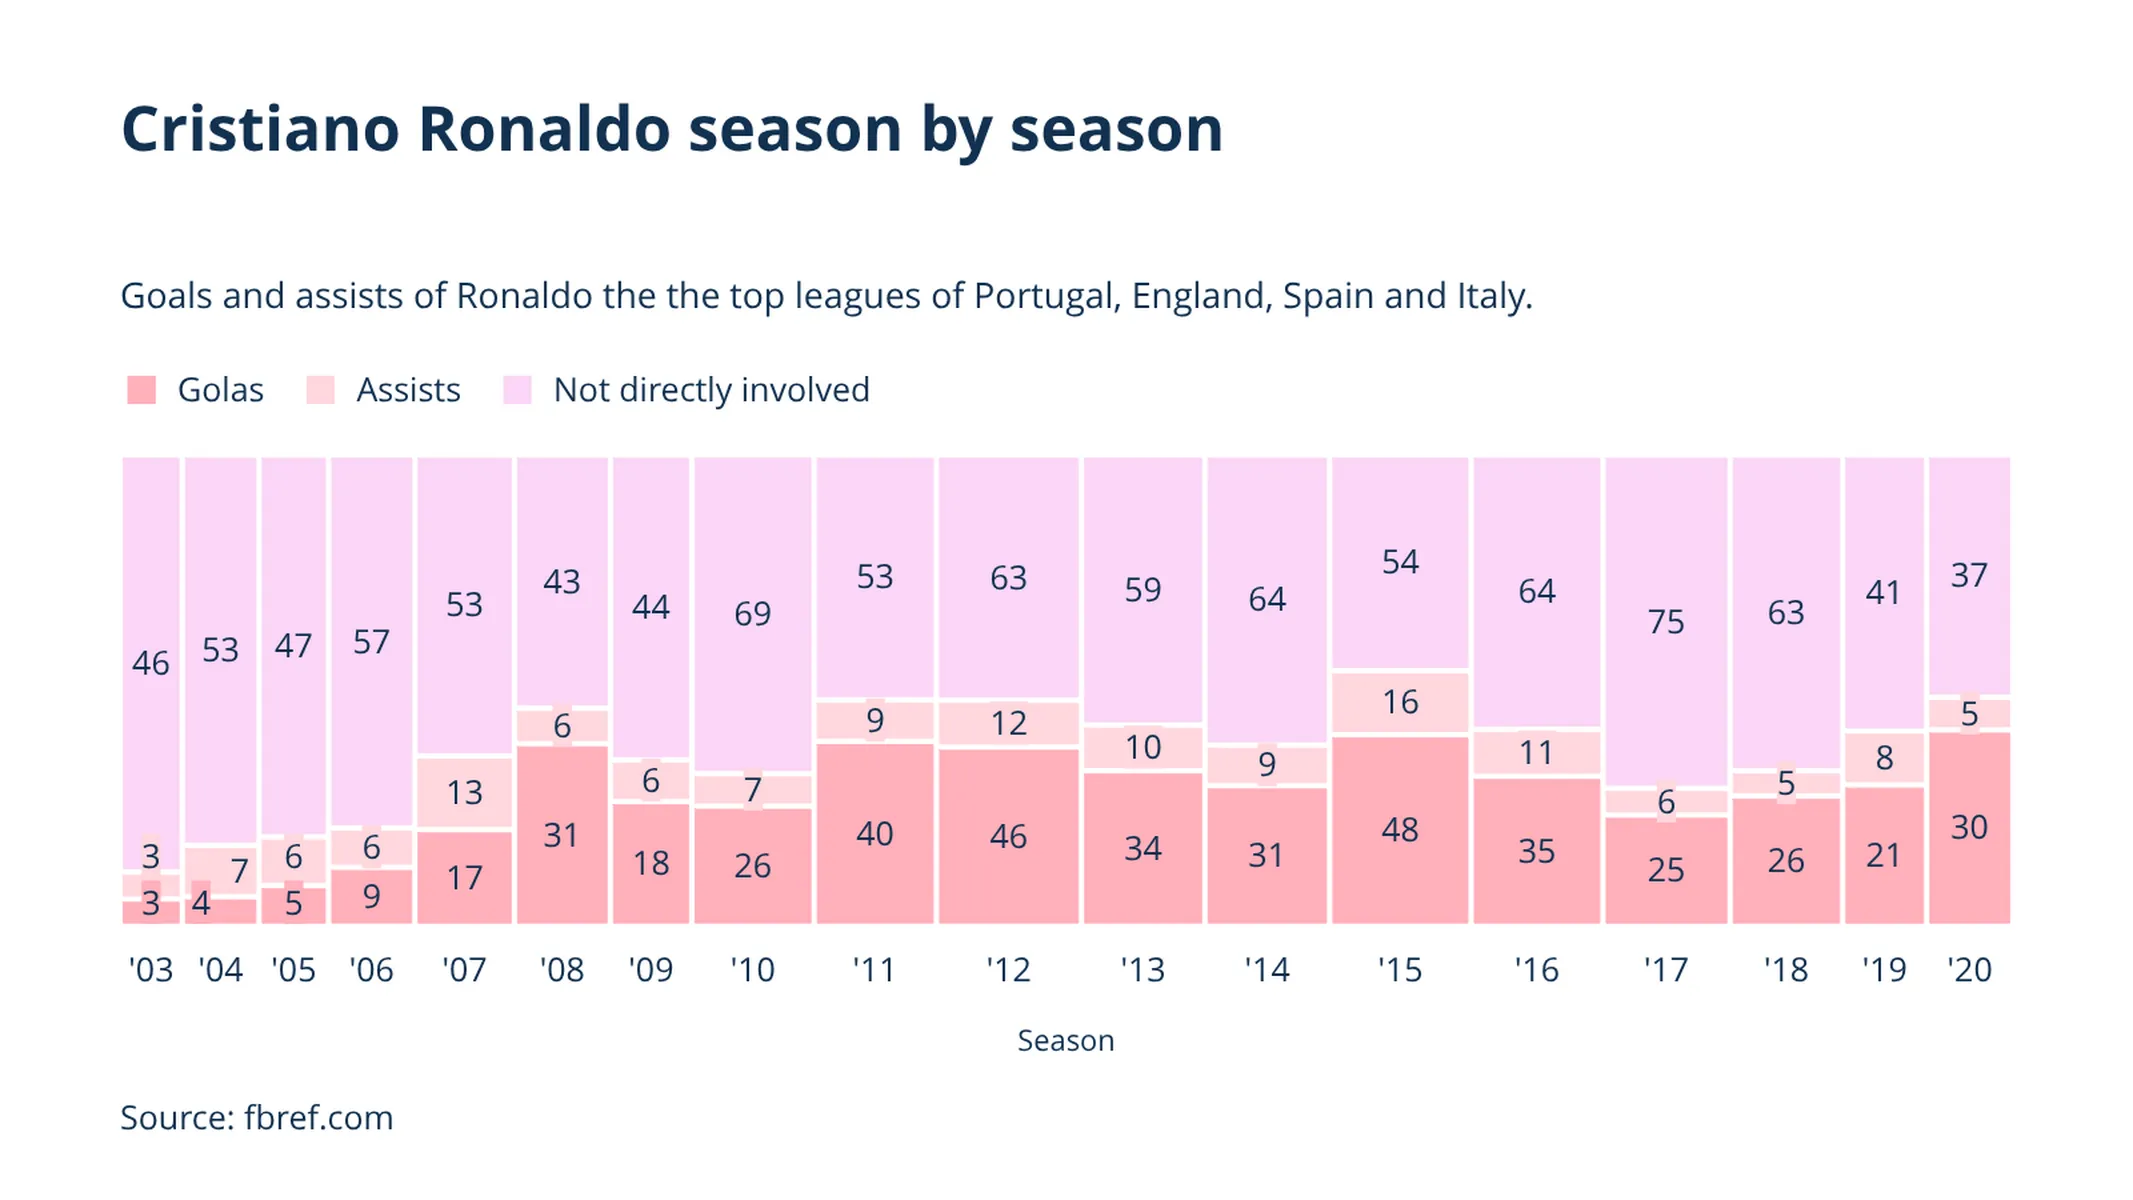
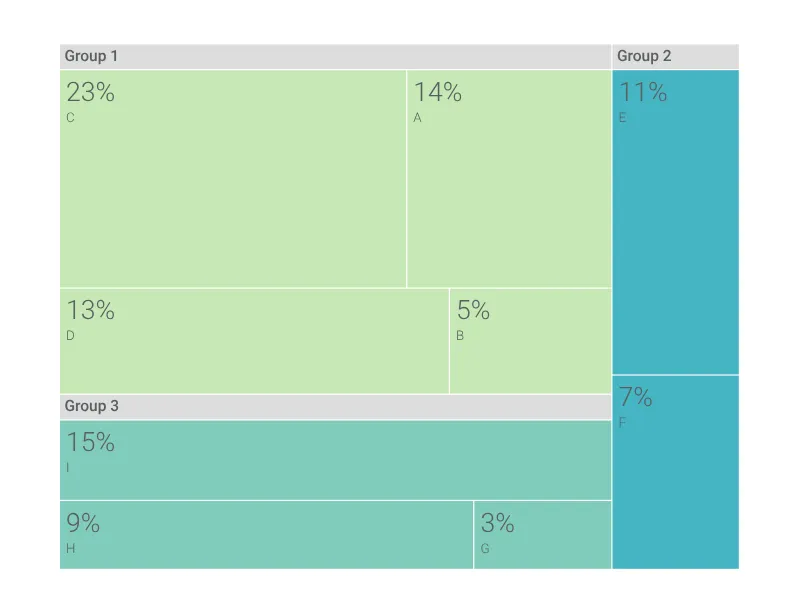
What is a Marimekko chart
A Marimekko chart will help you to display proportions over a pair of variables. At first glance, a Marimekko chart looks similar to a 100% Stacked Bar Graph. However, unlike in a stacked bar plot, in a Marimekko chart, both the heights and the widths of each segment are variable with a percentage scale. Marimekko charts are best used with smaller datasets because they become hard to read when there are many segments. They are a great choice when you want to give a more general overview of the data. Whenever you have data in which categories overlap, it is best to show how they relate to each other. This chart is also known as a Mosaic Plot or Mekko chart.
How to create a Marimekko chart
- Open Vizzlo and create a new Marimekko chart.
- Select the data that you want included in the Marimekko chart.
- Be sure to include the column and row headers, which will become the labels in the Marimekko chart.
- Give your chart a name. Click on the chart title at the top of the graph and the section becomes editable.
- Decide where to place the Markimekko chart vertically or horizontally.
- Export your chart as PNG, high-quality PDF or embed it into PowerPoint or Google Slides.
Marimekko chart maker: key features
- Switch between vertical and horizontal chart layout.
- Show up to 10 segments for each category.
- Add padding between your segments.
- Display your data as absolute or relative numbers.
- Sort your data separately for each category.
Marimekko Chart: What's new?
Custom colors can now be configureds for individual records.
You can now also display values as percentages or as absolute & percentage.
As with other visualizations on the platform, the Marimekko Chart now support slanted axis labels, too.
Add custom style support for value labels.
An issue causing the spreadsheet to malfunction was solved.
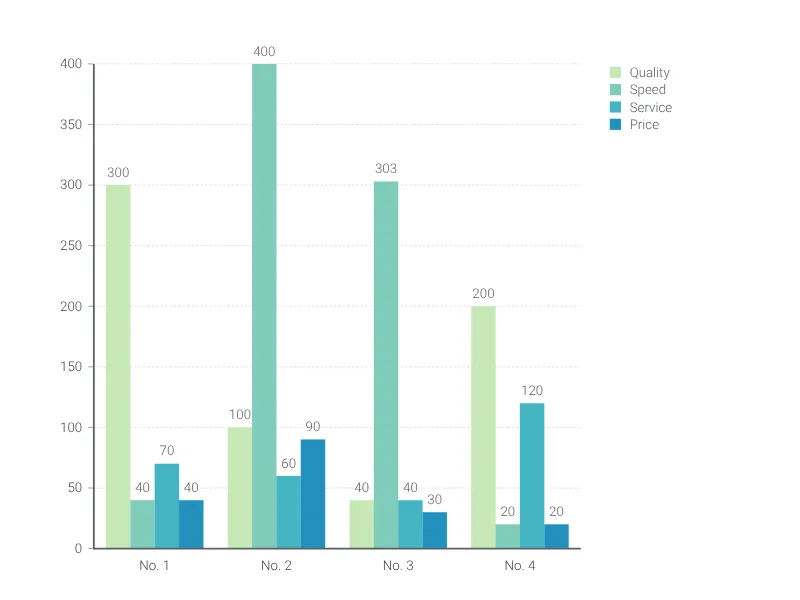
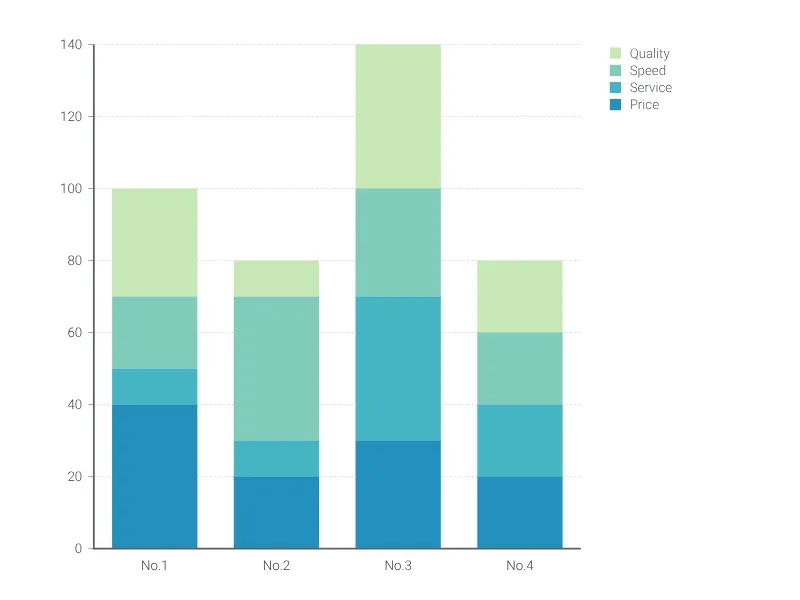
Marimekko Chart Alternatives
Use Cases
Bar & Column chartsEnhance your productivity
Create a Marimekko Chart directly in the tools you love

Create a Marimekko Chart in PowerPoint with
Vizzlo's add-in

Loved by professionals around the world


Visualizations your audience won’t forget
Convey abstract concepts and data with professionally designed
charts and graphics you can easily edit and customize.