Chart Vizzard
Vizzlo's AI-based chart generatorRibbon Bar Chart
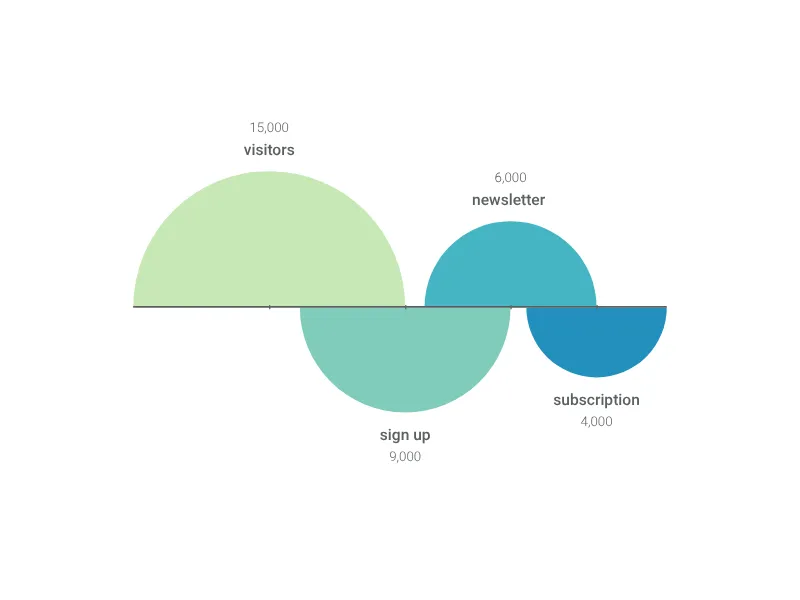
A horizontal bar chart that functions as a vertical list (or the other way round).
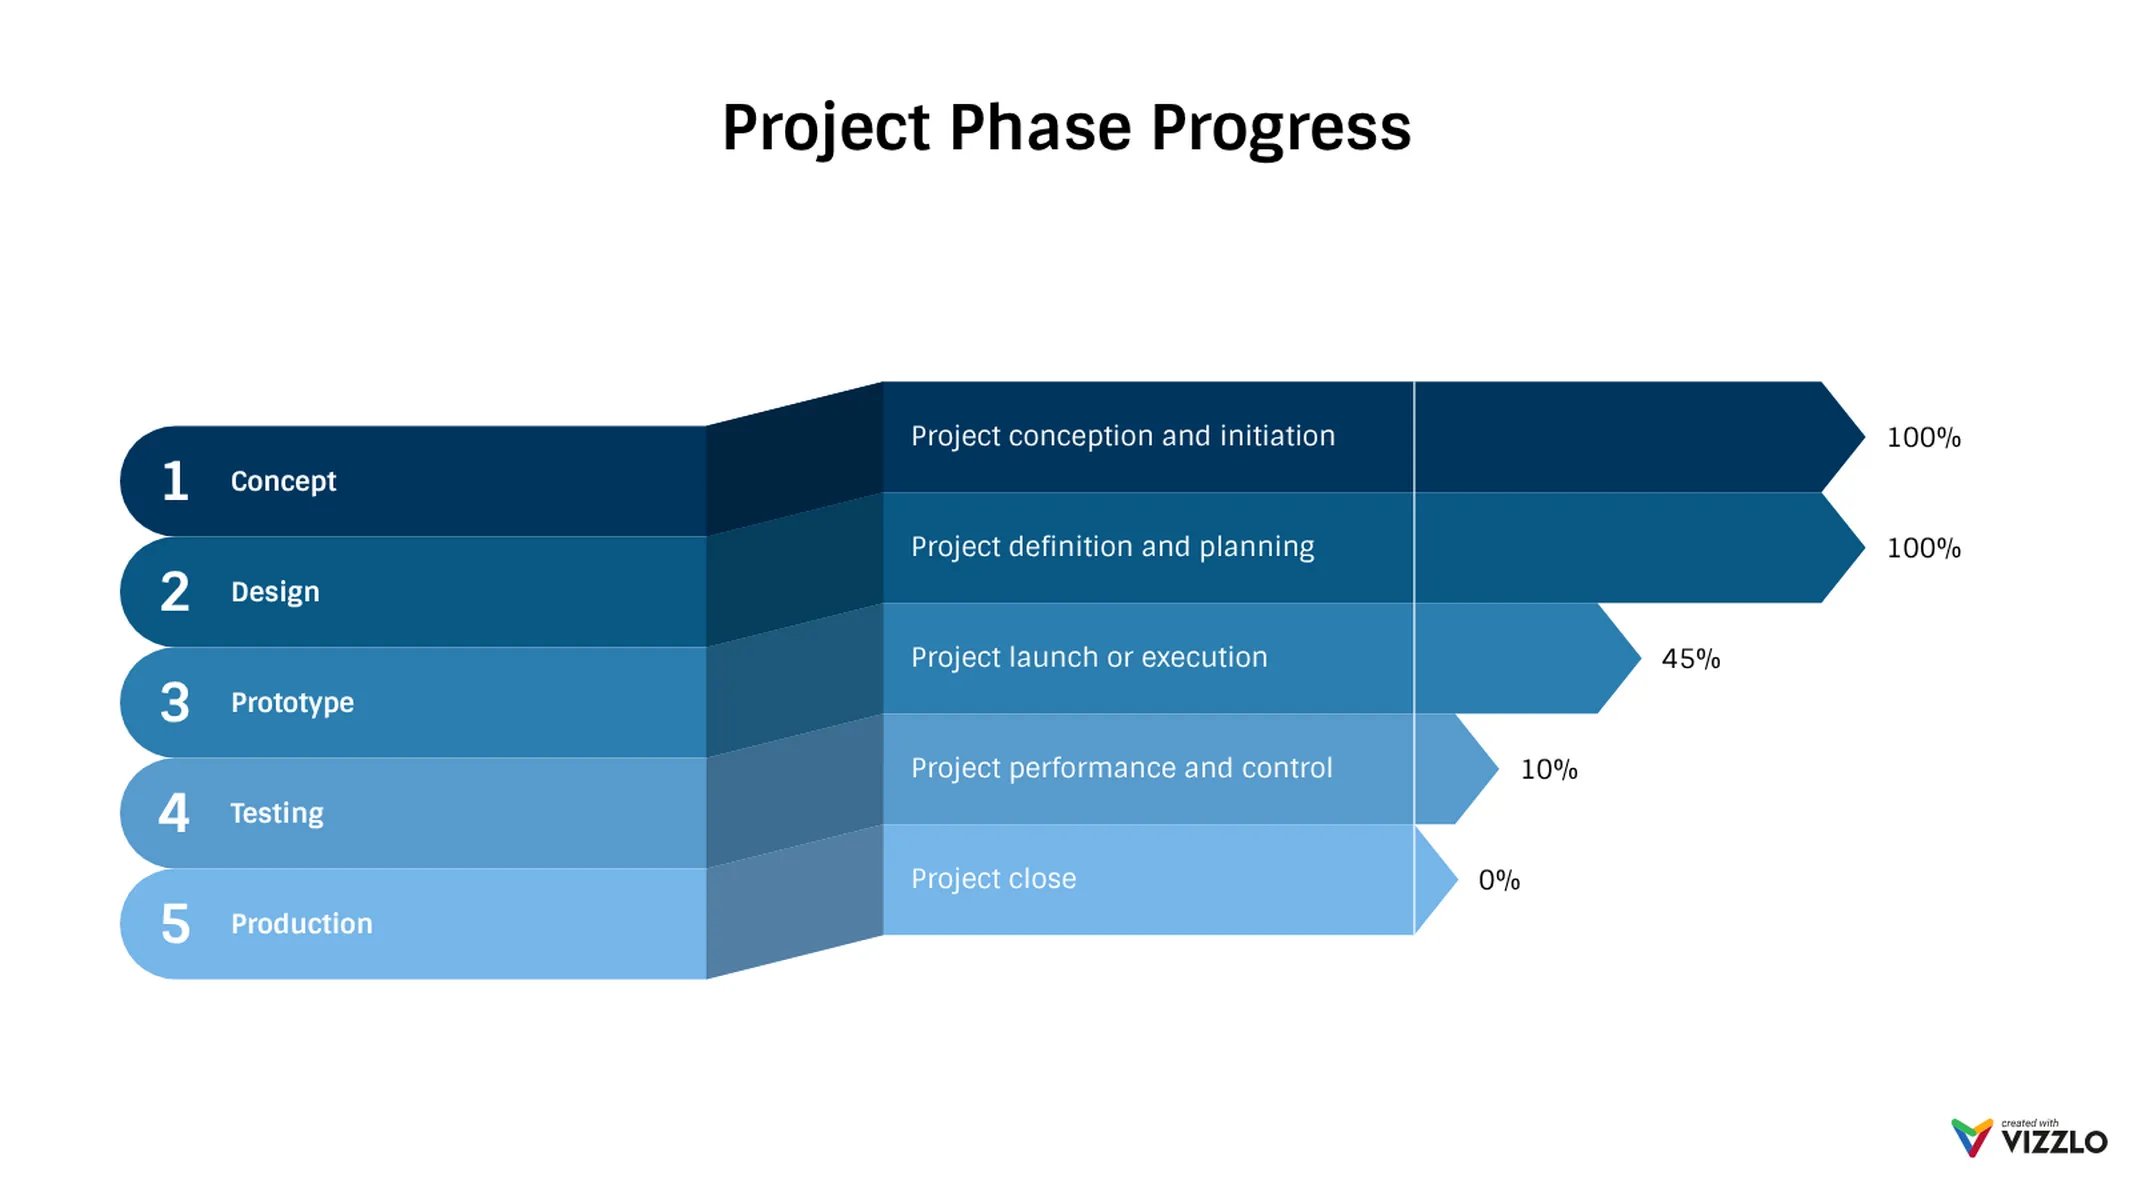
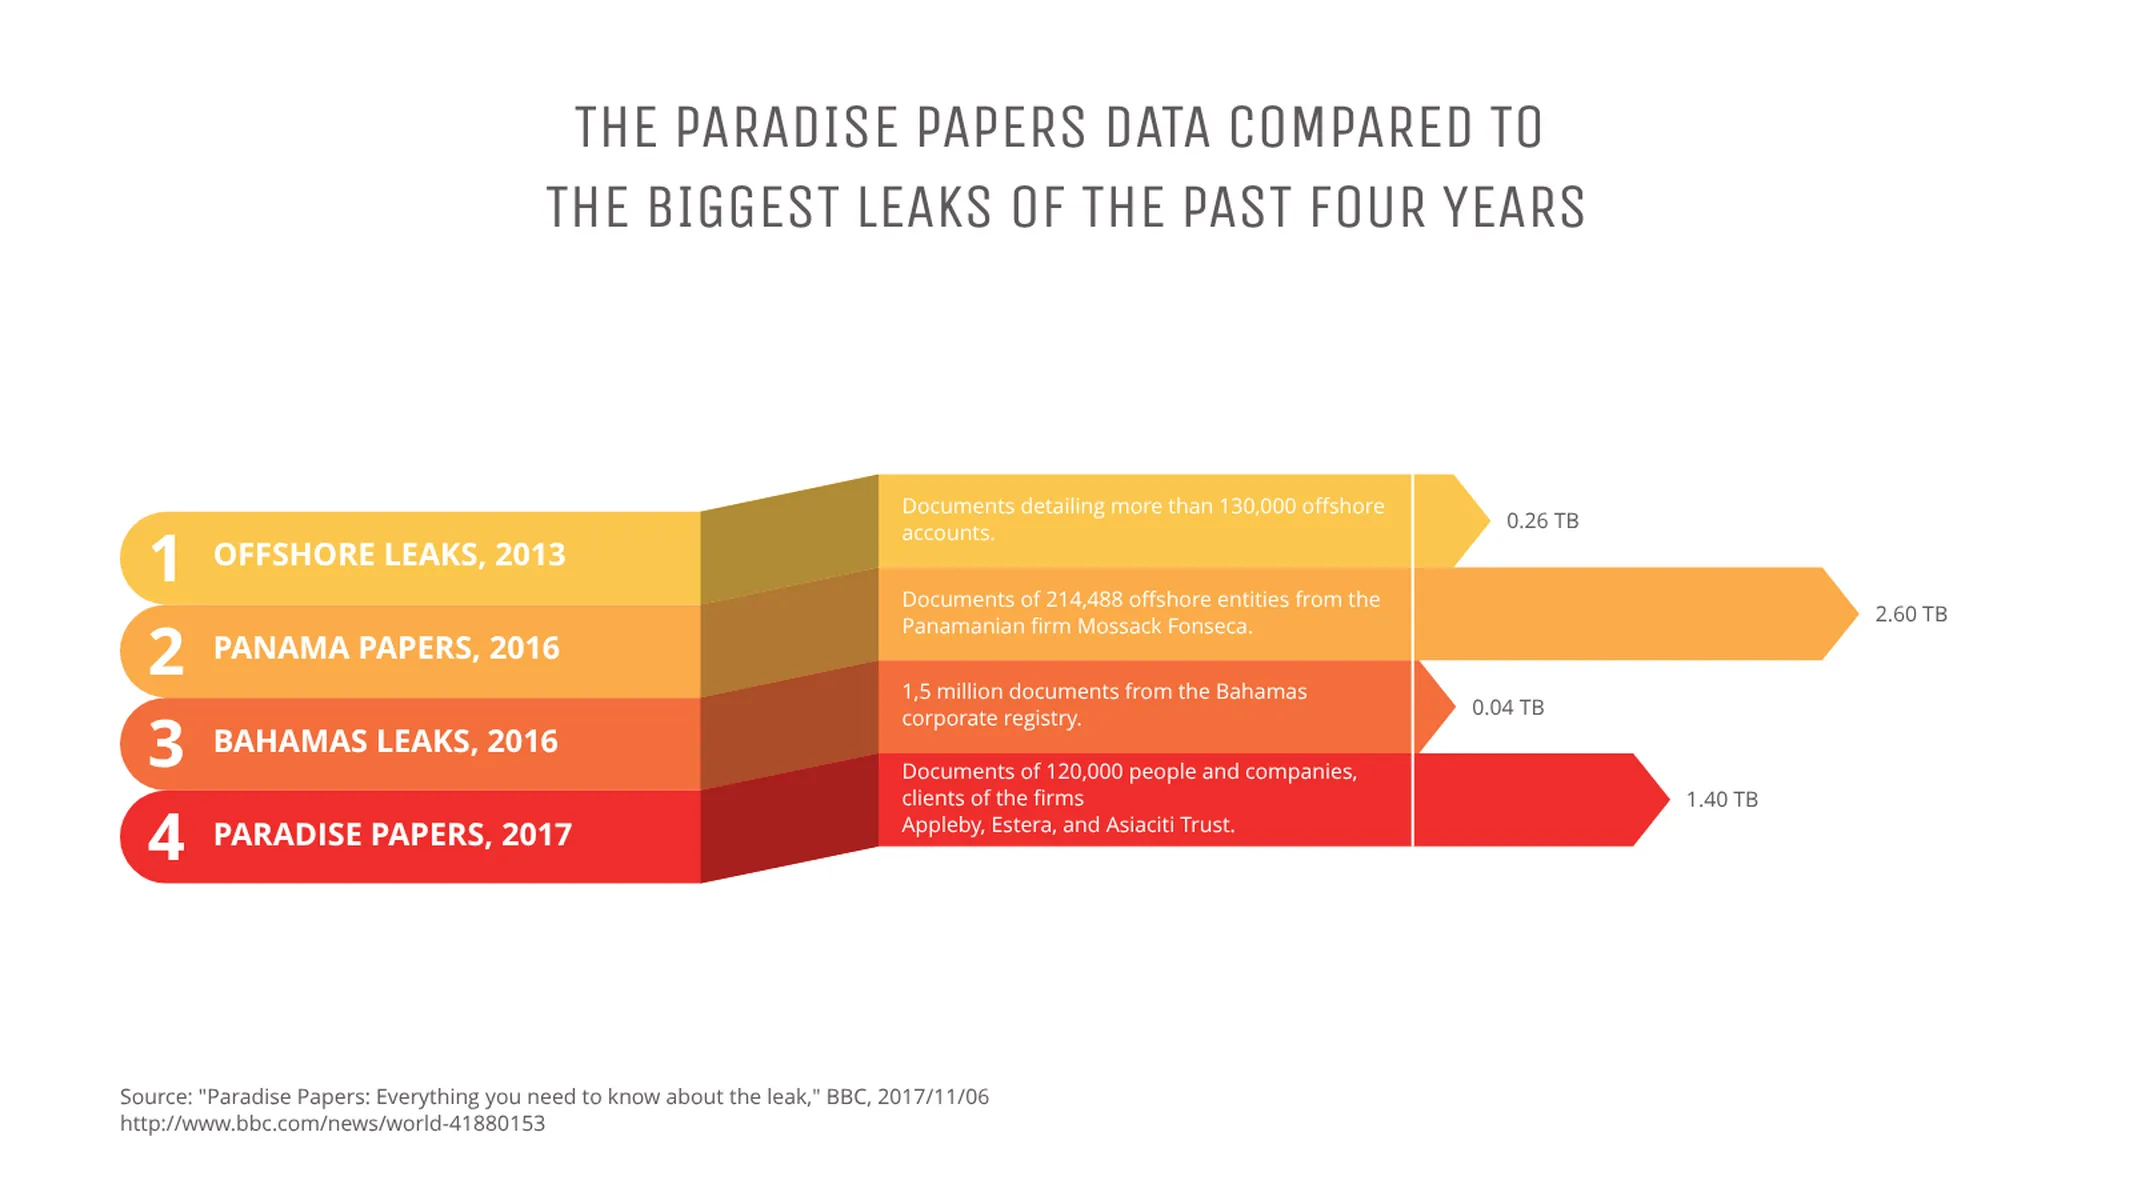

What is a ribbon bar chart?
A ribbon bar chart is, like its name suggests, a bar chart in the form of ribbons that allows plotting and comparing categories while providing a more detailed description, or background information, to the data.
This bar chart is also a great solution to present your project’s milestones plan and its progress. It also works perfectly as a ranking list with values.
Its playful arrangement turns columns into ribbons to convey ideas in a dynamic and beautiful way.
How to make a ribbon bar chart with Vizzlo?
Vizzlo’s ribbon bar chart is highly customizable and very easy to create. Follow these simple steps:
- Click on any element to directly edit it.
- You can also use its respective card in the sidebar as a support to change values and colors; or just copy and paste your data into Vizzlo’s spreadsheet (click the button “EDIT DATA IN SPREADSHEET”).
- Choose or customize a theme exploring the settings of the “APPEARANCE” tab.
Ribbon bar chart maker: key features
- Custom number formats and colors
- Optional enumeration and labeling of individual values
- Optional sorting by value
Ribbon Bar Chart: What's new?
Ribbon Bar Chart Alternatives
Enhance your productivity
Create a Ribbon Bar Chart directly in the tools you love

Create a Ribbon Bar Chart in PowerPoint with
Vizzlo's add-in

Loved by professionals around the world


Visualizations your audience won’t forget
Convey abstract concepts and data with professionally designed
charts and graphics you can easily edit and customize.