Chart Vizzard
Vizzlo's AI-based chart generatorPyramid Chart
A beautiful and highly customizable pyramid diagram with up to ten levels.

What is a pyramid chart?
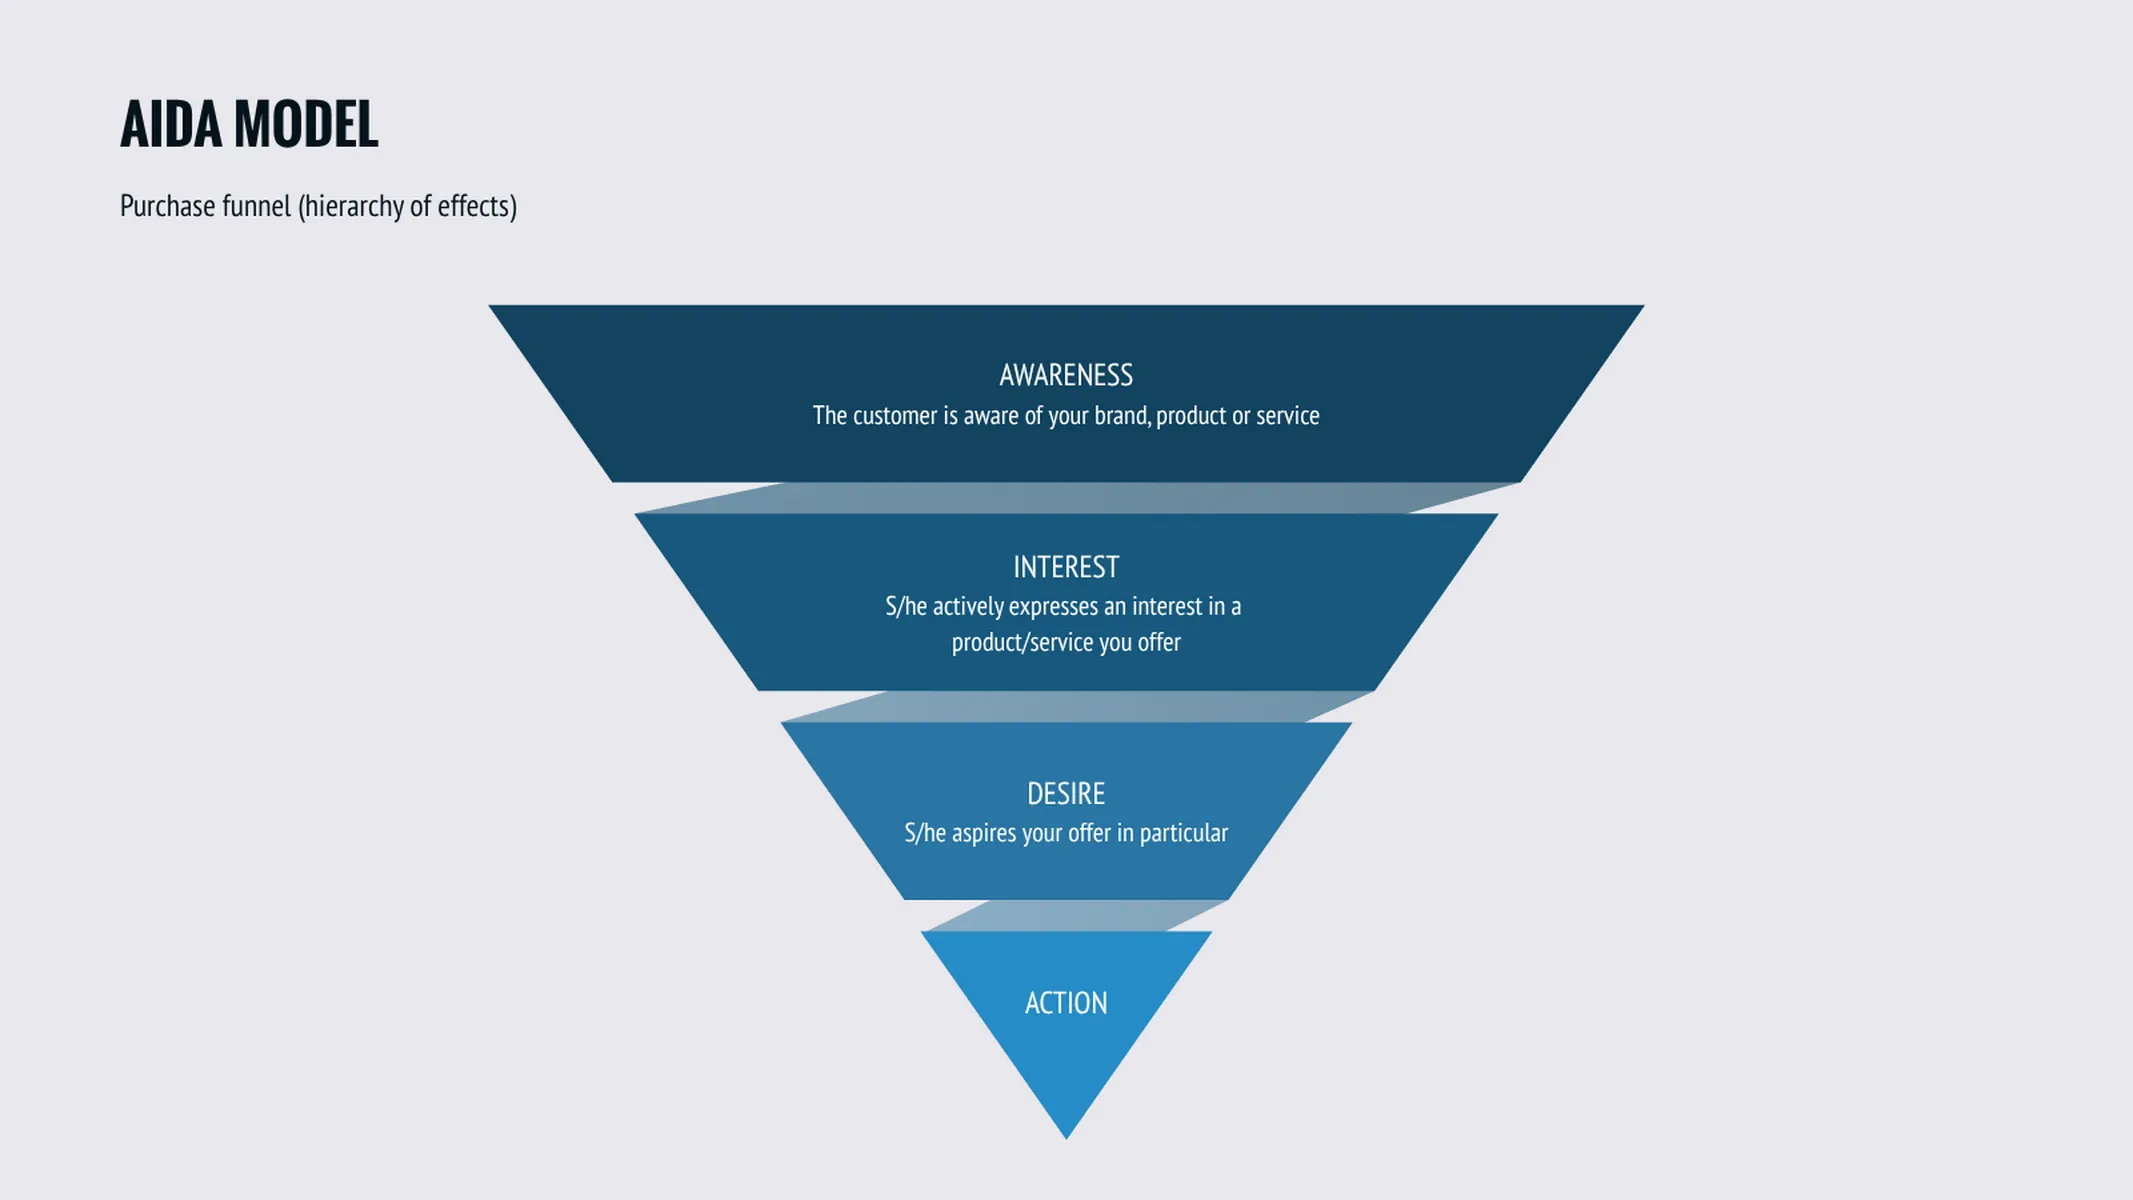
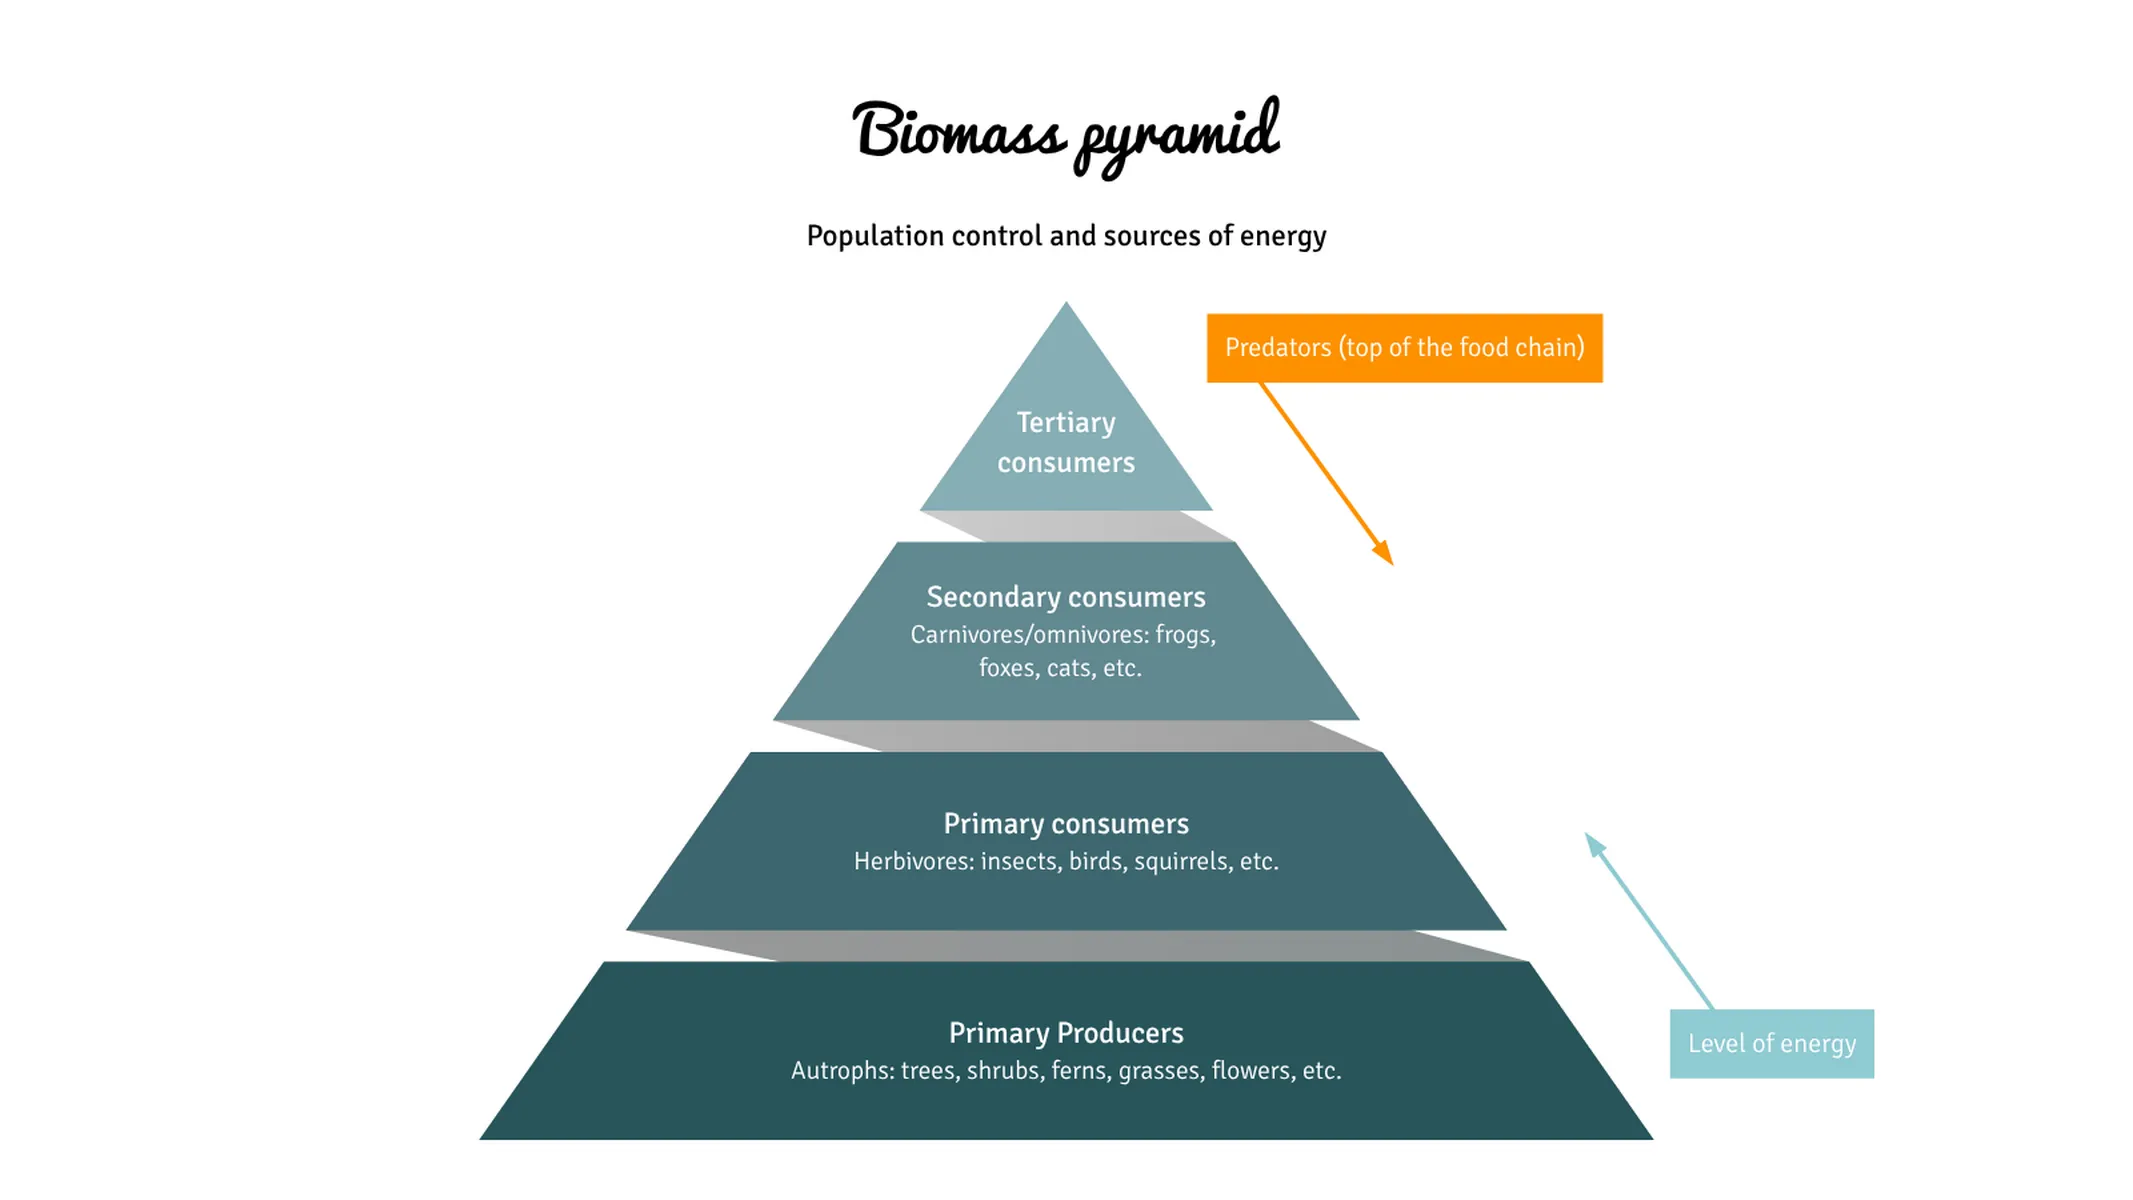
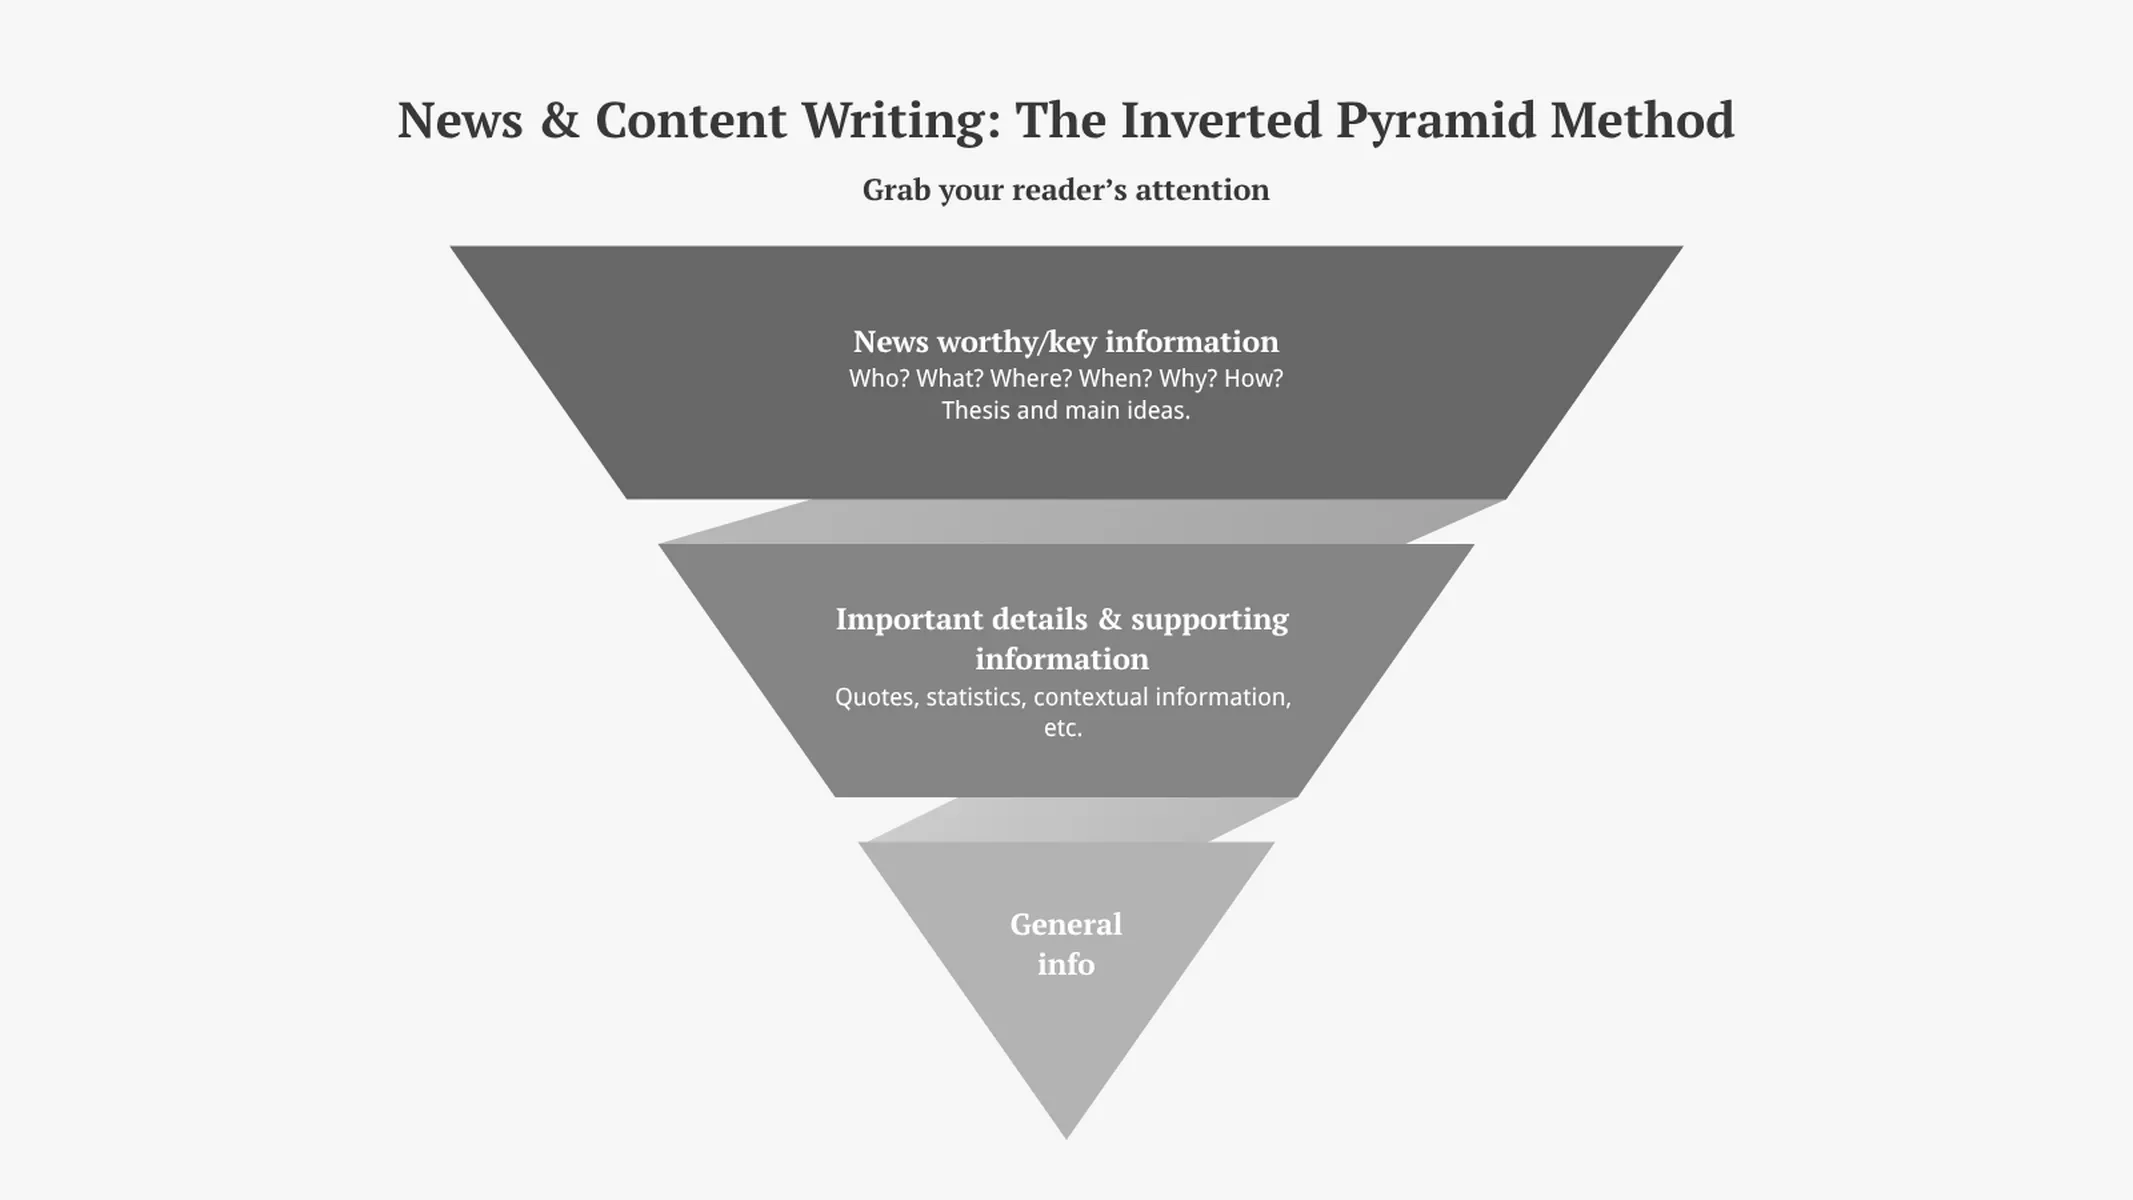
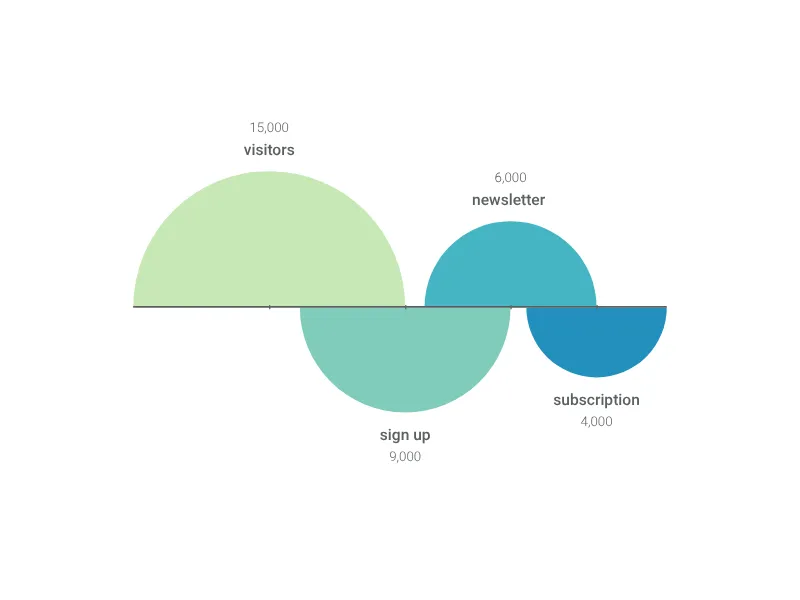
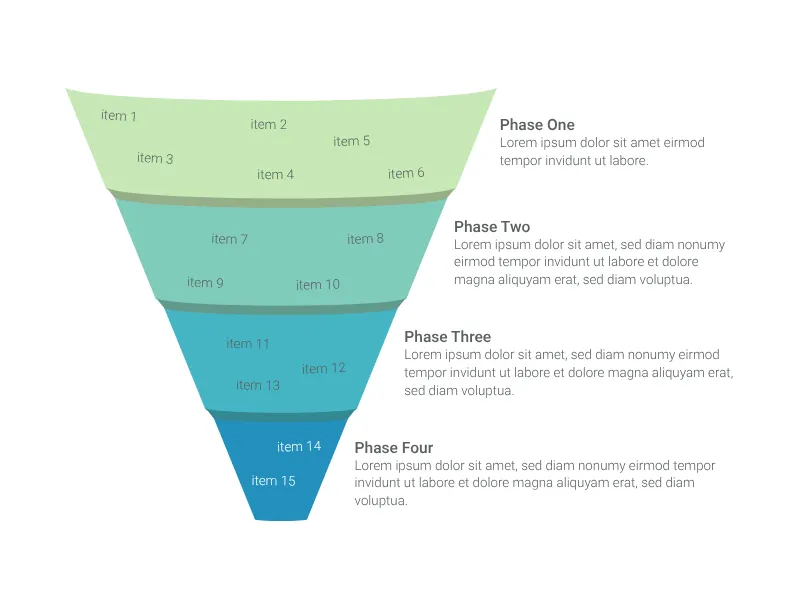
The pyramid chart is a triangle diagram used to represent hierarchies visually. The triangle is divided into sections, illustrating vertically top-down/broad-narrow structures and processes. An inverted pyramid functions as a funnel chart as well.
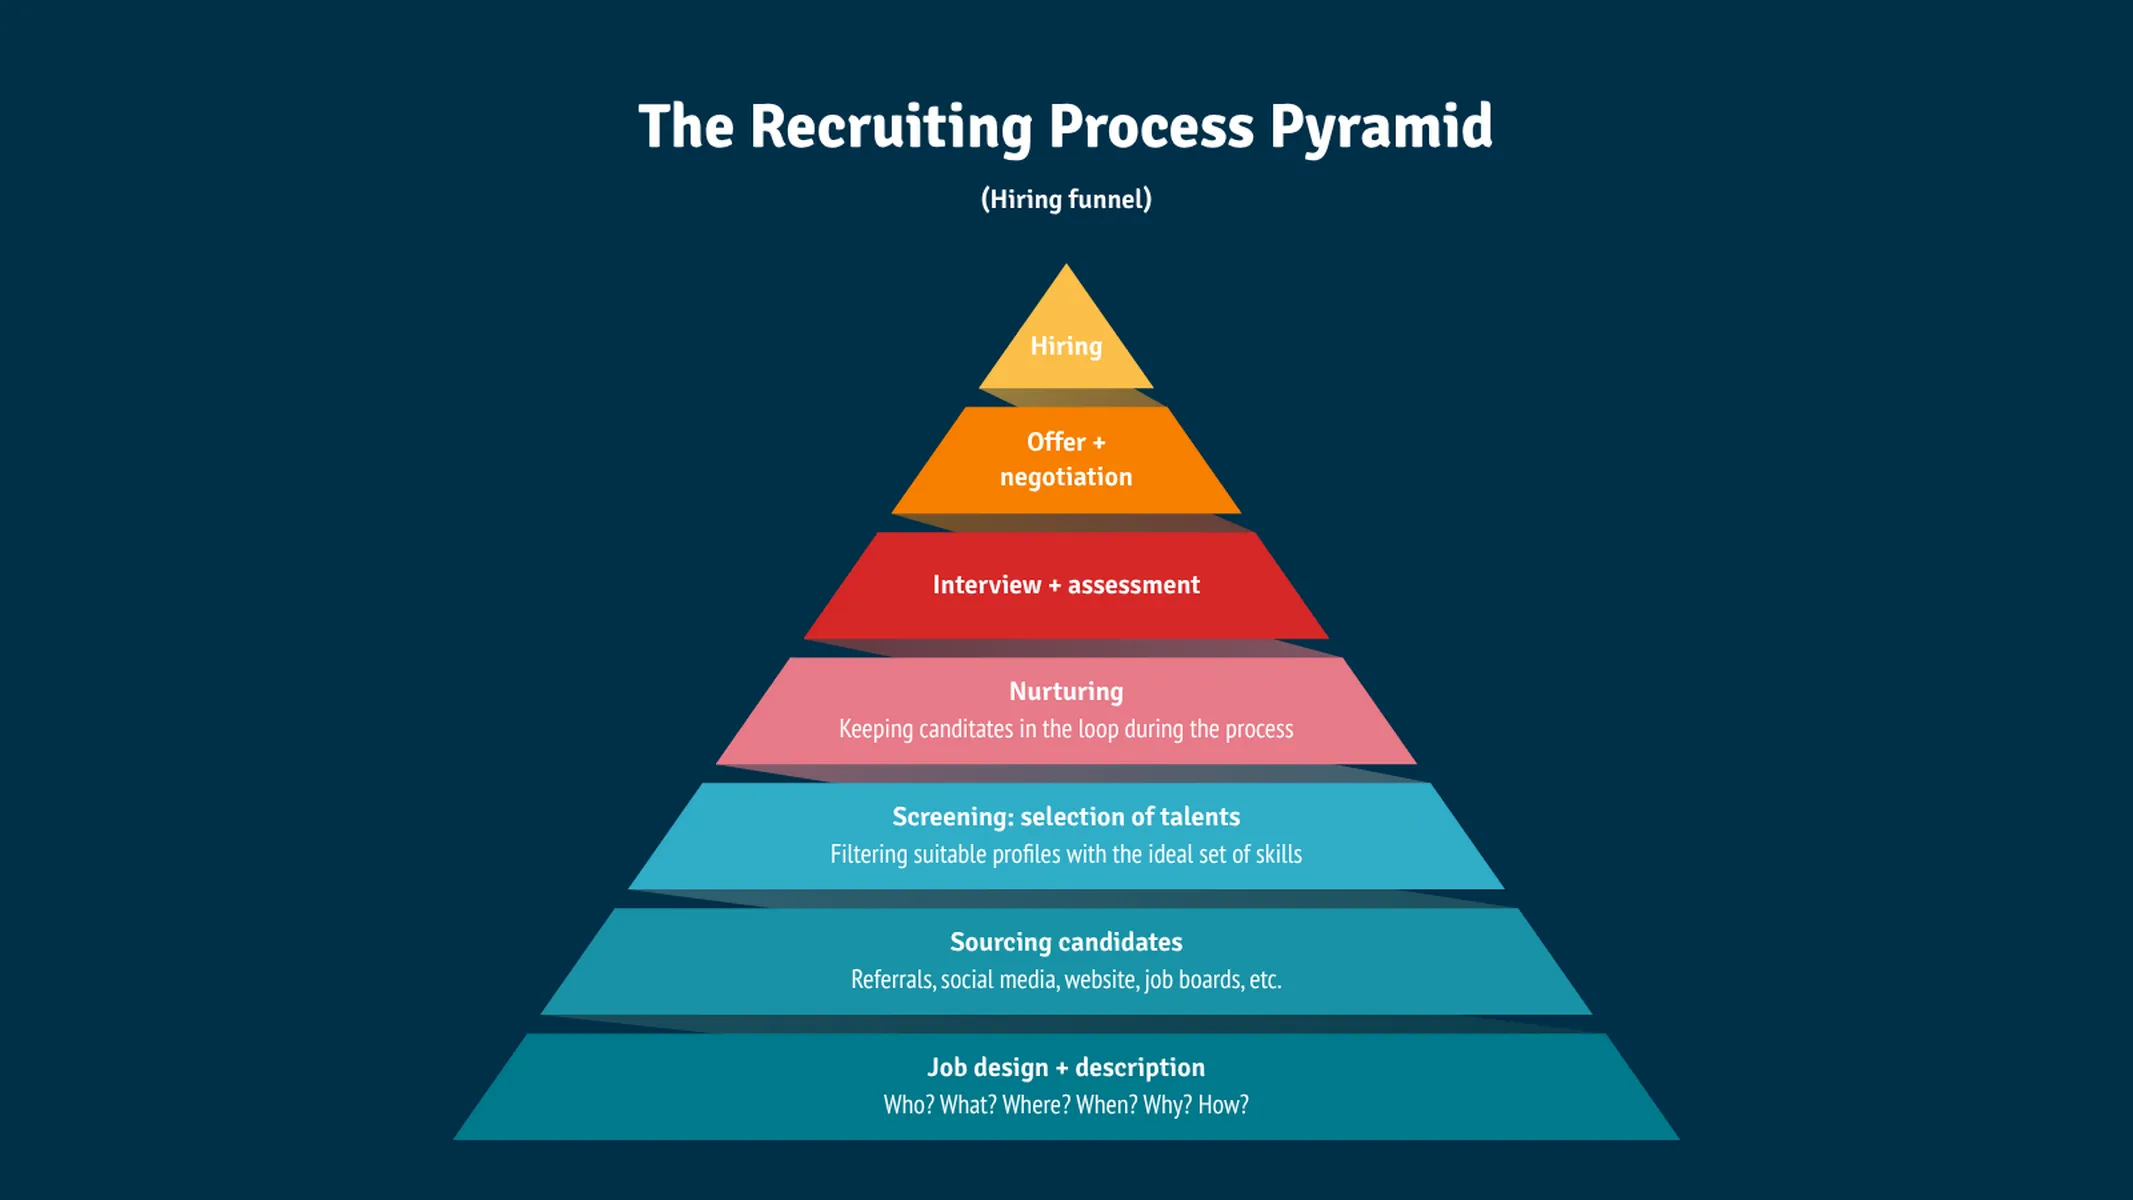
This chart is widely used to visualize any hierarchy: from priorities to social structures (e.g., social classes or management levels in organizational structures); and steps of processes that lead to narrowing down or sharpening input elements (e.g., leads in a sales or marketing funnel or candidates in a recruiting pyramid—in other words, processes that might also involve filtering methods).
How to create a pyramid chart with Vizzlo?
This plugin is the fastest and most beautiful alternative to any ready PowerPoint/slide template. Make your pyramid chart online with ease:
- Click on any element to start editing it.
- Drag and drop the sections to rearrange them as you wish.
- Use Vizzlo’s spreadsheet to import or copy and paste your whole text information (section titles and descriptions) quickly.
- In the tab “APPEARANCE” of the sidebar, explore the Vizzlo themes to choose your preferred font-color combination.
- Alternatively, fully customize your pyramid to match your corporate identity.
Pyramid chart maker: key features
- Custom colors
- Up to ten segments
- Inverted pyramid (funnel chart)
Pyramid Chart: What's new?
Pyramid Chart Alternatives


Enhance your productivity
Create a Pyramid Chart directly in the tools you love

Create a Pyramid Chart in PowerPoint with
Vizzlo's add-in

Loved by professionals around the world


Visualizations your audience won’t forget
Convey abstract concepts and data with professionally designed
charts and graphics you can easily edit and customize.