Chart Vizzard
Vizzlo's AI-based chart generatorRoadmap
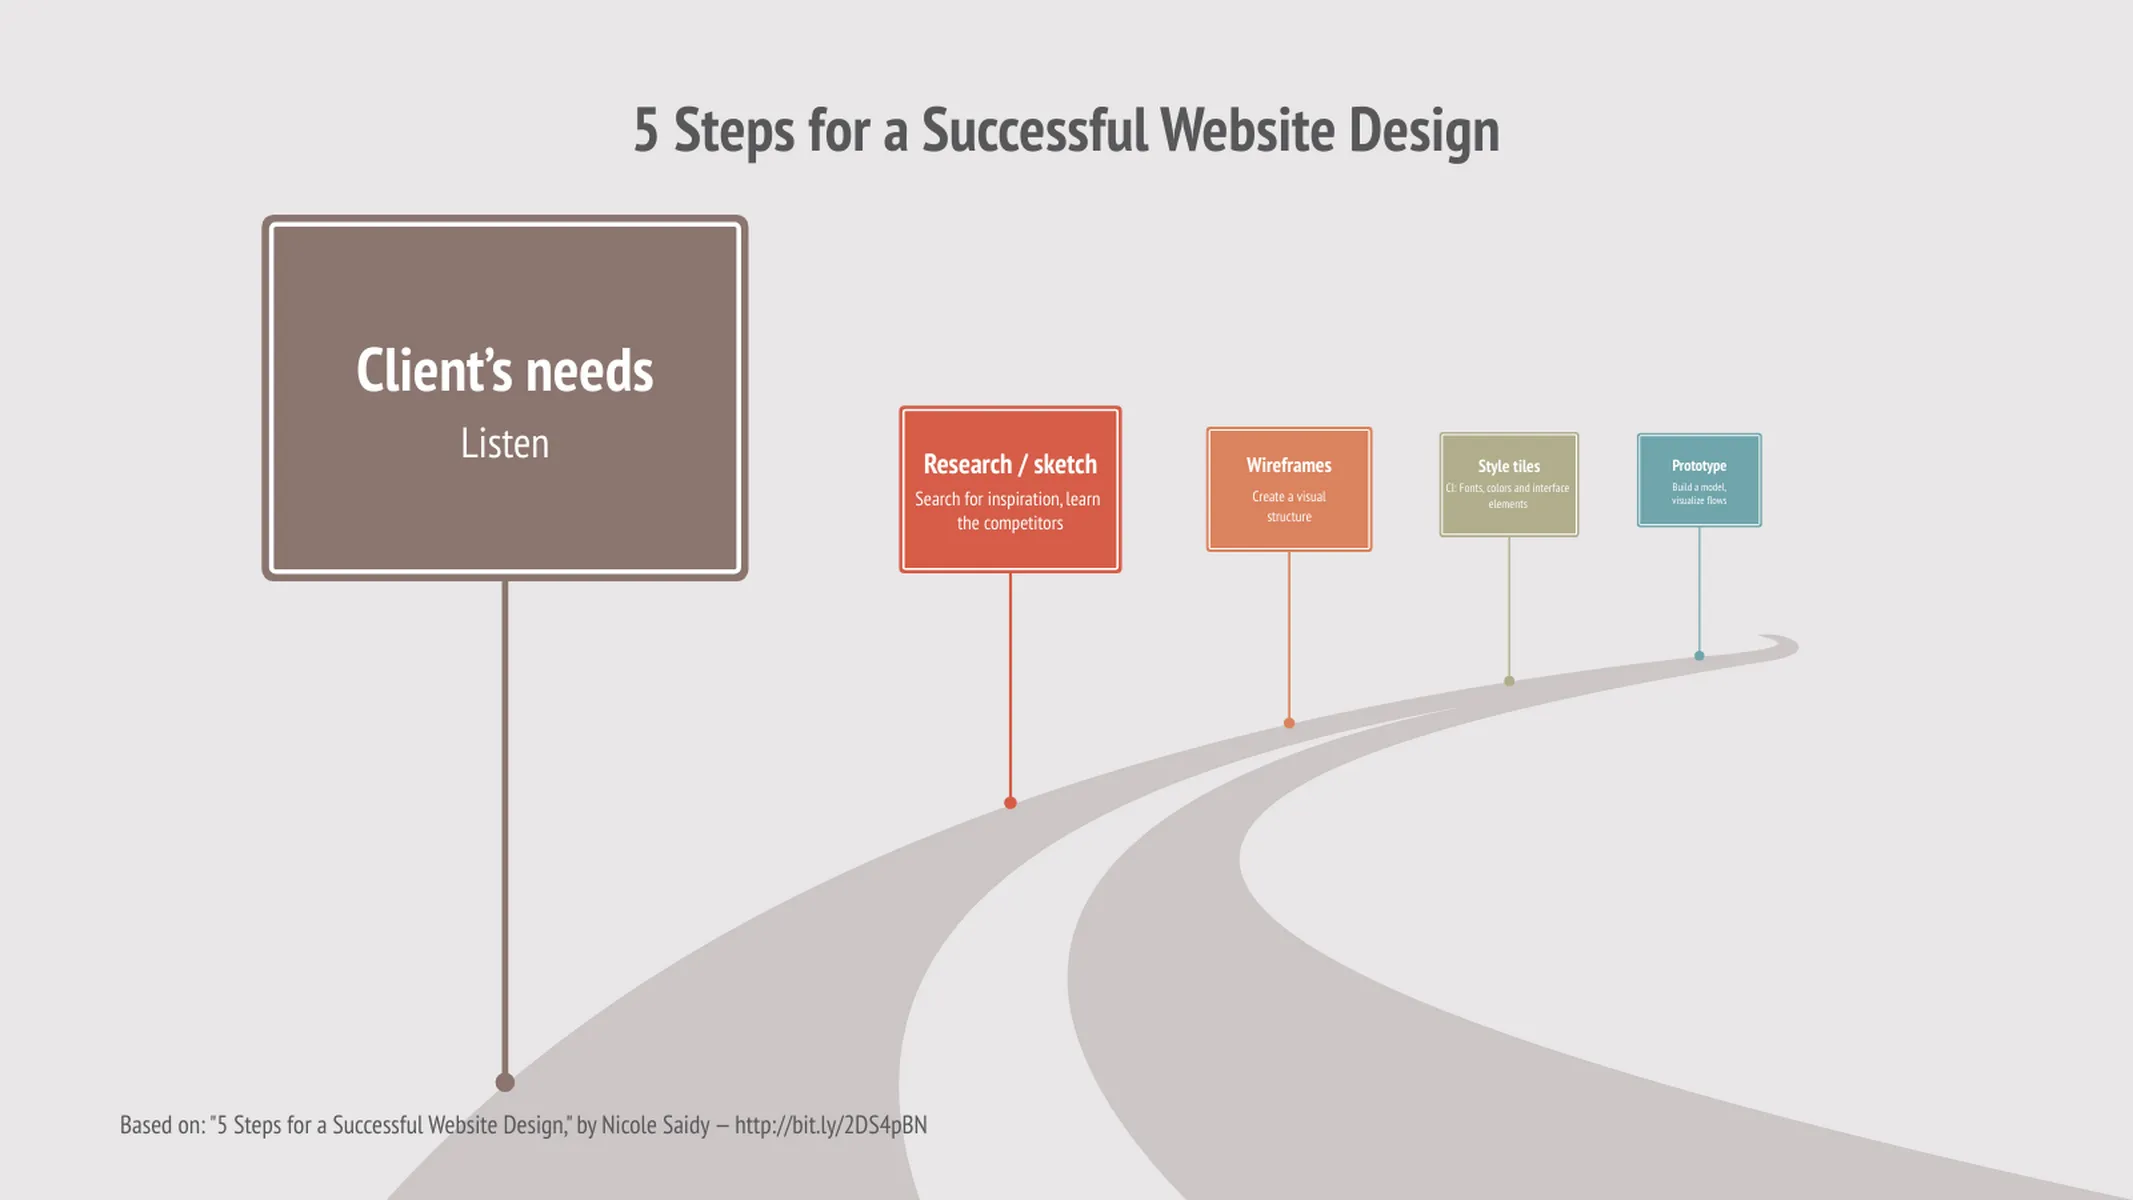
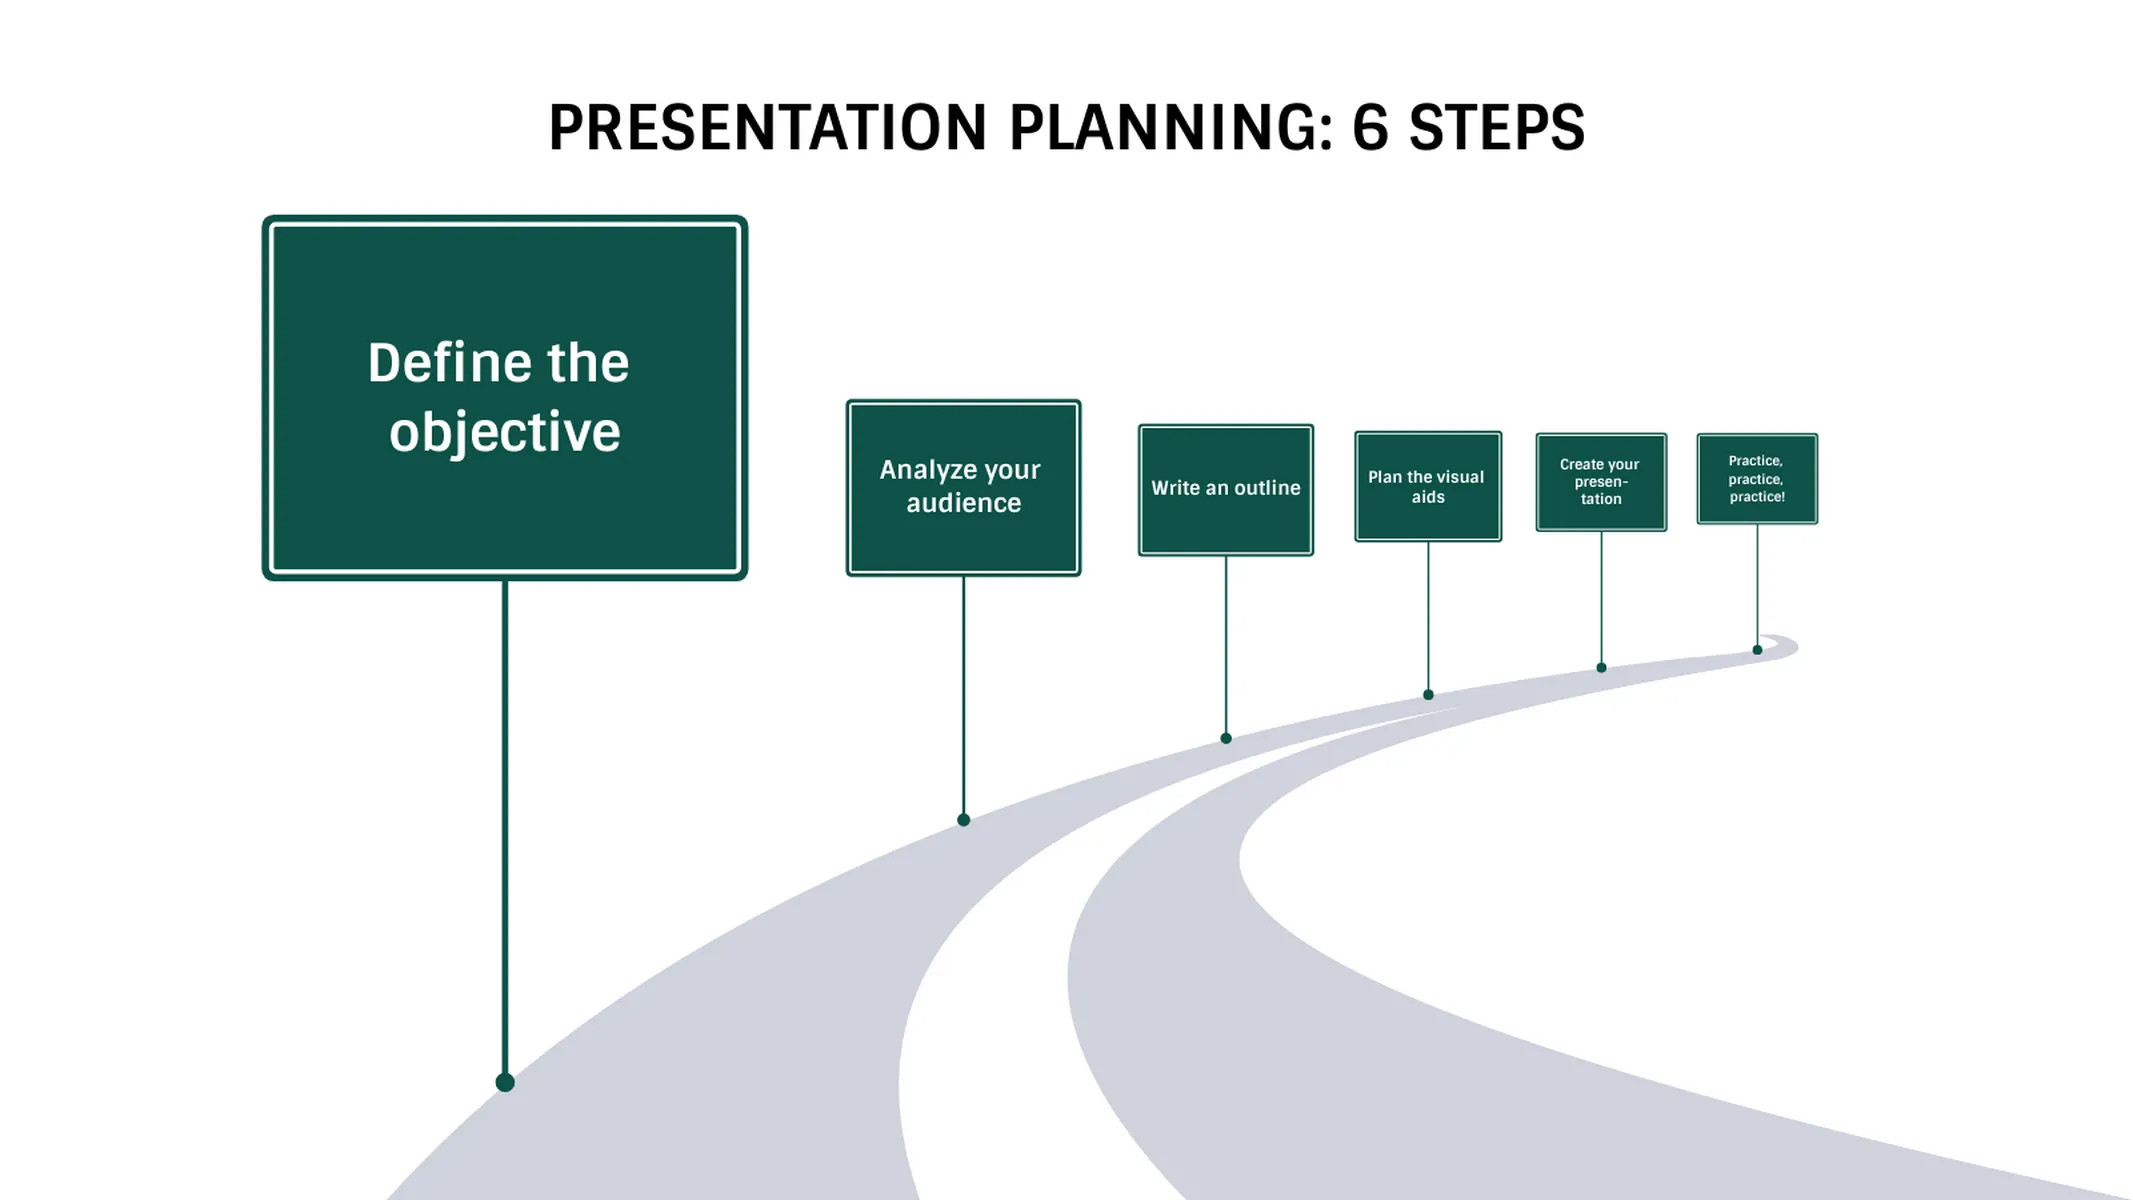
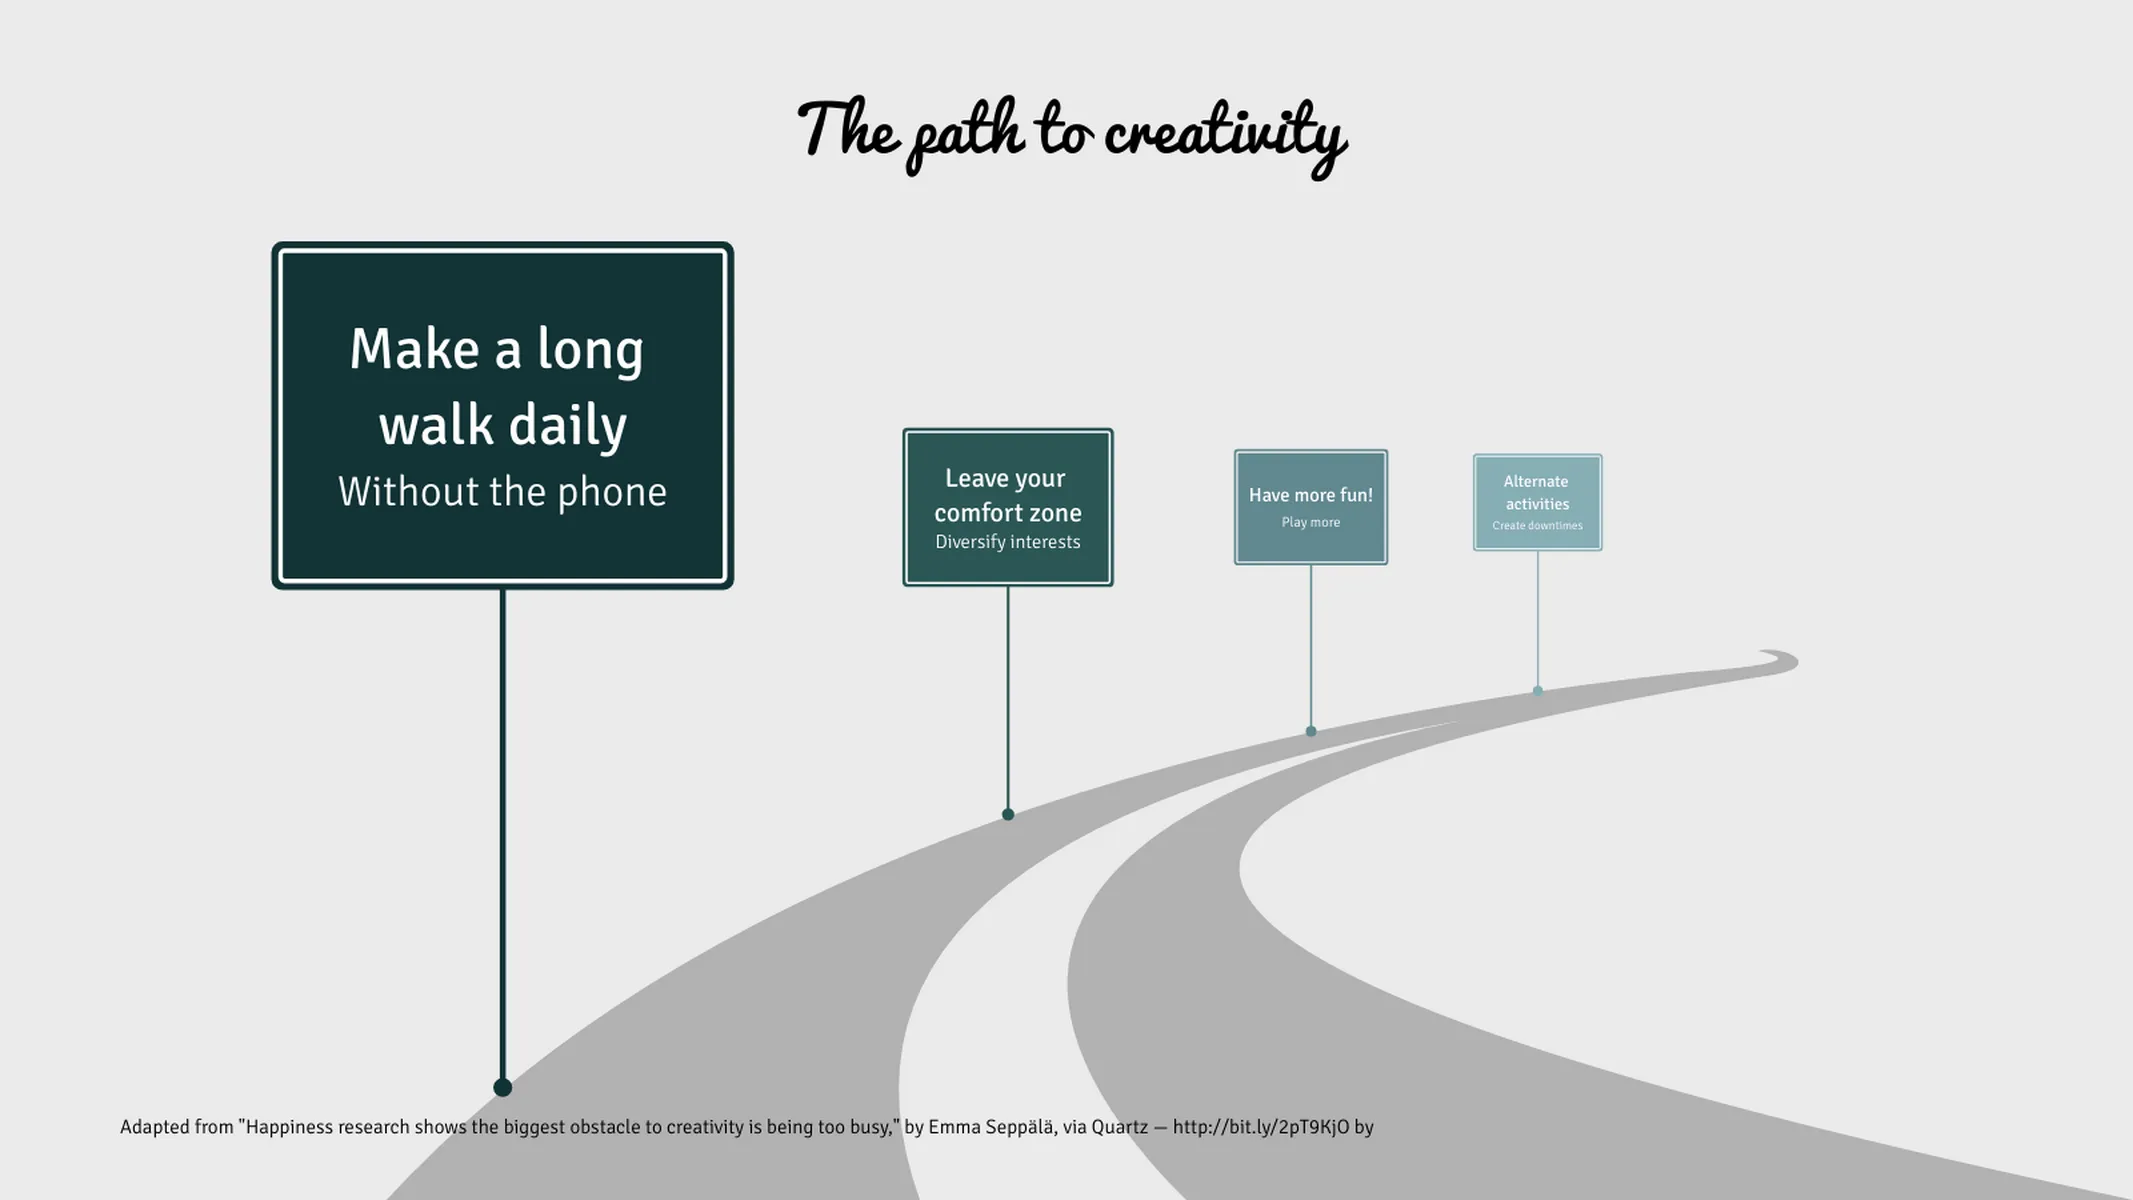
Where's your product heading? Visualize your next steps using an actual roadmap.
What is a roadmap?
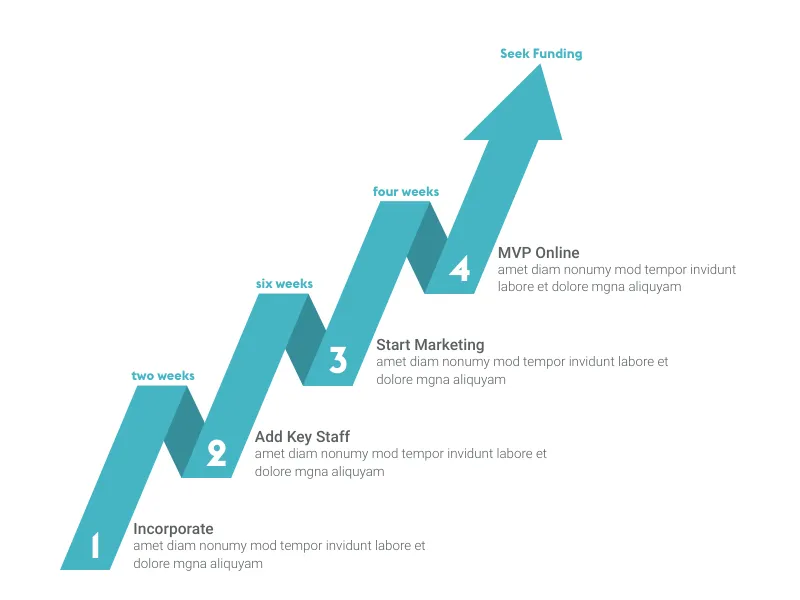
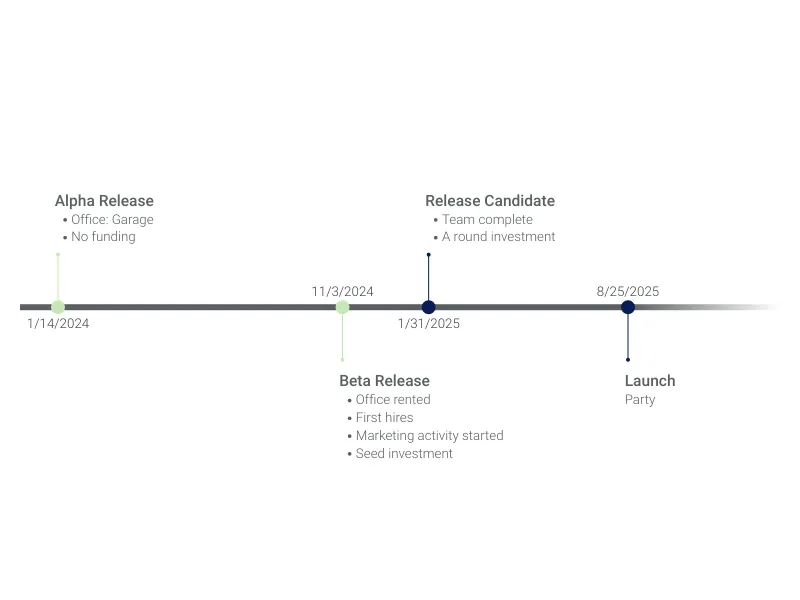
A roadmap is a visual representation of your project plan. It is the perfect tool to plan and provide an overview of your project timeline and its major milestones, in the order that best showcases your strategy.
This chart is ideal for project managers or anybody looking to communicate and monitor the development of plans, and processes. It is also an easy way to share your strategic vision.
What are you waiting for? Let’s get this show on the road!
How to create a roadmap with Vizzlo?
Create your project roadmap in seconds! Just follow these easy steps:
- Click on any sign to start editing. You can also enter your data and define colors by using the active cards in the sidebar.
- Move your milestones along the road to adjust appearance.
- To create a new milestone you can either click on the “plus” button on the road, on one of the “plus” buttons on the side of the milestones you already have or, else, click on “Add milestone” on the sidebar.
Roadmap maker: key features
- Custom colors and fonts
Roadmap: What's new?
Enhance your productivity
Create a Roadmap directly in the tools you love

Create a Roadmap in PowerPoint with
Vizzlo's add-in
Loved by professionals around the world


Visualizations your audience won’t forget
Convey abstract concepts and data with professionally designed
charts and graphics you can easily edit and customize.
