Chart Vizzard
Vizzlo's AI-based chart generatorSimple Gantt
Make impressive and beautiful project management timelines easily with just a few clicks.
What is a simple Gantt chart?
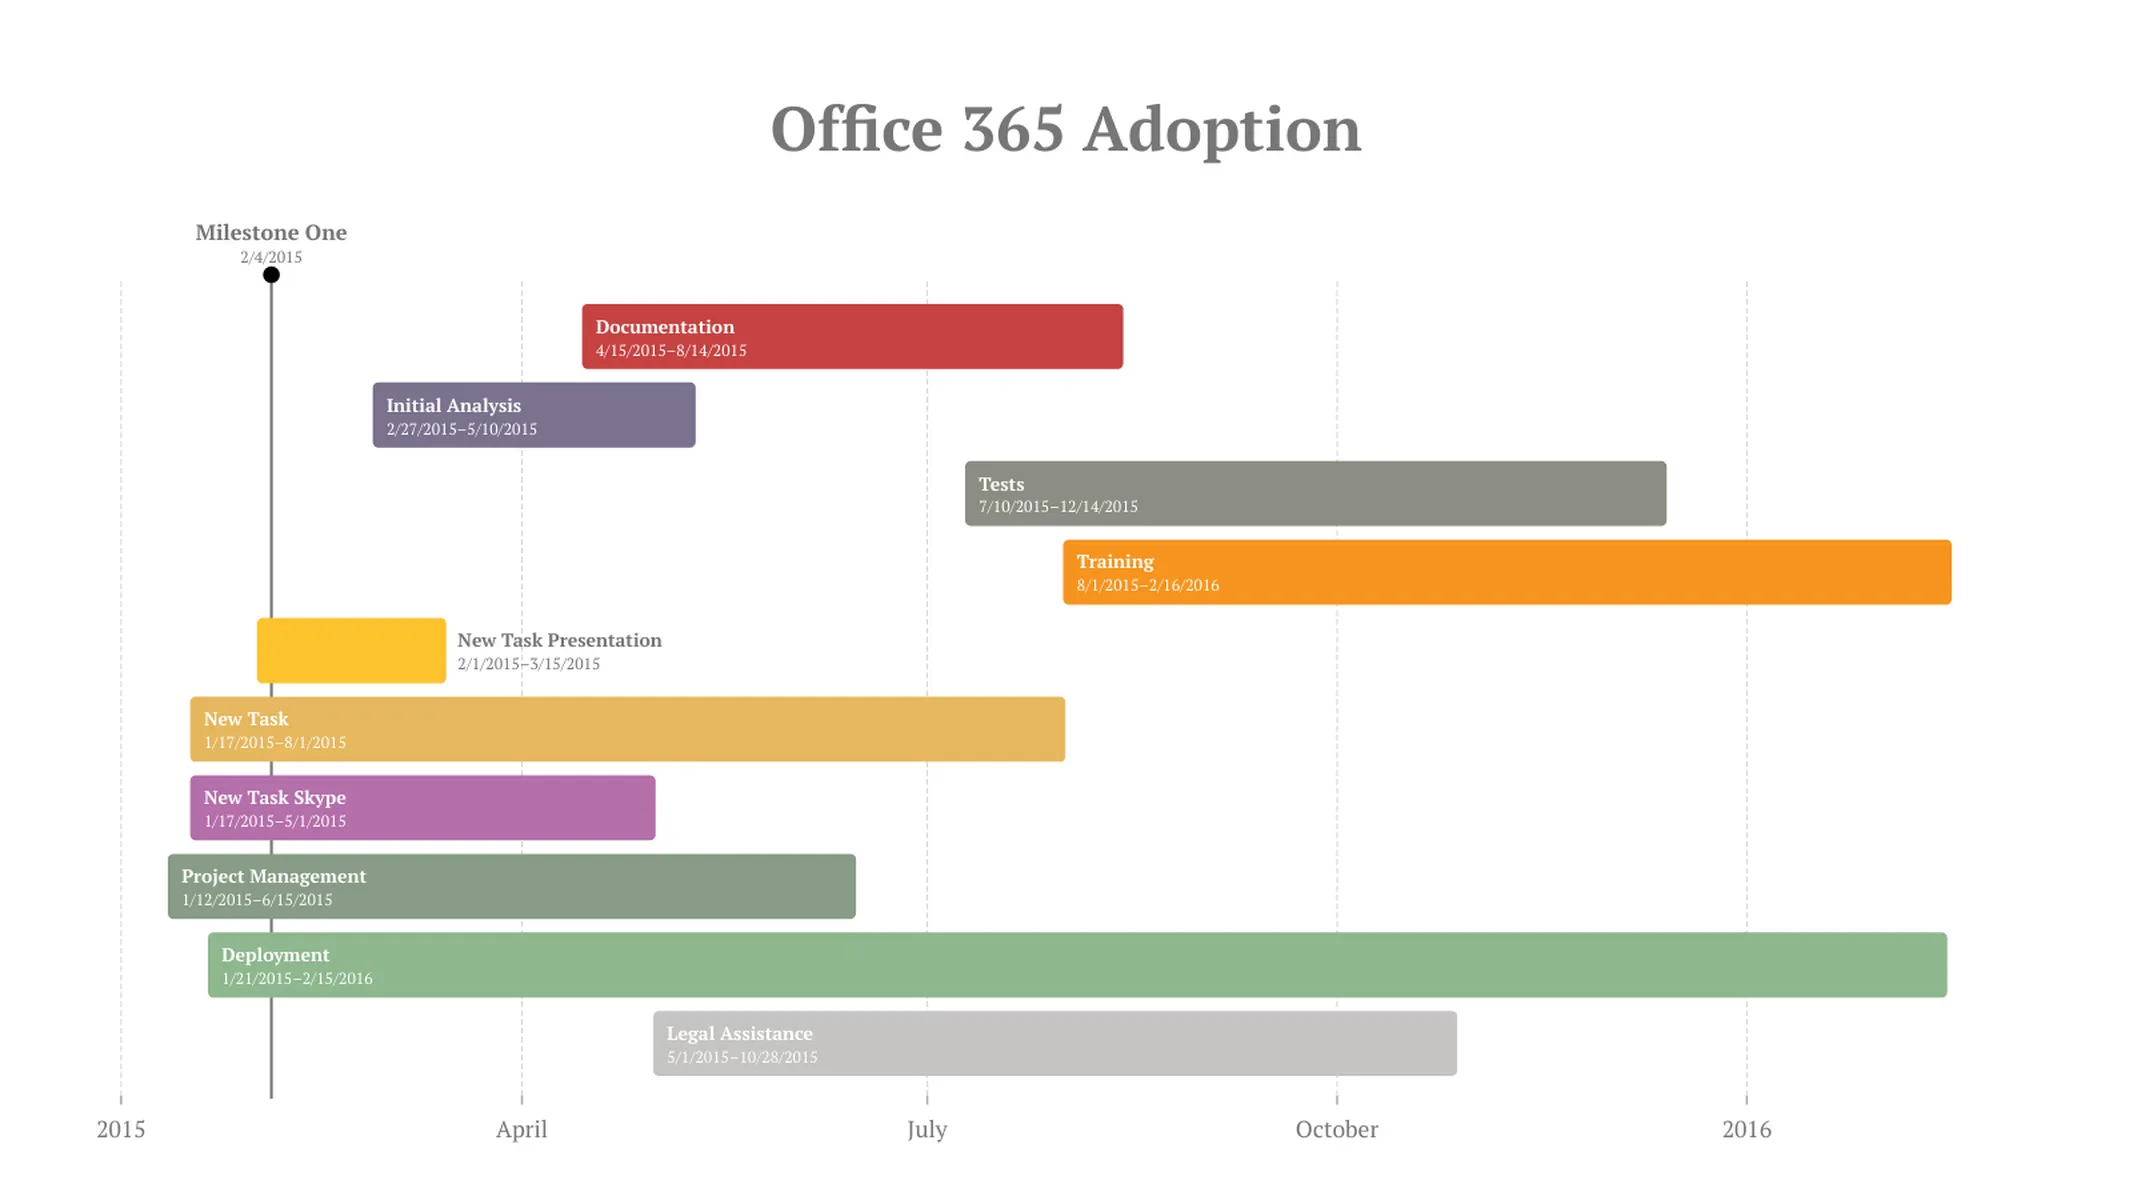
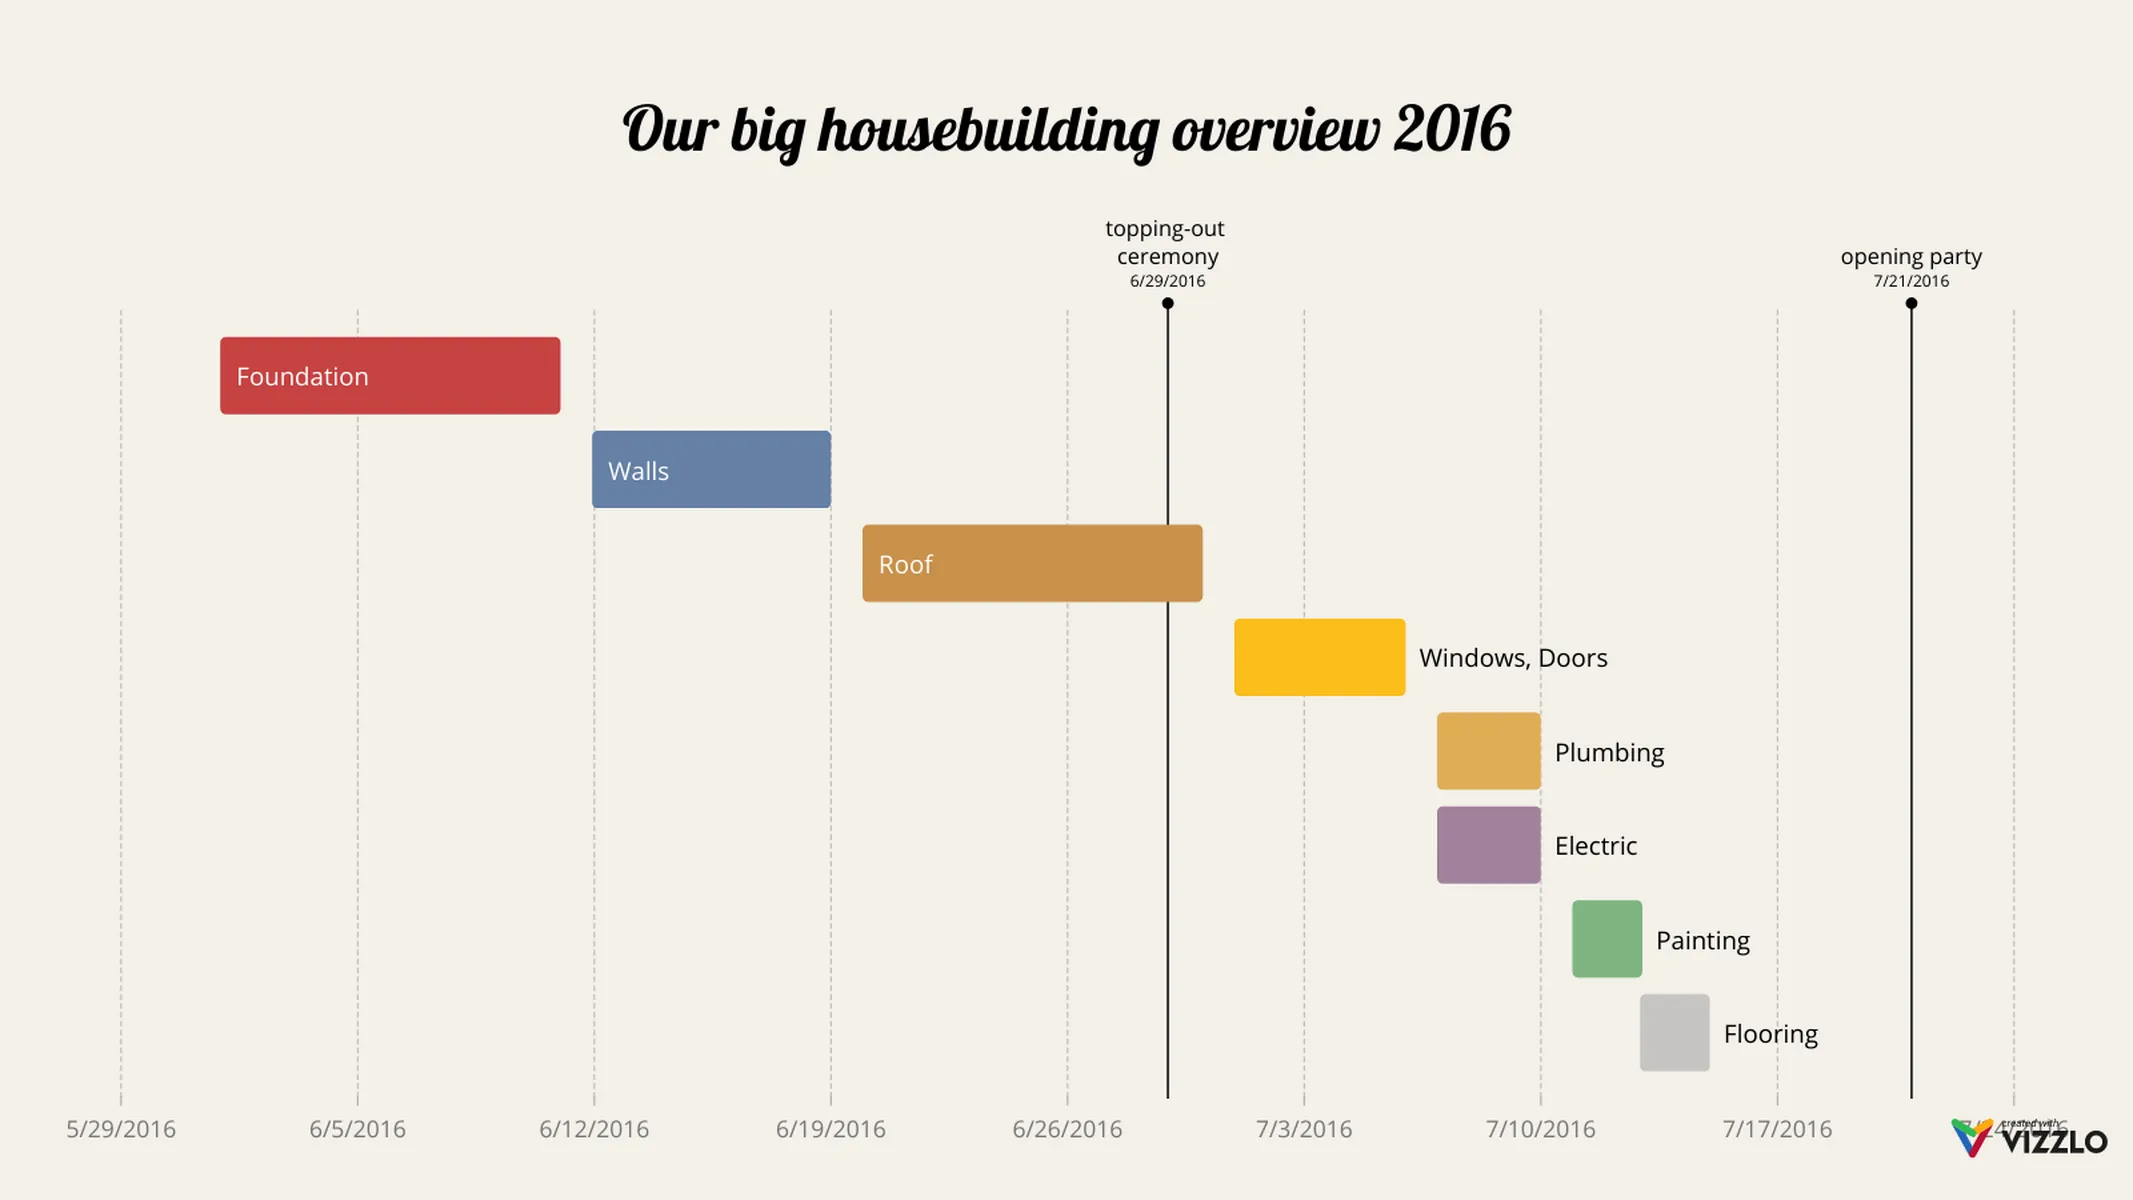
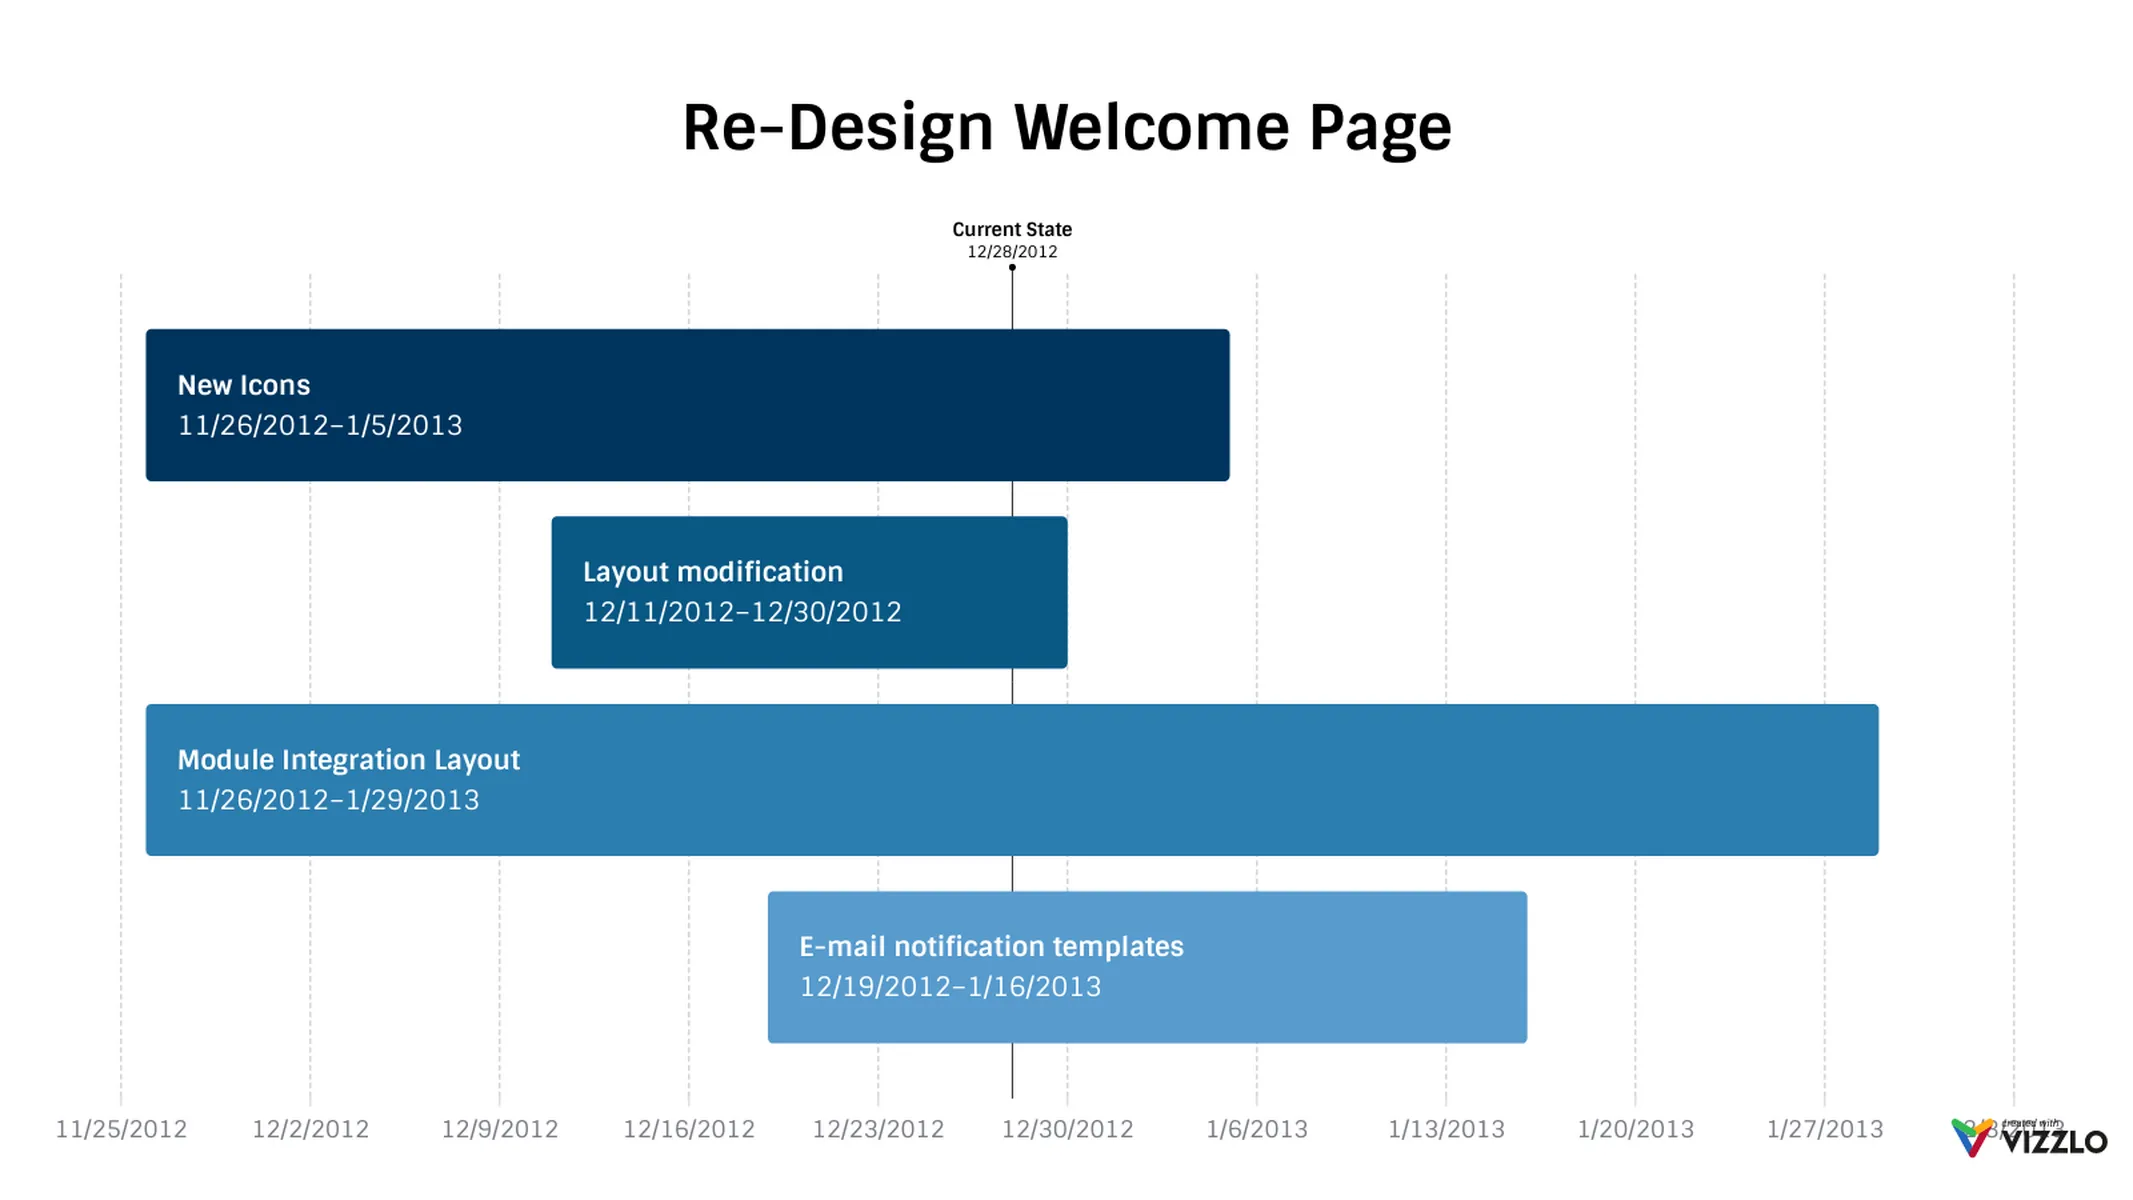
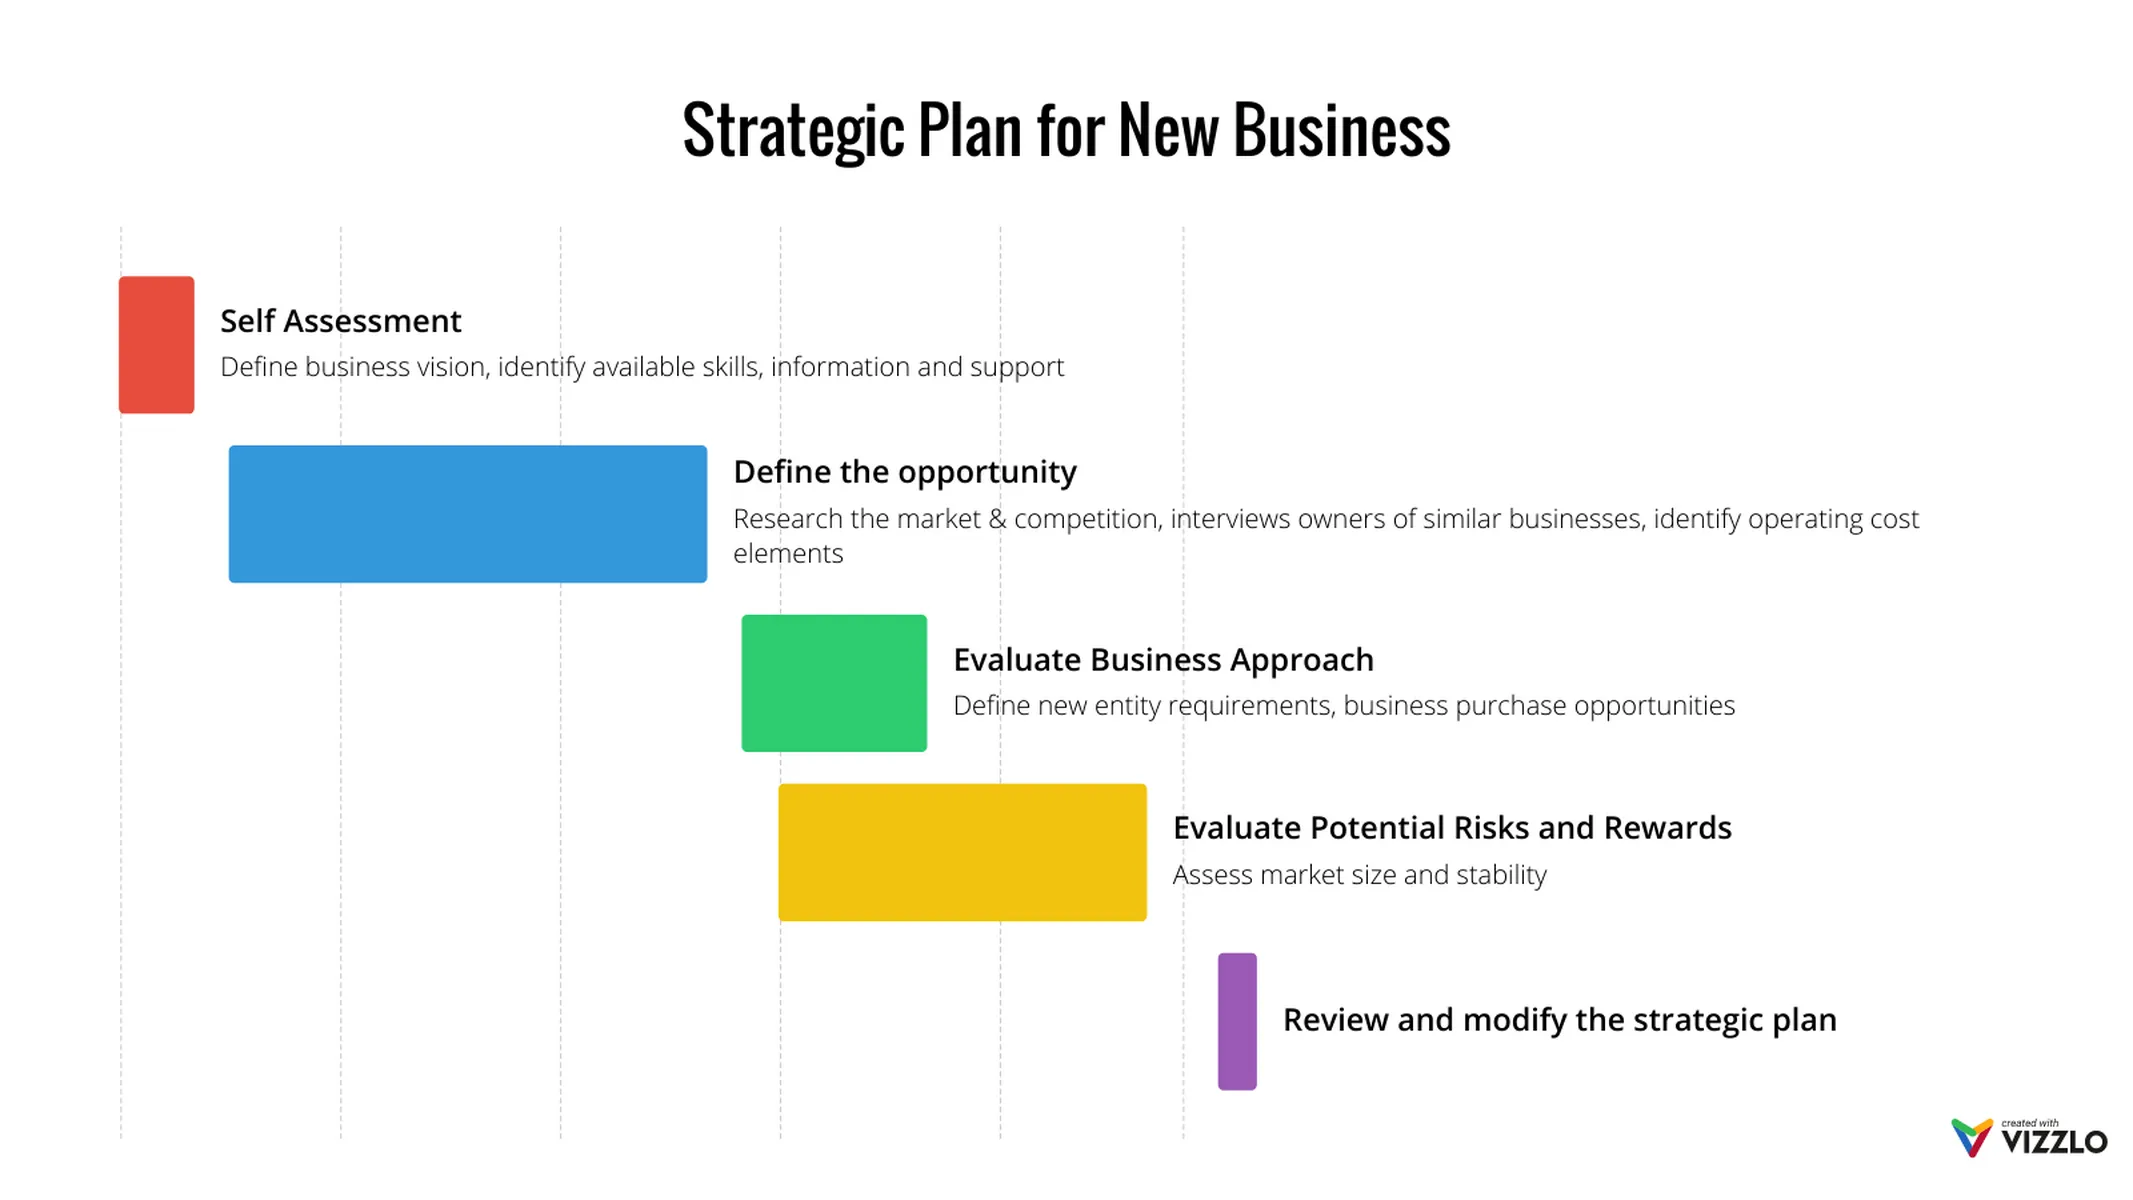
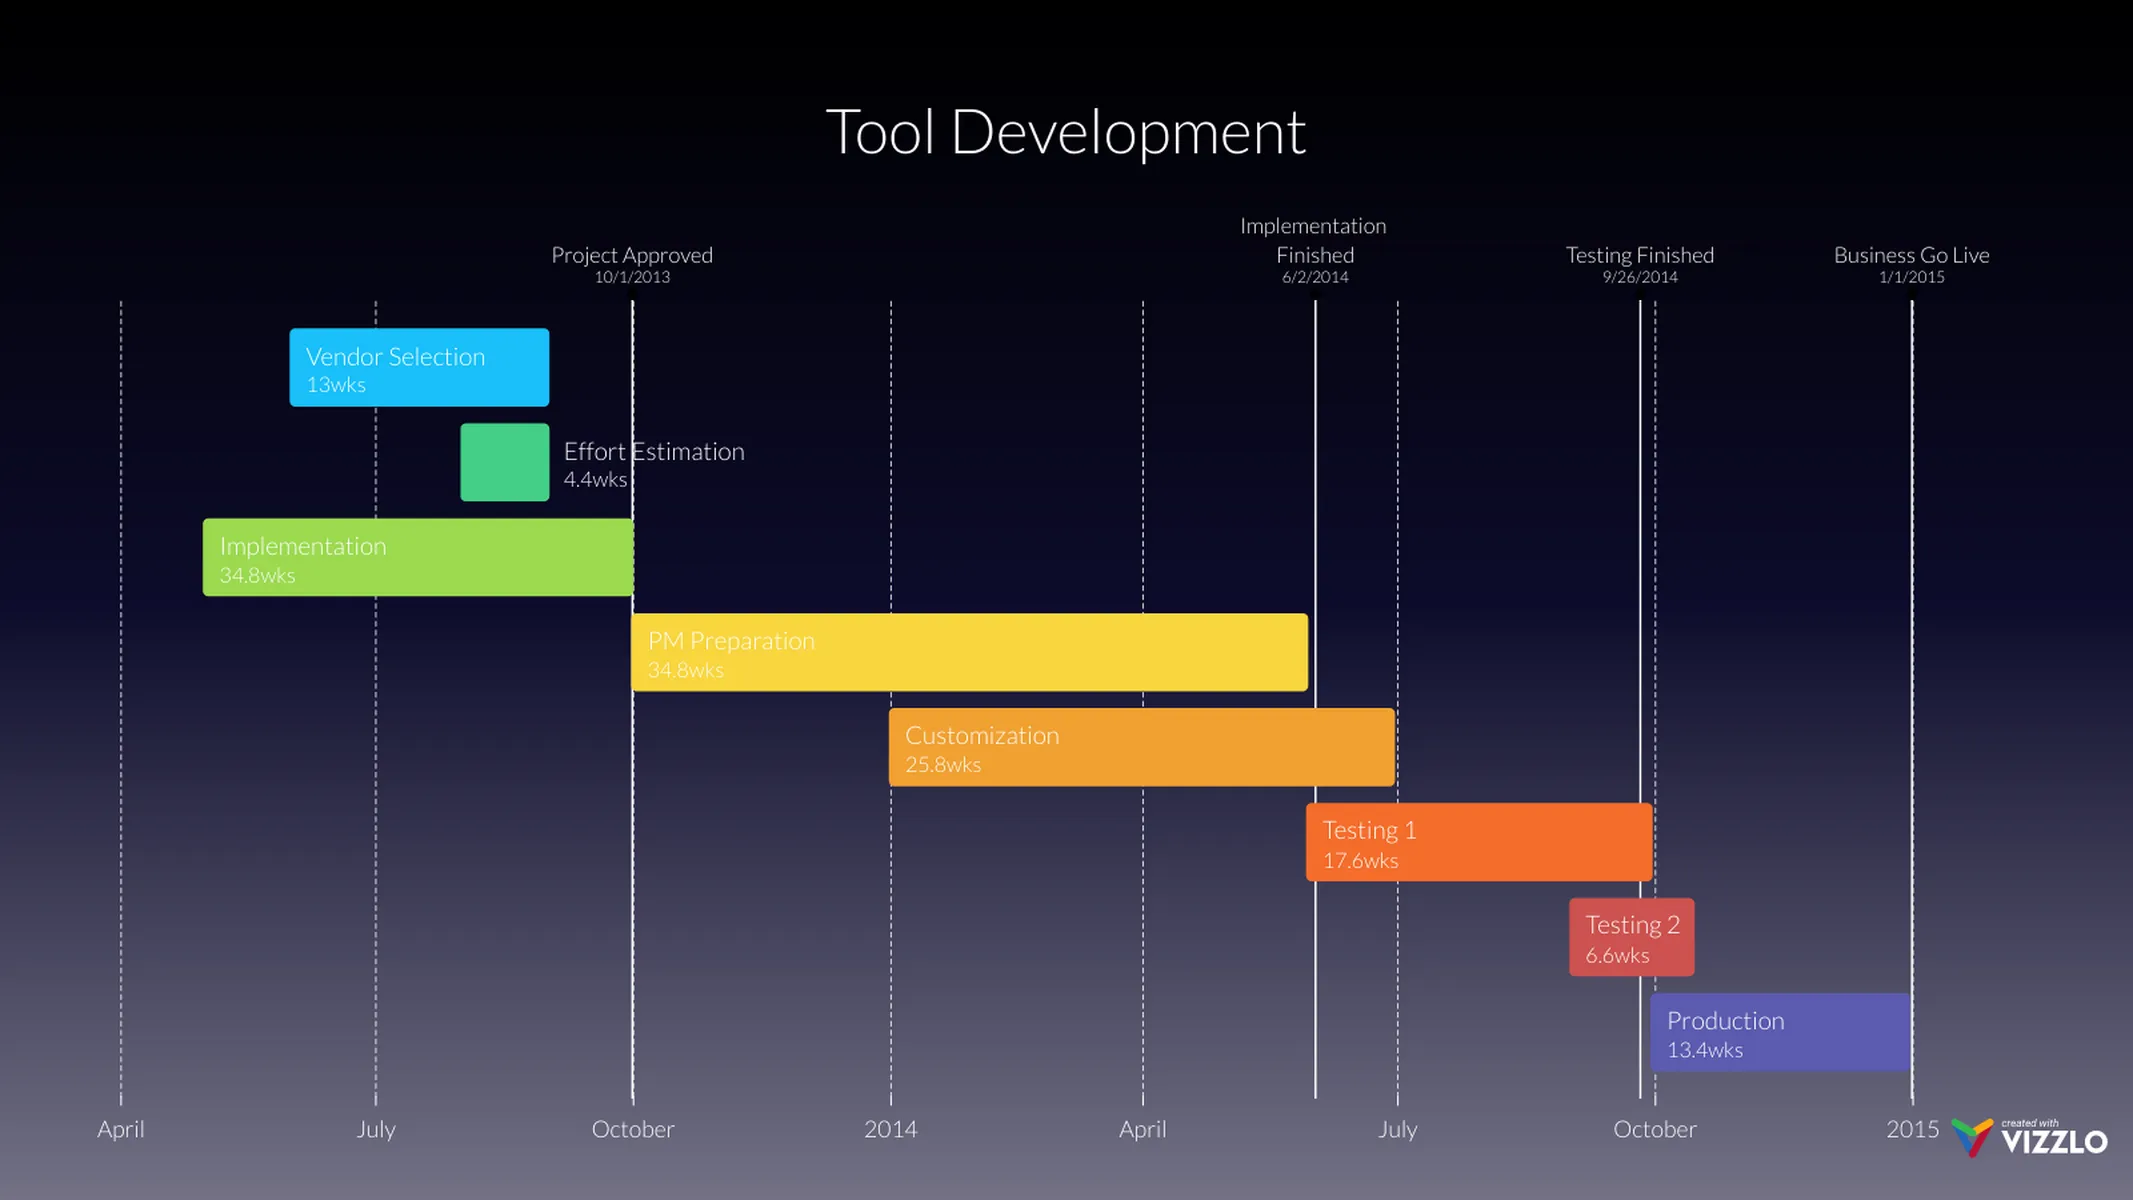
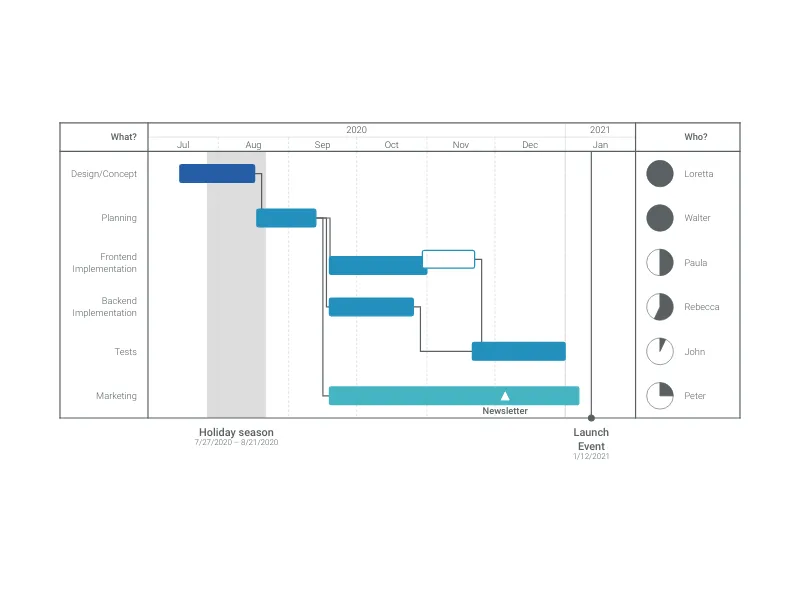
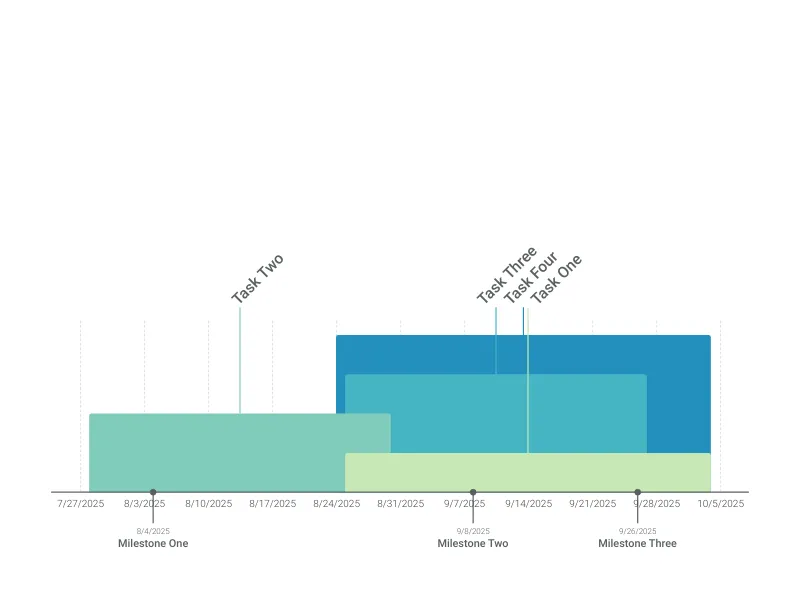
When it comes to managing projects, you need tools to make them manageable. That includes charts to help you and your team collaborate efficiently. A Gantt chart is a breakdown of a complex project into pieces. It lets you communicate your project timeline visually in an easy-to-understand way. You get a list of all the required steps that need to be taken before the project is completed, without losing the big picture. The Simple Gantt is an easy-to-use project timeline template. The bottom of the chart shows the time period of your project. Each bar represents a task. The length of a bar marks the duration planned for each task, its start and end dates. Additionally, milestones can be placed on top of your timeline.
How to make a simple Gantt chart with Vizzlo?
Vizzlo’s Simple Gantt chart was designed to assist project managers and all other professionals to produce elegant Gantt charts easily. Visualize your activities in minutes, not hours. Create presentations that stand out and impress your audience!
- The chart is completely interactive. Click on any element to select and edit it.
- Import your data as Microsoft Excel file or as CSV file.
- To update dates, simply drag and drop the bar on the timeline. All related elements are updated automatically.
- Drag and drop bars and milestones to reposition them.
Simple Gantt chart maker: key features
- Quickly create beautiful project management timelines that showcase your workflow to clients and managers.
- Add milestones to highlight important points in time.
- A smart algorithm sets the axis range and axis ticks for you automatically.
- Reposition bars vertically by drag and drop simplicity.
- Use your mouse to adjust the start and end date of a bar.
- Shift all dates by one click into the future or into the past.
- Change the colors of the bars individually.
- Choose to display a title, description, and duration for each bar.
- High-quality export as PDF or PNG.
- Embed the chart in your website.
- Vizzlo detects over 20 date formats automatically. No need for you to worry about the correct data import.
Simple Gantt: What's new?
Segments can now only be resized after initial selection.
You can now set up as many activities as you want.
Now it’s possible to adjust the start and the end of your activities by simply dragging the handlers on each side
Milestones are now connected with a line when they get moved away from their position; also the performance of the chart has improved a lot
You can drag and drop activities vertically now
Milestones can have their own date format independent of axis settings and activity settings.
We also improved the grid line positions and respective date labeling of the horizontal axis. You don’t need to worry about it and we take care of a good format here.
Fixed. The placement of date & description in some edge cases now works as expected.
Simple Gantt Alternatives
Enhance your productivity
Create a Simple Gantt directly in the tools you love

Create a Simple Gantt in PowerPoint with
Vizzlo's add-in
Loved by professionals around the world


Visualizations your audience won’t forget
Convey abstract concepts and data with professionally designed
charts and graphics you can easily edit and customize.
