Chart Vizzard
Vizzlo's AI-based chart generatorCreate your Milestones as Arrow in seconds
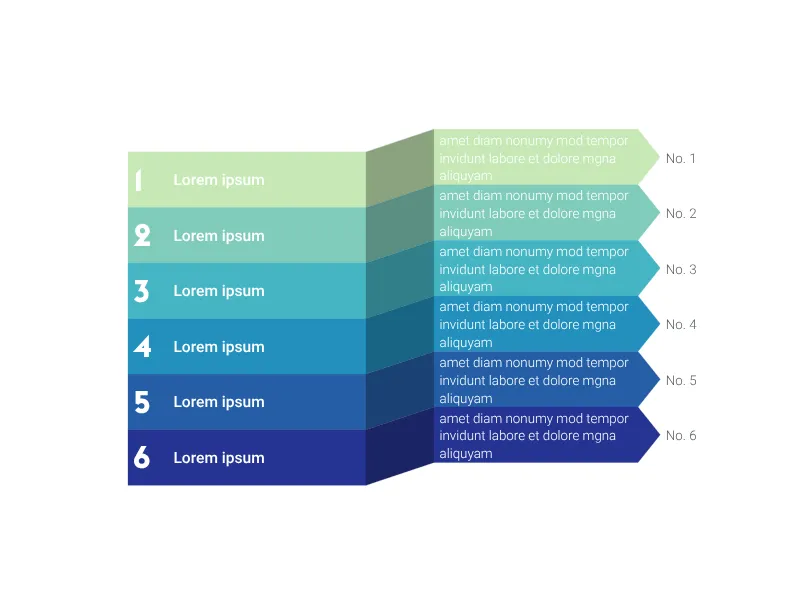
Point out up to ten events along a project development with this milestone plan plotted as an arrow.


Create your chart in 3 simple steps
- Create new Milestones as Arrow
- Add your data
- Export or share
Why Vizzlo?
- Create professional charts in seconds
- Fully customizable, no design skills needed
- Create directly in PowerPoint & Google Slides
Features
- Intermediate steps
- Different enumeration styles: numbers, letters, and none
- Custom colors
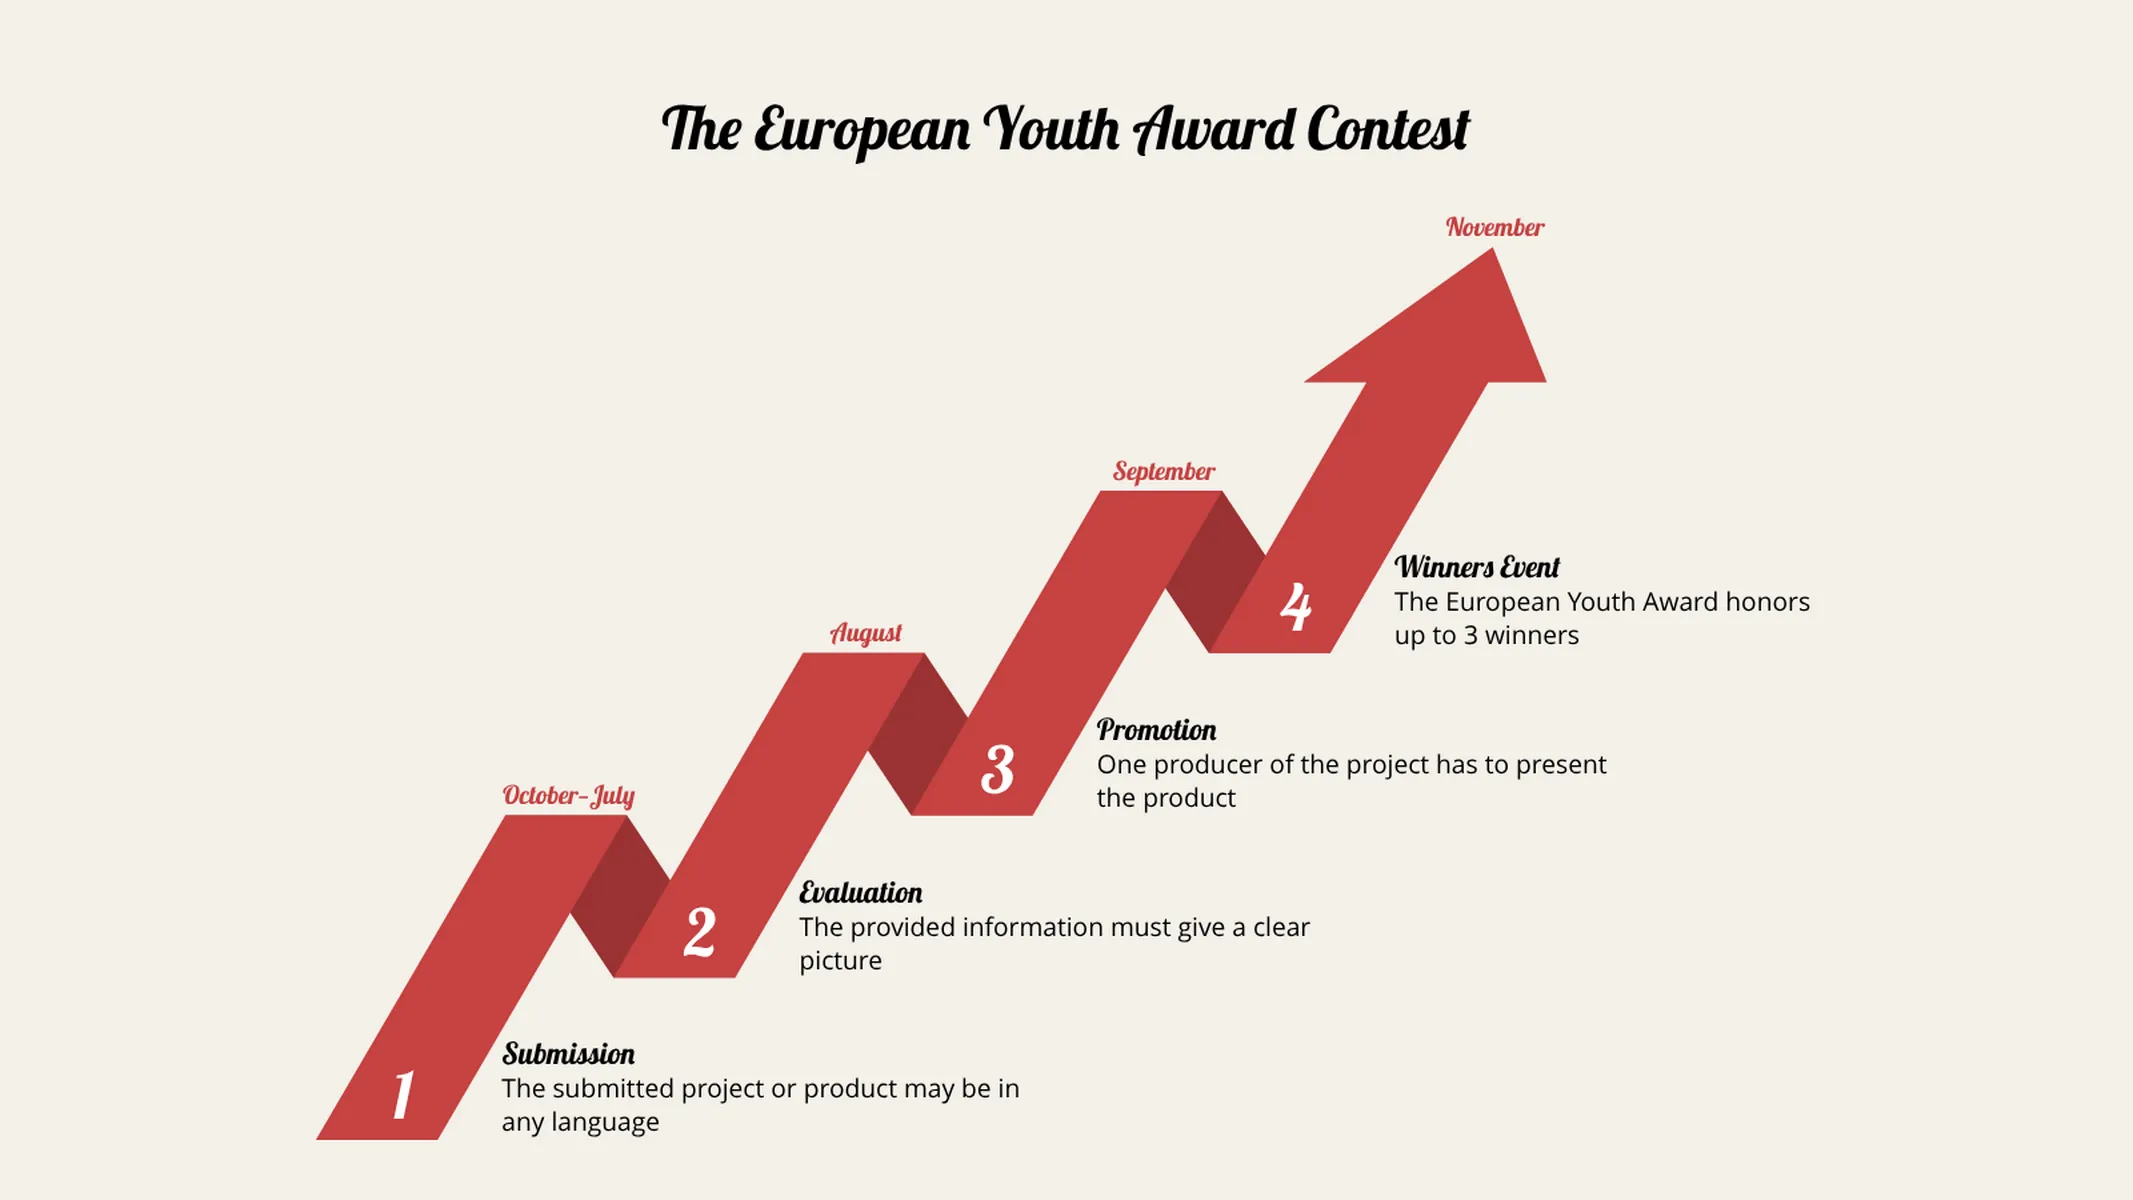
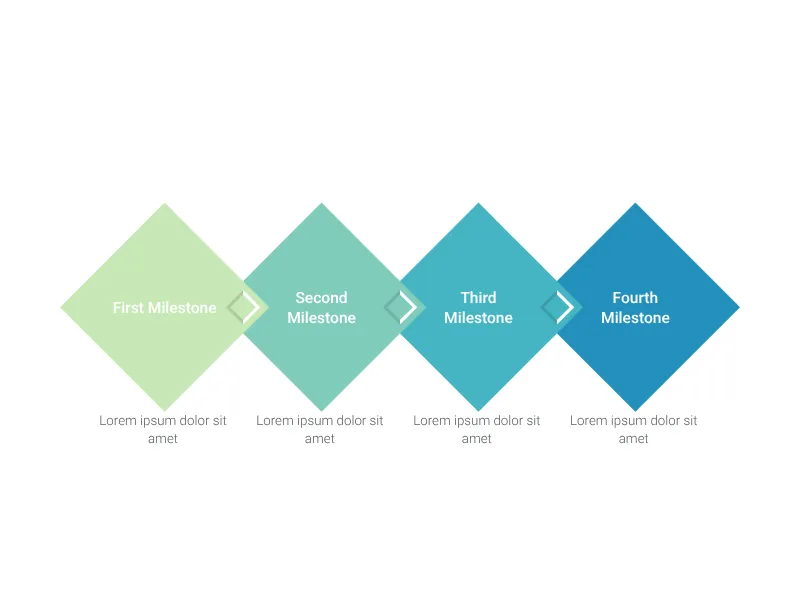
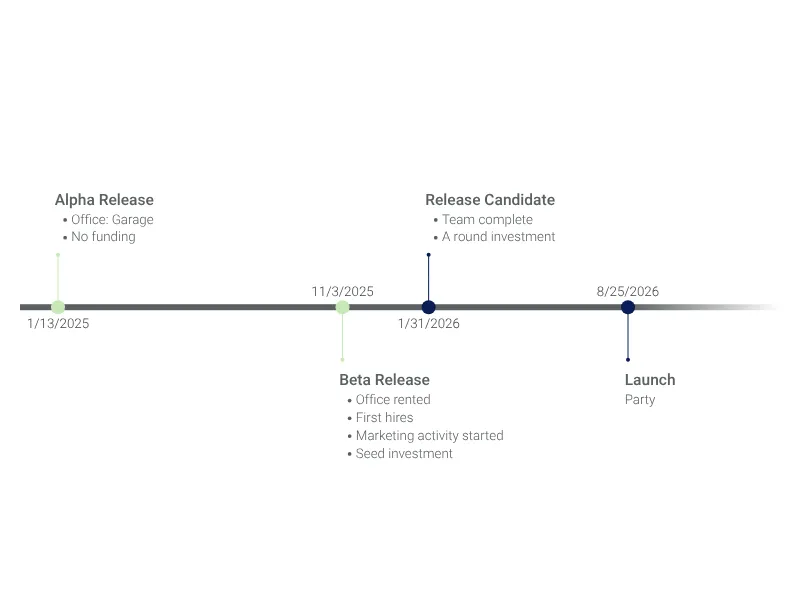
What is a milestones as arrow chart?
This chart is a sophisticated variation of a simple milestone plan. It can illustrate a sequence of events or stages towards a goal, as well as a process flow with consecutive steps.
Because the arrow evolves upwards, this chart is a powerful visualization that conveys the idea of progress and growth, as well as a sense of success/achievement.
How to create a milestones as arrow chart?
The milestones as arrow chart is engaging and very easy to create:
- Click on the elements to start editing them.
- Drag and drop the milestones to reorder them.
- Use the active cards in the sidebar to customize colors.
- Optionally enter your data using the spreadsheet.
Milestones as Arrow: What's new?
Enhance your productivity
Create a Milestones as Arrow directly in the tools you love

Create a Milestones as Arrow in PowerPoint with
Vizzlo's add-in

Loved by professionals around the world


Visualizations your audience won’t forget
Convey abstract concepts and data with professionally designed
charts and graphics you can easily edit and customize.