Chart Vizzard
Vizzlo's AI-based chart generatorWord Cloud
Generate a stunning word cloud (or tag cloud) with ease, just by pasting your text here.
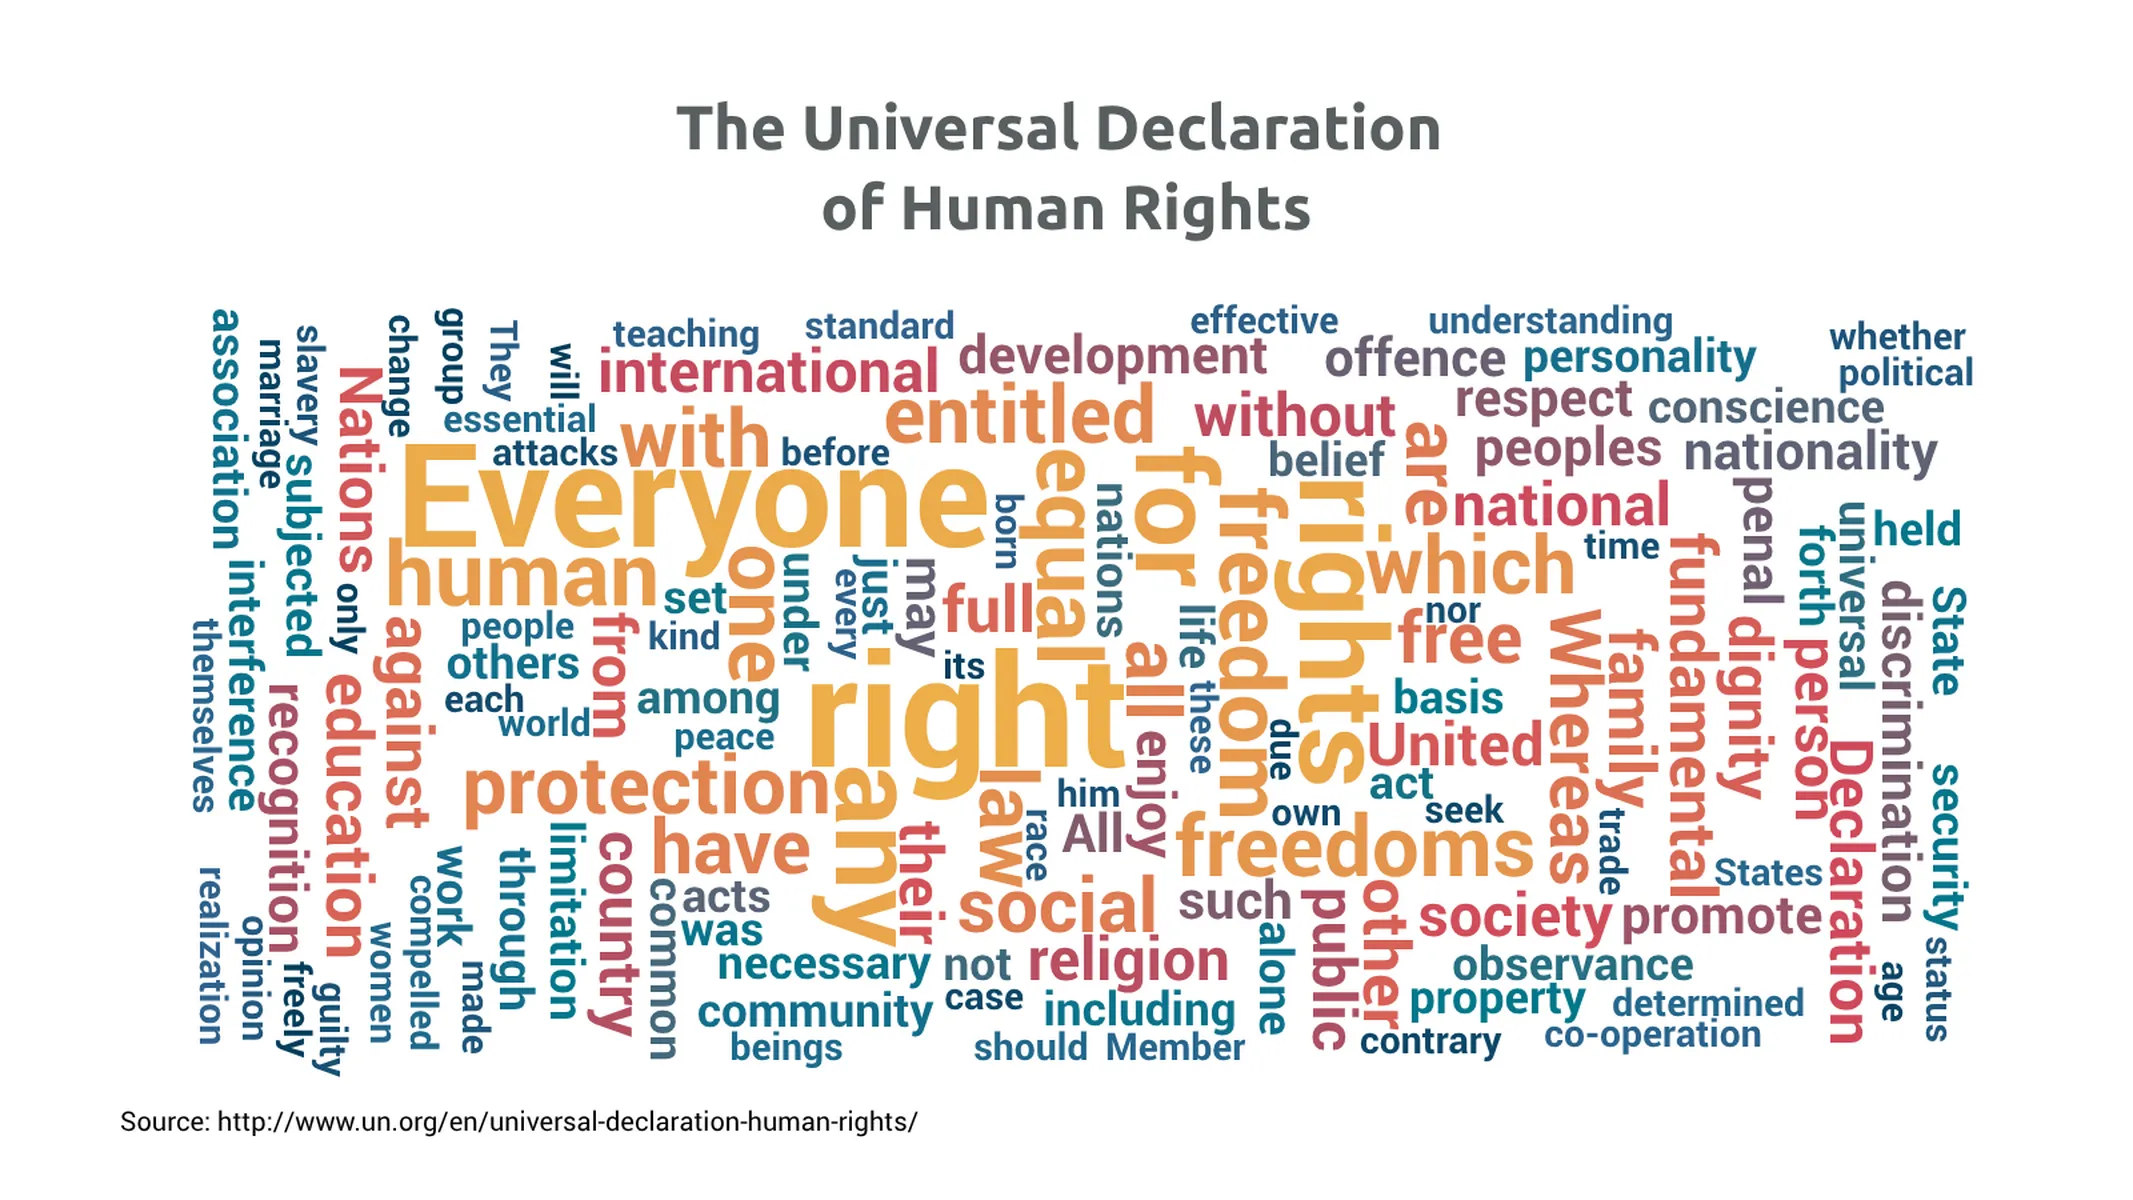
What is a word cloud?
A word cloud (also known as “tag cloud” or “weighted list”) is an intelligible and beautiful way to visualize text data. The more frequent the word is in a text, the heavier its weight is in the cloud.
Get inspired and transform articles, customer feedback, speeches, and any word list into a straightforward word cloud. Communicate key concepts with an easy-to-grasp and beautiful visualization.
Word clouds also make it is easy to grasp the relative size of a category – for example, a list of Olympians in which the size of their names reflects the number of medals they have won at the games.
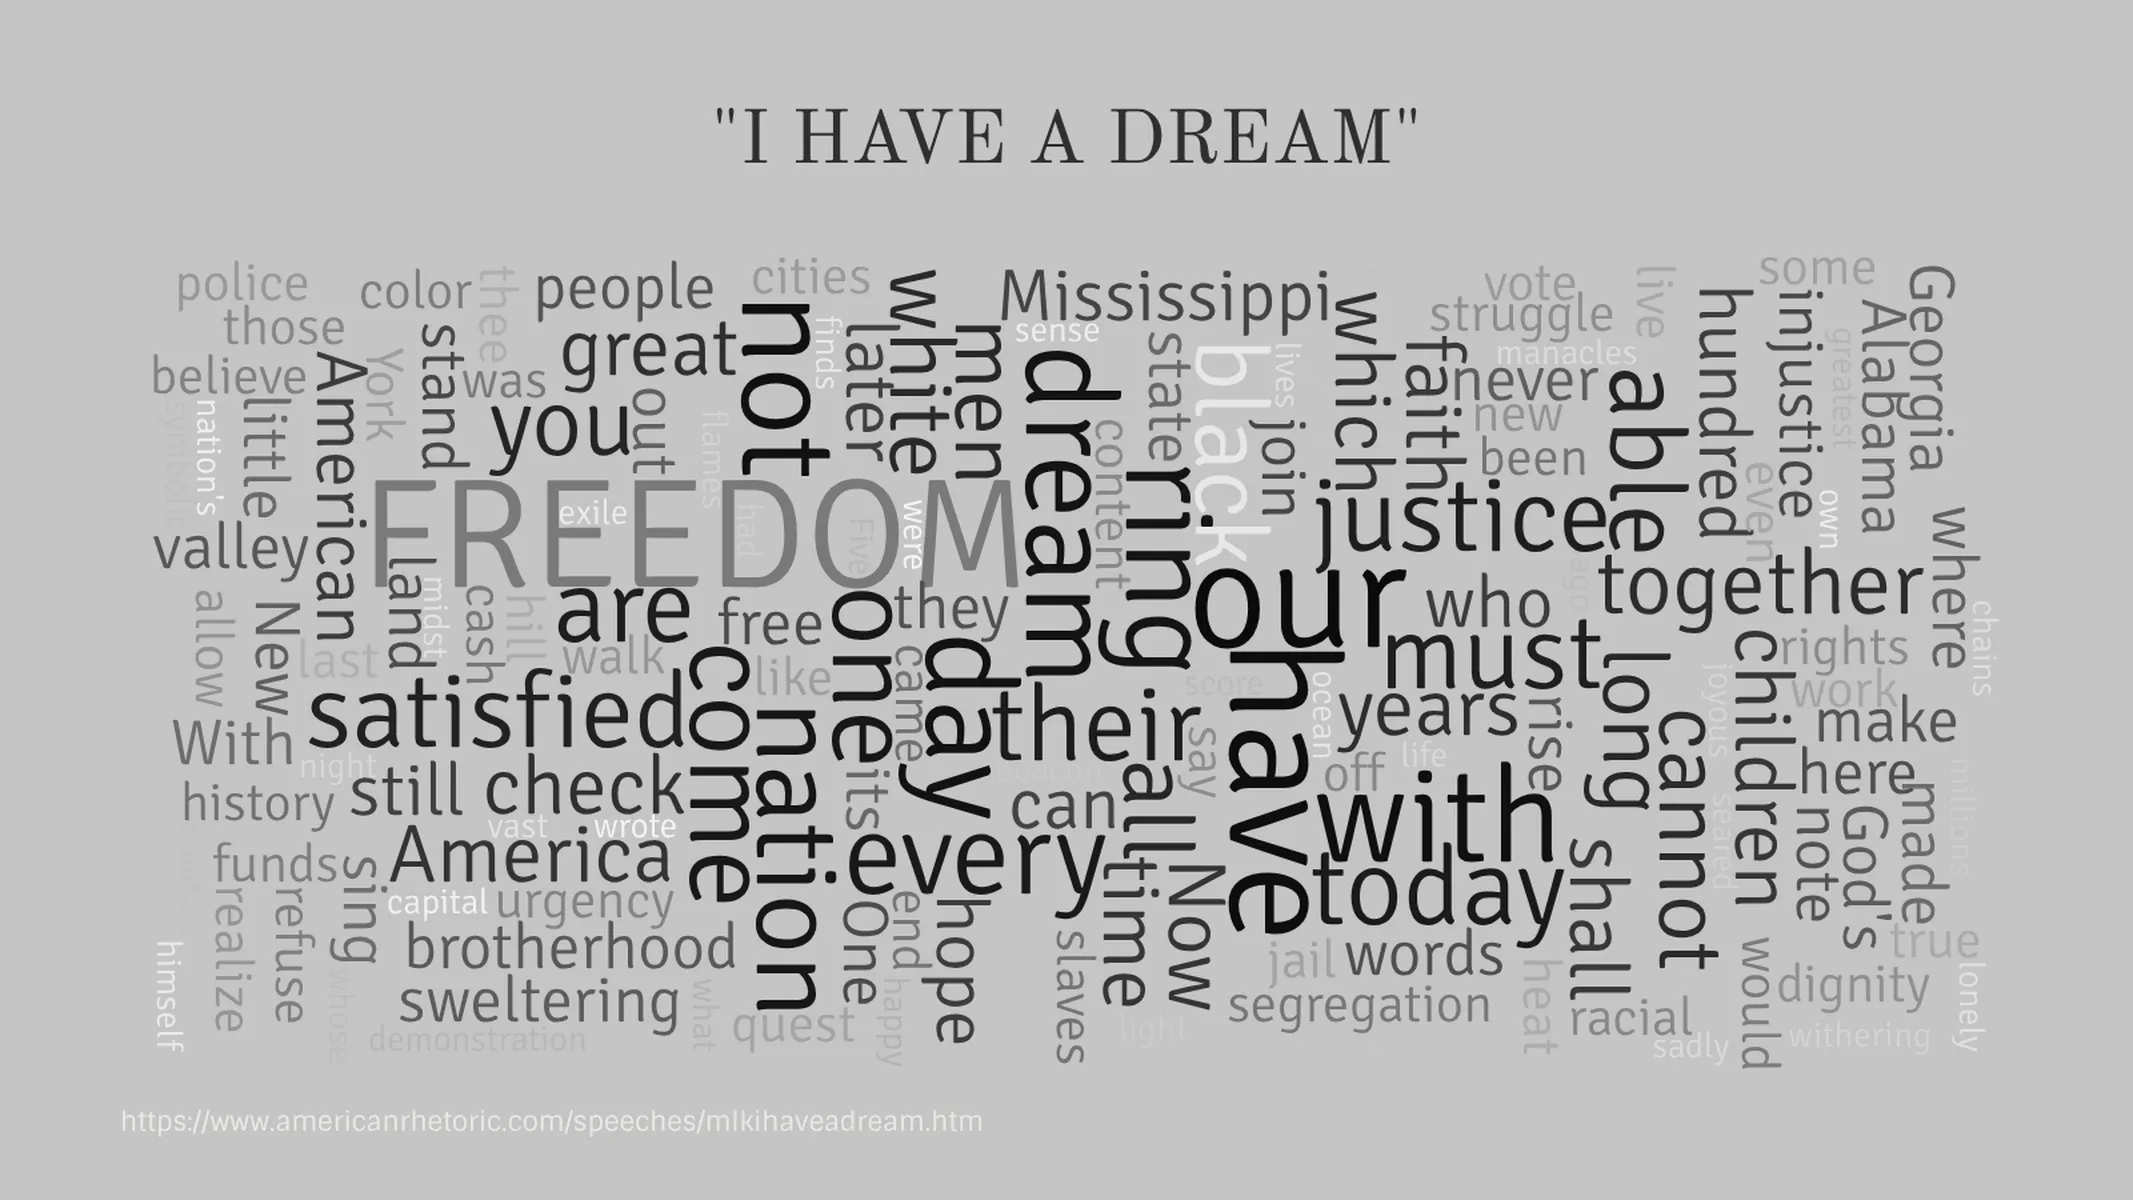
Check out the first cloud in the gallery above, depicting Martin Luther King’s famous “I Have a Dream” speech. By the weighting of words, the main motives become clear on first glance and can help you establish an idea or concept.
Best uses for the word cloud
- Quickly understanding the key message or tone of a large text by focussing on repetition
- Describing the relative size or importance of words in relation to each other
- SEO evaluation–use a word cloud to ascertain the terms Google will associate with your website content, fast
How to make a word cloud with Vizzlo?
Easily create a highly customizable word cloud. Follow these steps:
- Copy and paste your text into the field on the sidebar—the word cloud will be automatically generated for you
- Exclude terms by entering them separately in the field “Words to filter from text”
- You can include keywords and phrases that don’t appear in your text and define their size manually–click on the “+” button on the chart, or on the tab “DATA” of the sidebar, choose to “ADD KEYWORD” and adjust its size and color
- Alternatively, use the spreadsheet to enter a word list you wish to display
- Explore the text placement options on the “APPEARANCE” tab and choose your favorite layout Try different themes or customize yourself to switch colors and fonts
Word cloud: pro tips
- Your choice of typeface is crucial to set the tone of your message
- Exclude articles and pronouns to paint a clearer picture (for example, “the”, “he”, “a” etc are more likely to be common words, making for a very dull chart!)
- Enter a text directly to have the chart automatically size words by their frequency
- For categorization word clouds, enter the words you want to display via the data spreadsheet and assign values to represent their size
- Choose between horizontal alignment, diagonal alignment, or mixed alignment
Word cloud maker: key features
- Highlight phrases and keywords
- Adjustable number of words
- Filter words that must have a minimum amount of characters
- Custom text placement/layout options
- Custom colors
Resources
- Step-by-step tutorial
- How to use Word Clouds for SEO
- See Wikipedia’s Tag Cloud page for its listing relating to the word cloud.
Word Cloud: What's new?
Quotation marks are now being removed from the visualization.
‘question?’ and ‘question’ are now considered as the same word.
You can now filter a word cloud by the number of characters per word.
Word Cloud Alternatives


Use Cases
Signs & MemesEnhance your productivity
Create a Word Cloud directly in the tools you love

Create a Word Cloud in PowerPoint with
Vizzlo's add-in

Loved by professionals around the world


Visualizations your audience won’t forget
Convey abstract concepts and data with professionally designed
charts and graphics you can easily edit and customize.