Chart Vizzard
Vizzlo's AI-based chart generatorLinked Gantt Charts: The Ultimate Guide
This is a guide to dependencies in Gantt charts.
In this new guide you’ll learn:
- What dependencies are used for
- What type of dependencies exists
- How to add dependencies to your Gantt chart
Let’s get started.
What is a dependency?
Dependencies define the relationships between tasks. Use them to determine when a task should begin or end in relation to other tasks. In the Gantt chart, dependencies appear as lines connecting two tasks.
Types of dependencies
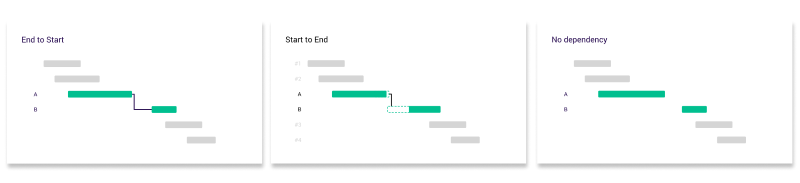
There are three types of dependencies you can display between any two tasks:
- End to Start dependency: Task B cannot begin until Task A has been completed.
- Start to End dependency: Task B cannot be completed before Task A begins.
- No dependency: Tasks A and B can be worked on simultaneously without any dependence.
How to create a dependency?
Vizzlo provides a simple mechanism to link task dependencies.
- Use our free Gantt chart maker to create a new document.
- Select any task
- Add the dependency in the sidebar
These dependencies may or may not be visually represented depending on the project. By a single click you can hide all dependencies that were added.
Working with Gantt chart
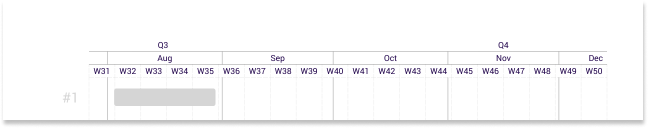
Gantt charts are widely used in a wide range of planning processes. They are always drawn to a linear timescale, using years, quarters, months, weeks, or days to suit any particular purpose.
The benefit of using a Gantt chart is its simplicity. Gantt charts need little or no explanation.
When a project timeline contains too many dependencies it will get hard to visually communicate the relationships between tasks. A more advanced technique used in project management is the critical path method (CPM), or critical path analysis (CPA). A critical path is determined by identifying the longest stretch of dependent activities and measuring the time required to complete them from start to finish.
Vizzlo is a tool that helps you to create beautiful business graphics easily. Besides our online chart maker, Vizzlo offers a PowerPoint add-in that ships with our free desktop app. Vizzlo’s desktop app is the charting tool that you can take with you wherever you go. With hundreds of business charts and graphs, unlimited features, and seamless integration, Vizzlo helps you create visualizations with ease. Whether you work online or offline, you can create charts with confidence. Vizzlo makes charting easy.
Ready to create beautiful visuals? All you need is register for an account.