Chart Vizzard
Vizzlo's AI-based chart generatorGantt chart: what it is and how to create it
A Gantt Chart is one of the most widely used project management tools across industries for visualizing work and tracking activities. A project is a complex process so it needs tools to make their communication easy. In this guide we will explain to you what a Gantt chart is, how to use it and how to make a Gantt chart.
Set up a detailed project plan
The first step when creating a Gantt chart is to set a detailed project plan. A project plan consists of the following elements:
- Is a series of tasks
- A task hierarchy
- A specific start date and end date.
When the project is small, a Gantt chart can be created with spreadsheet software such as Microsoft Excel. But the more complex the project, regularly updating a Gantt chart becomes time-consuming.
Vizzlo’s Gantt chart allows you to create your project plan on the fly. You can either edit the project hierarchy in the Gantt’s task list at the left of the chart, easily copy and paste your data into the chart’s spreadsheet, import your data as Microsoft Excel file, as a .CSV file, or connect to an external data source such as a Google Sheet file.
What is a Gantt Chart?
A Gantt chart is commonly used in project management. It is one of the most popular and most effective ways to show a project’s timeline. A Gantt chart shows you what has to be done, when it has to be finished and who is responsible for that. Tasks or activities are displayed from top to bottom against time. Bars represent tasks as part of an activity. From the position and length of the bar, you can see the start date, duration, and end date of the task.
How to make a Gantt chart
- Create a new Gantt chart with a free Gantt chart maker
- Open the spreadsheet and import your data.
- Edit the placeholder text with your own content and customize your Gantt chart design.
- Export your work as PDF or PNG.
- Embed the chart into PowerPoint or Google Slides.
Start creating your own Gantt chart using Vizzlo.
Try Vizzlo for freeThe chart is fully interactive. Simply click on any element and start editing. By using Vizzlo’s Gantt template you can build and manage comprehend project plans, you can easily add or remove activities and tasks, set or adjust the duration of tasks. Just move activities vertically, and adjust the start and end dates of a task with drag and drop simplicity.
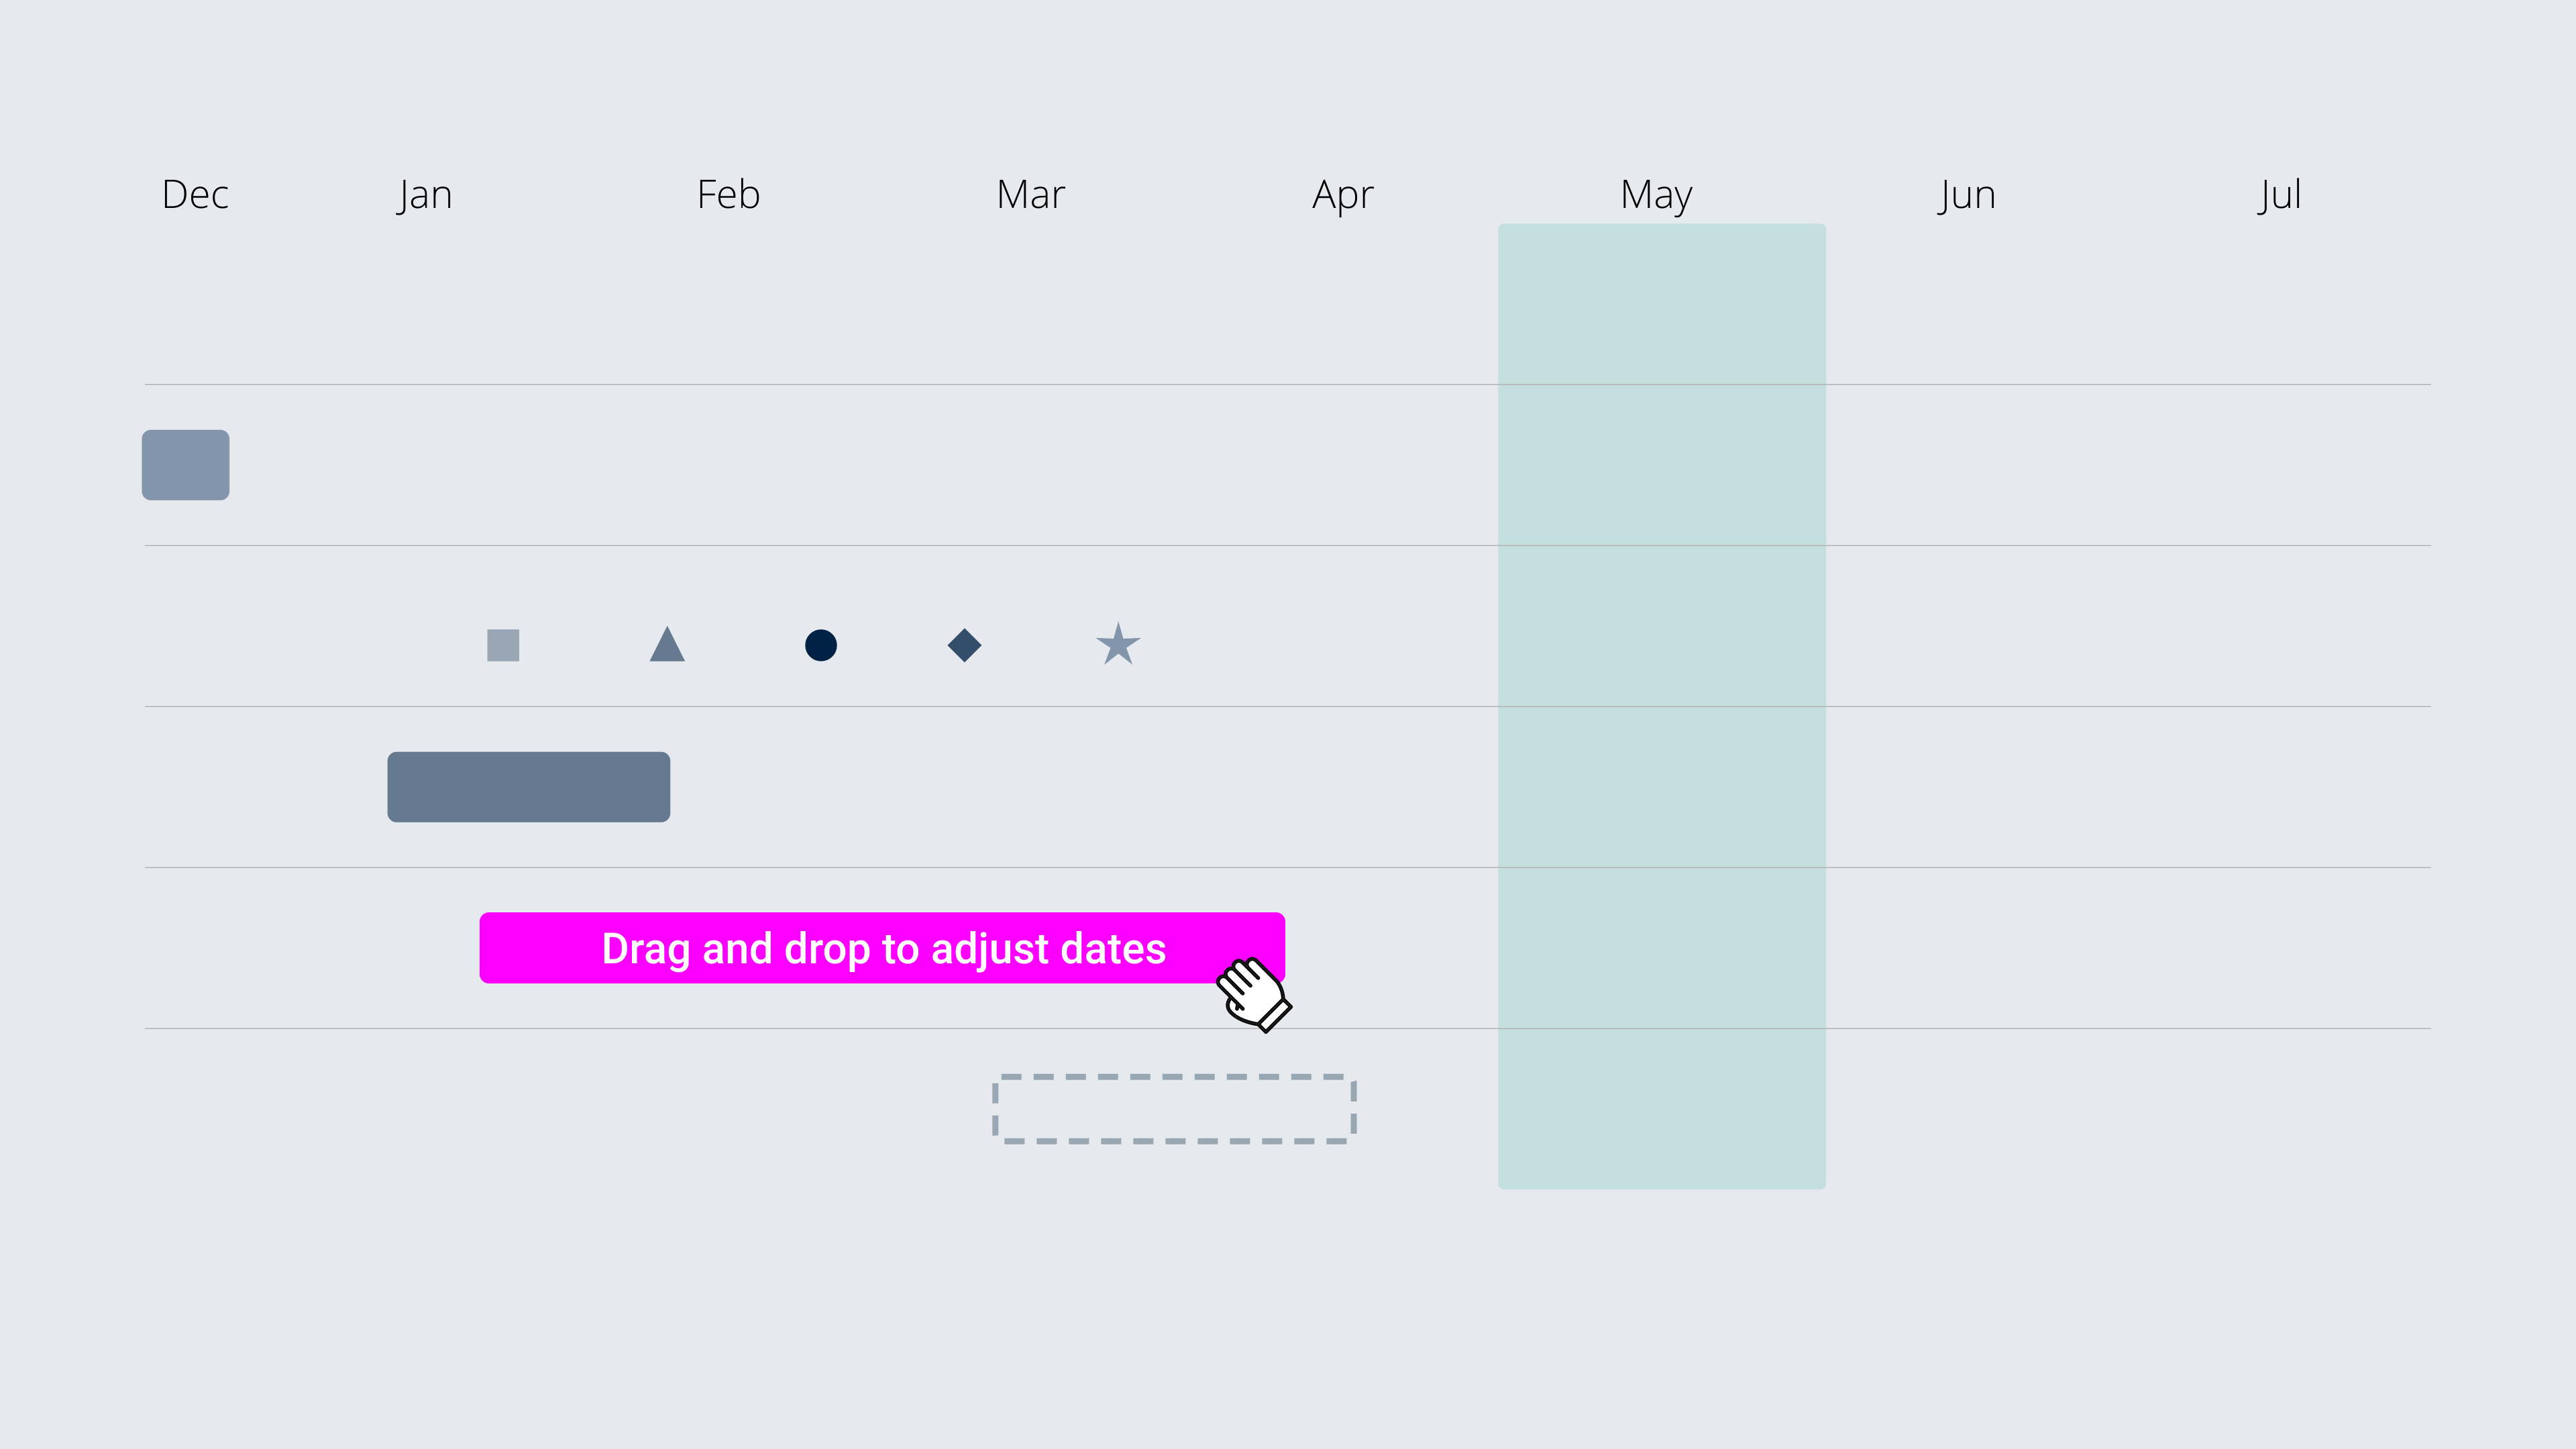
The Gantt chart keeps the project team and any stakeholders informed from start to finish. A plain vanilla Gantt chart can be enhanced with a few additional features that any Gantt chart will love:
- Use colors and strokes to represent tasks of different kinds.
- Show dependencies between tasks with additional arrows.
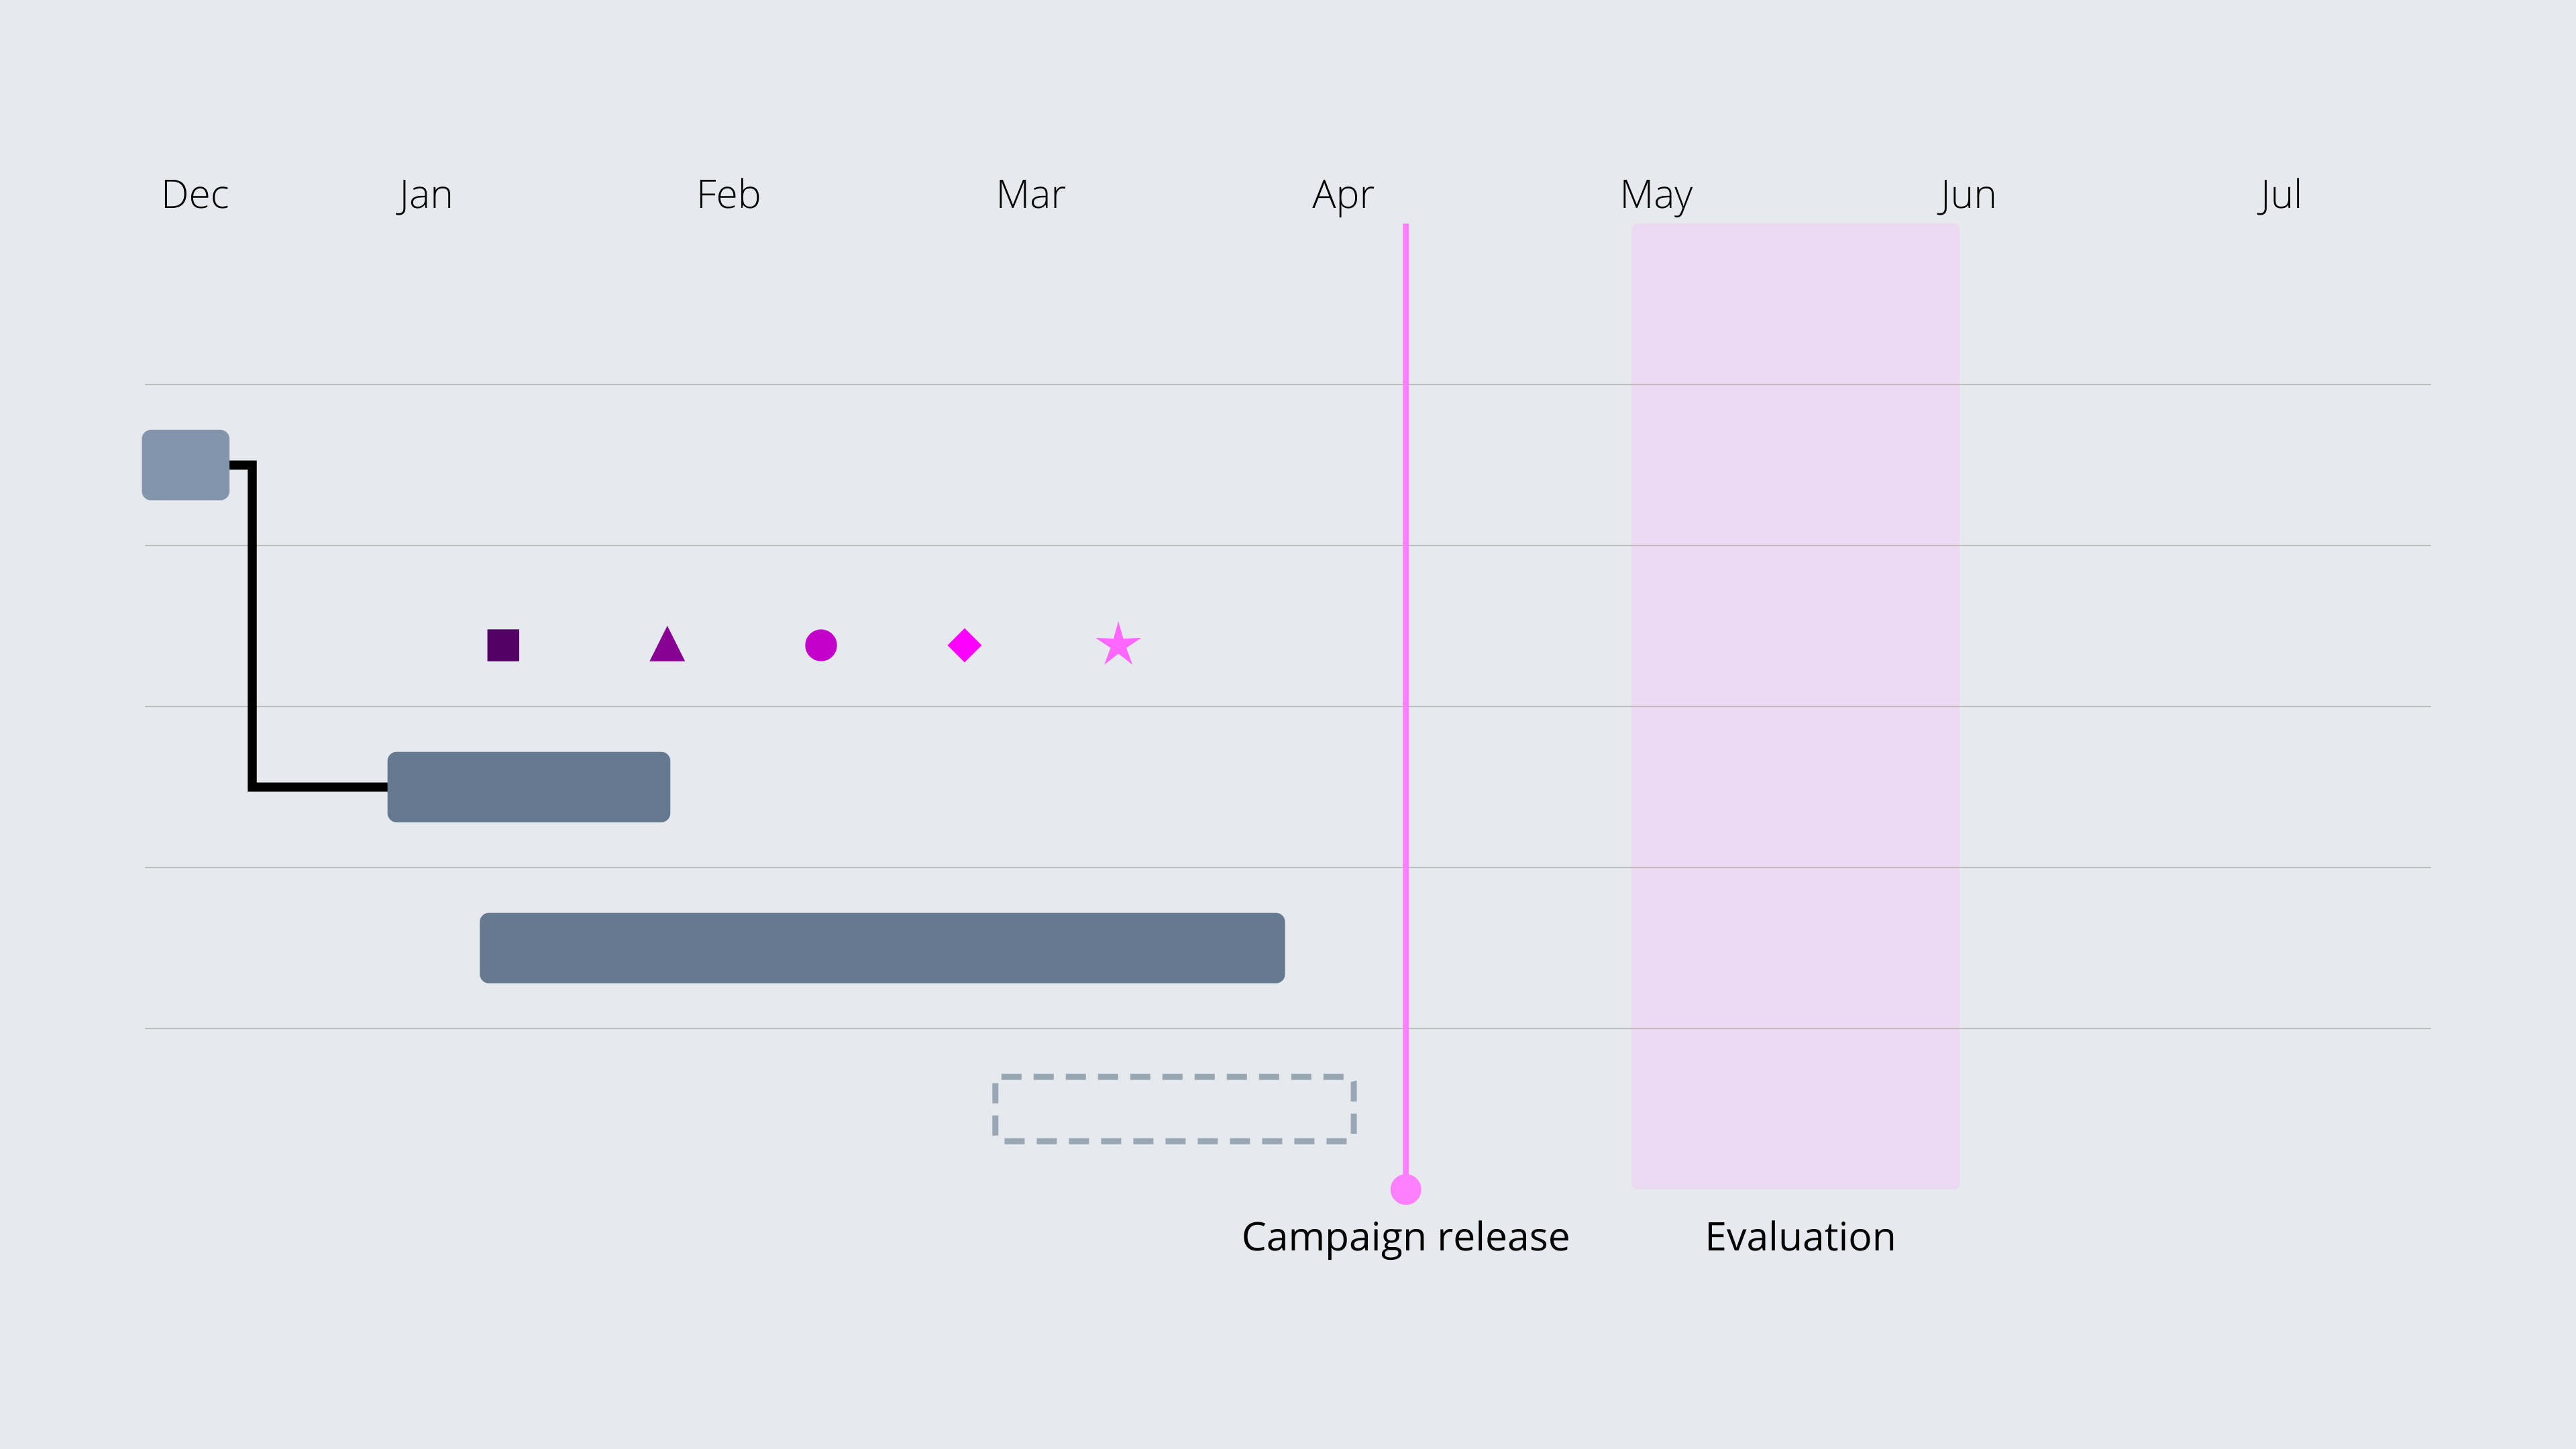
- Add milestones to mark key dates and events.
- Highlight weekends and other periods with shades.
Colors
There are two fundamental use cases for color in Gantt charts:
- Colors are used to distinguish groups of tasks from each other.
- Colors are used to highlight tasks, milestones, or periods.
The types of colors we use depend on the use case. Normally you would want to use a qualitative color scale to distinguish between different tasks. That is because tasks do not have an intrinsic order.
When you want to highlight specific elements in your Gantt chart colors are probably the most effective tool, in which case you might want to Make Gray Your Best Friend.
Strokes
Using different strokes can have the same effect as using different colors. Though strokes are not as effective. When you are using Vizzlo you have the option to distinguish between three types: solid, stroke, and dashed.
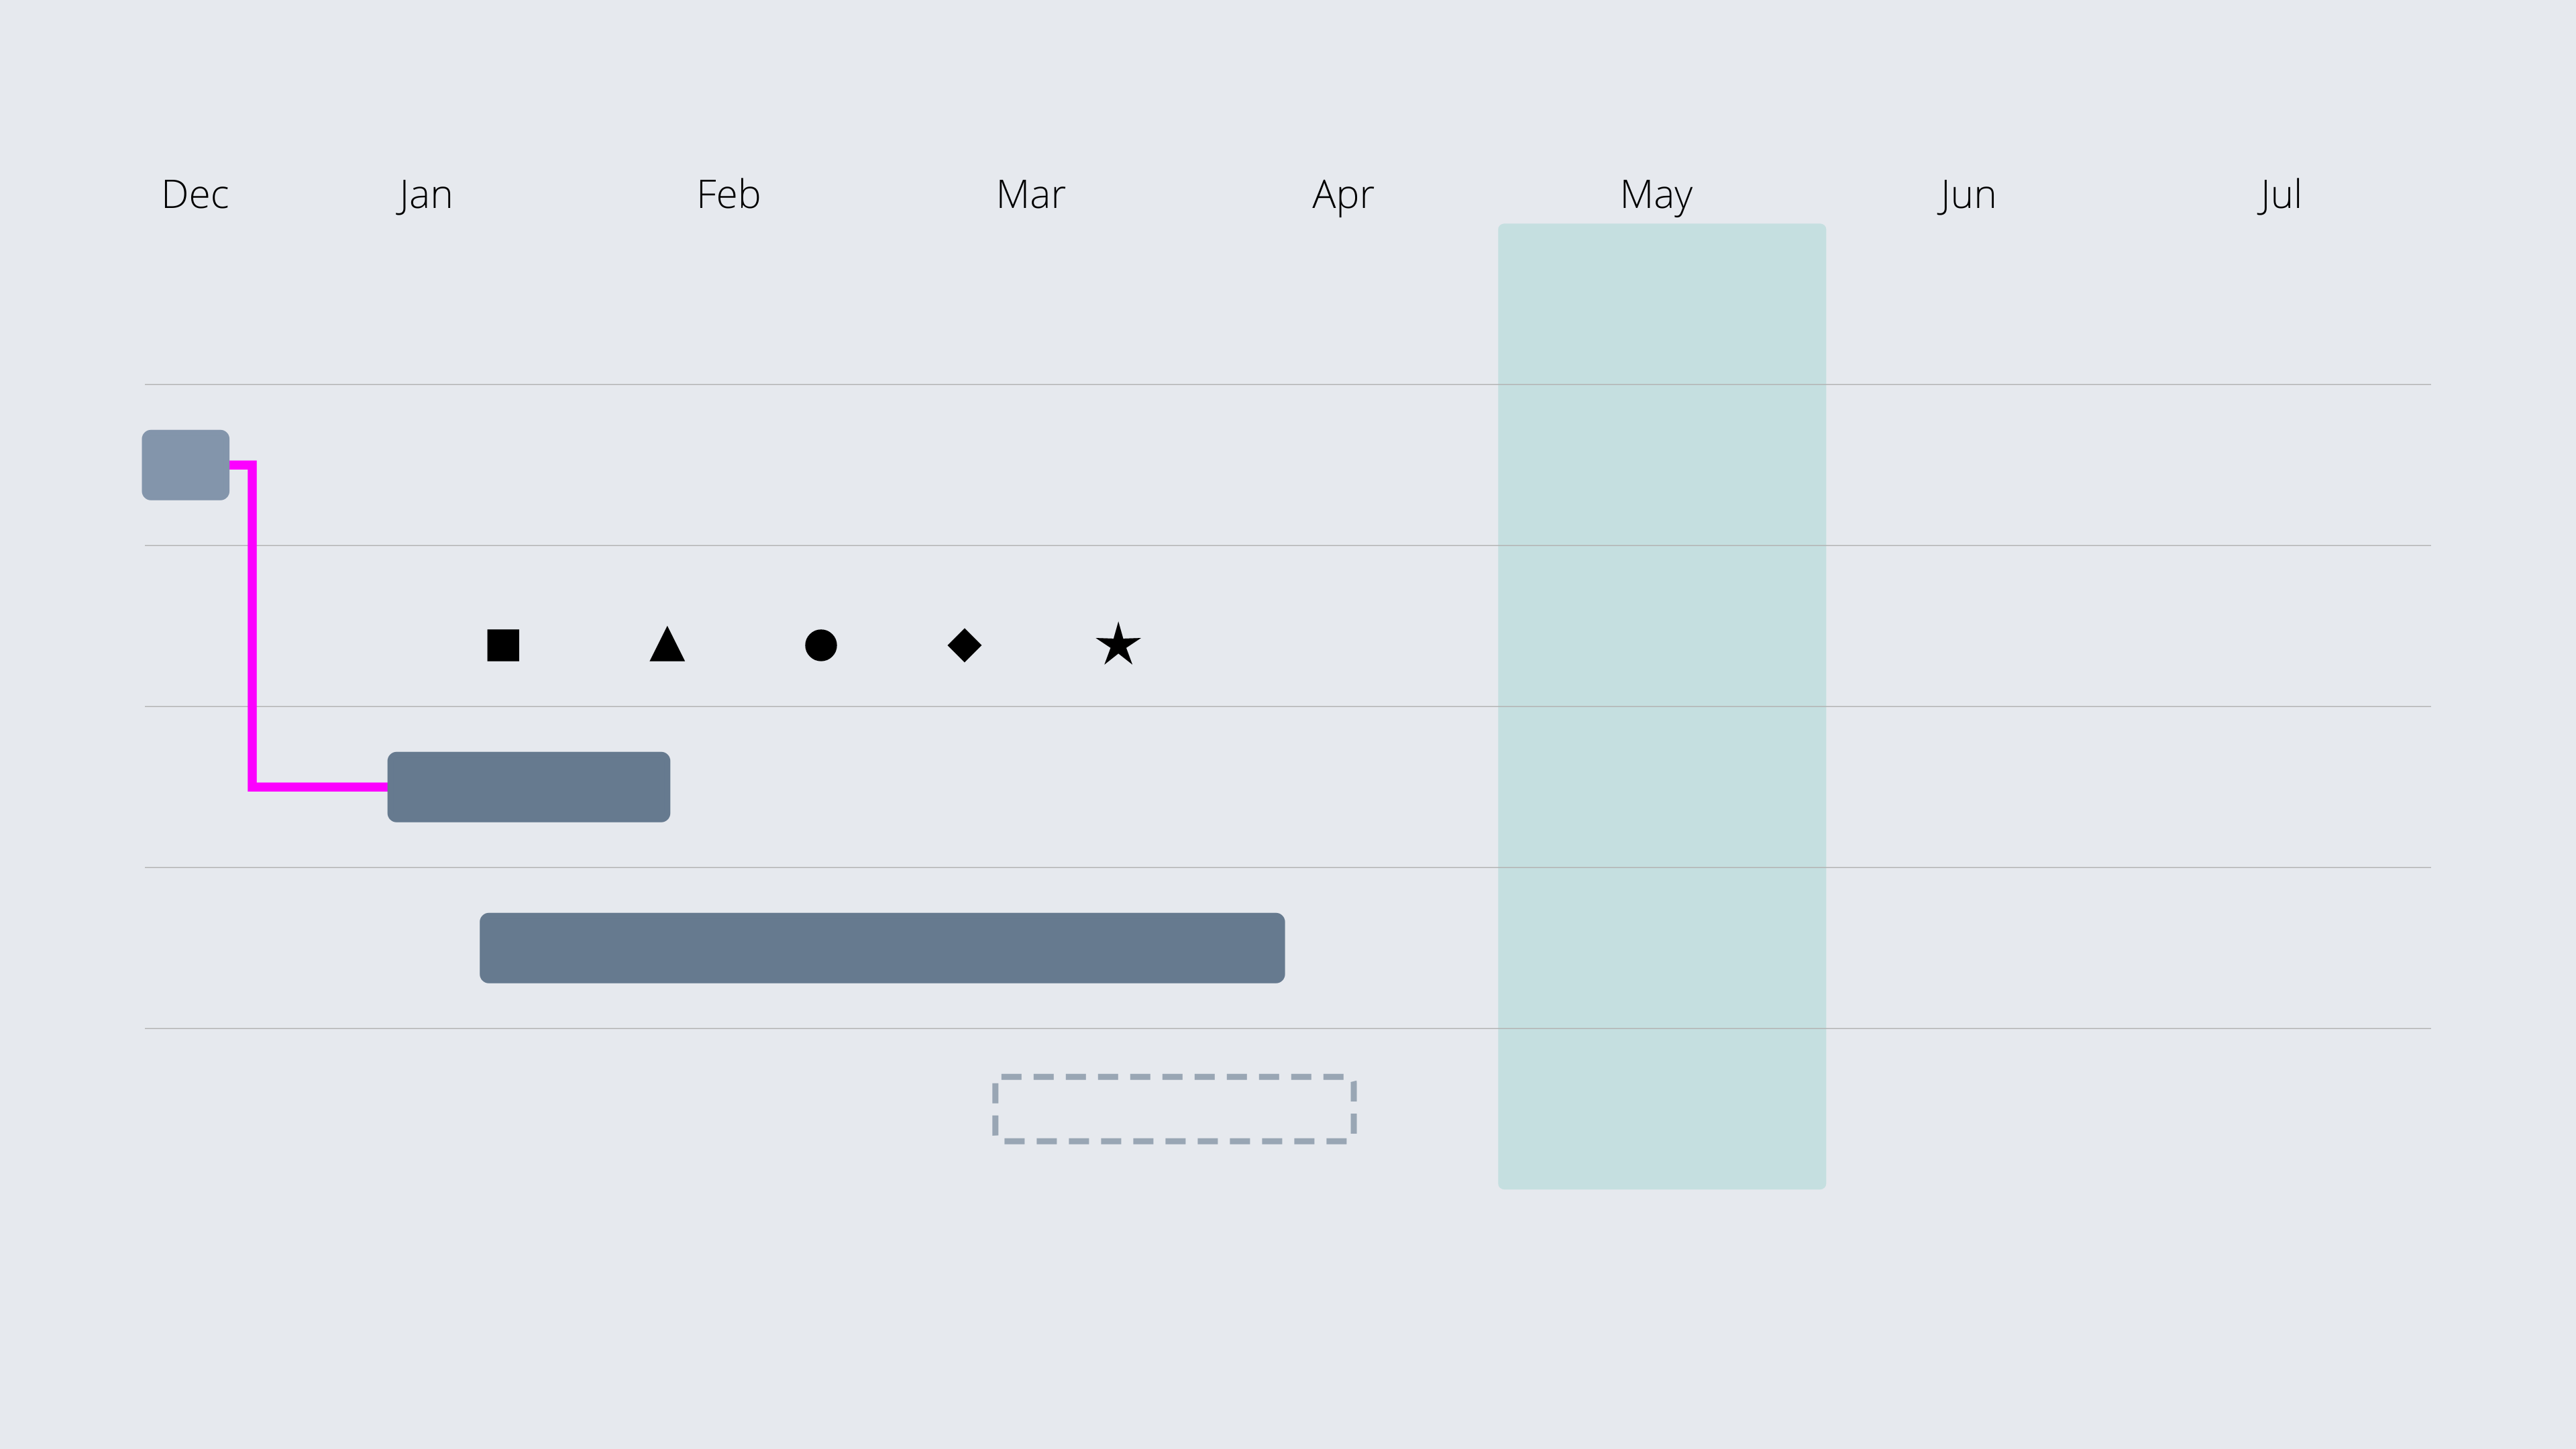
Dependencies
Project plans normally require tasks to be performed in a specific order. When there are tasks that need to be finished before other tasks can be started, these depend on each other. In a Gantt chart, this is typically represented by lines that connect multiple tasks.
Add milestones and shades to highlight a single day or a period
A milestone highlights a specific date along the project timeline. It is a marker without a duration. Using Vizzlo, you have the option to place milestones within a task, which appears on the Gantt chart as one of five milestone symbols. Once a milestone is added to the chart, you can drag it to a desired date.
Milestones are generally used to indicate important dates on the project plan at a glance. Oftentimes key events such as
- Kick-off
- Holidays
- Project end
Summary
The Gantt chart is a visual tool that offers clear benefits to project managers, who want to effectively manage their projects. It allows you to see at a glance:
- The start and end date of the whole project.
- What the various activities are.
- When each activity begins and ends and how long each is scheduled to last.
- Who is responsible for each task.
Ready to create a Gantt chart?
Use Vizzlo’s online Gantt chart software for free. All you need to o is sign-up for an account.