Chart Vizzard
Vizzlo's AI-based chart generatorHow to Make an Awesome Timeline
First thing’s first: Develop and prepare
If you want to know how to build a better visual timeline or timeline infographic, first you have to go through the steps to develop and prepare your timeline data. Think of this stage as the investigation–collect the evidence, the locations, the perps (ok, more likely to be your team members) along with times and dates. The act of creating a timeline graphic can actually help you order this information in your mind, giving you clarity and a better understanding of what has–or will–happen.
Use Cases: Time to get in line
Beneath the timeline’s deceptively simple exterior is a myriad of use cases, from personal projects (visualizing recipes is a neat time-saver in the kitchen) to scientific breakthroughs that change the course of human history. Power to the timeline!
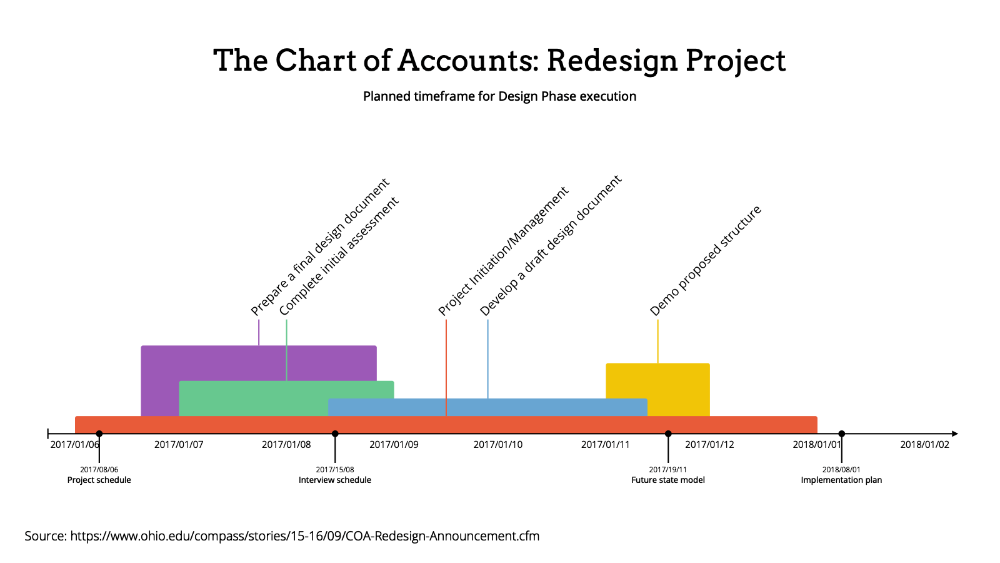
How to create a Project Timeline: (Motivation) To Plan*
Gathering ideas and formulating them into a methodical schedule will always keep your projects on track and running smoothly. Think about:
- Who is responsible for which tasks, and whether the workload is distributed evenly
- Which tasks are reliant on one another, and which overlap in the schedule
- What contingency plans you can implement (and which roadblocks might trigger them)
*Check out Increase the clarity of your project schedule with 5 Charts & Timelines on the Vizzlo Blog for more ideas
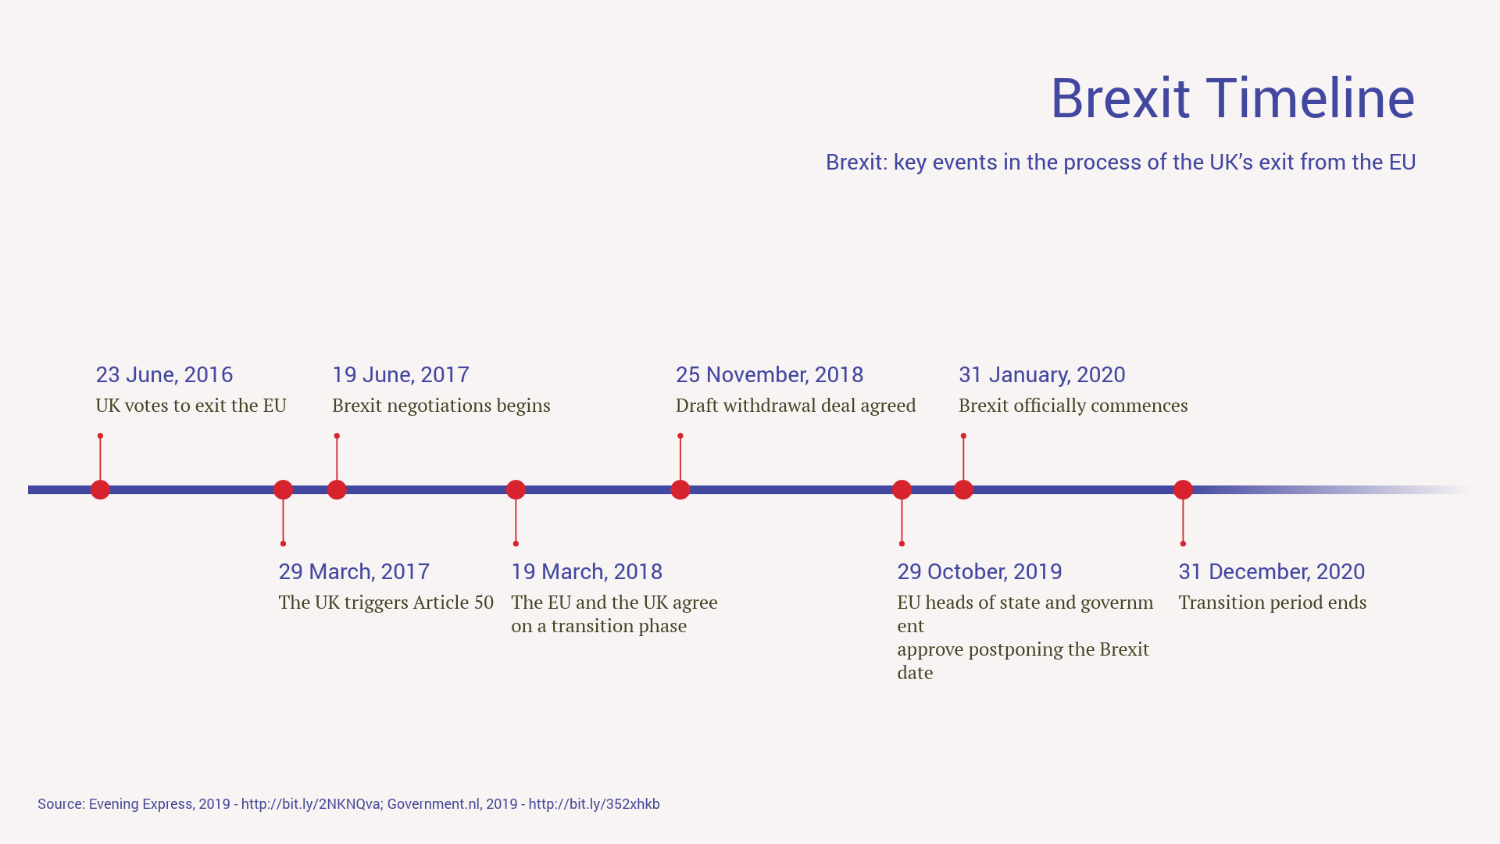
How to create a Business Timeline: (Motivation) To Illustrate
Visualizing stages of development is crucial for keeping (current and potential) investors in the loop. Key factors:
- Design is of utmost important here; keep minimal textual information, bold colour choices and clean layout for the highest impact
- Limit your timeline to 6-12 months to ensure you don’t over-complicate things
- While it’s easy to get caught up in your product and its potential, no business timeline is complete without the nuts and bolts such as legal procedures, procuring licensing and permits, and other external checks and balances
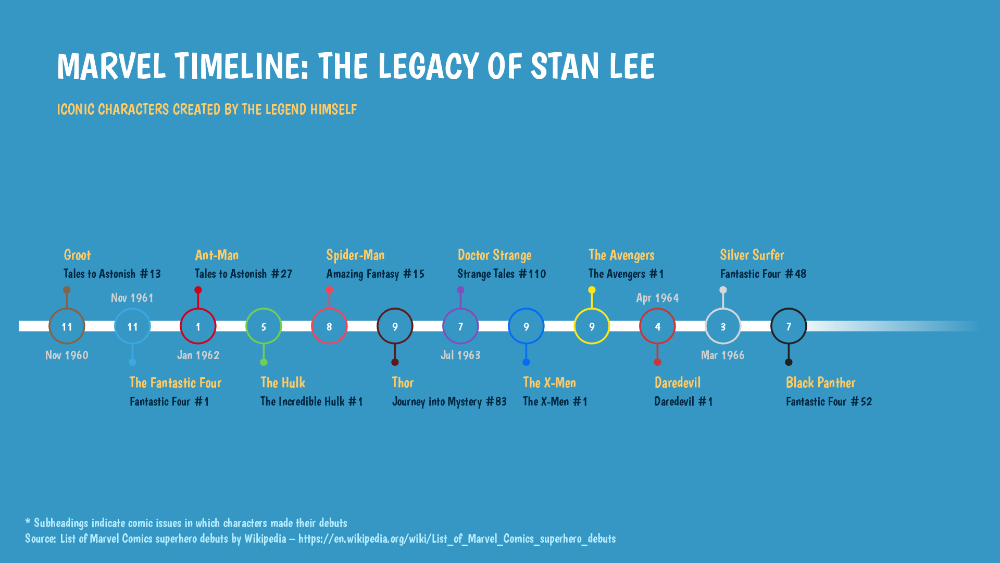
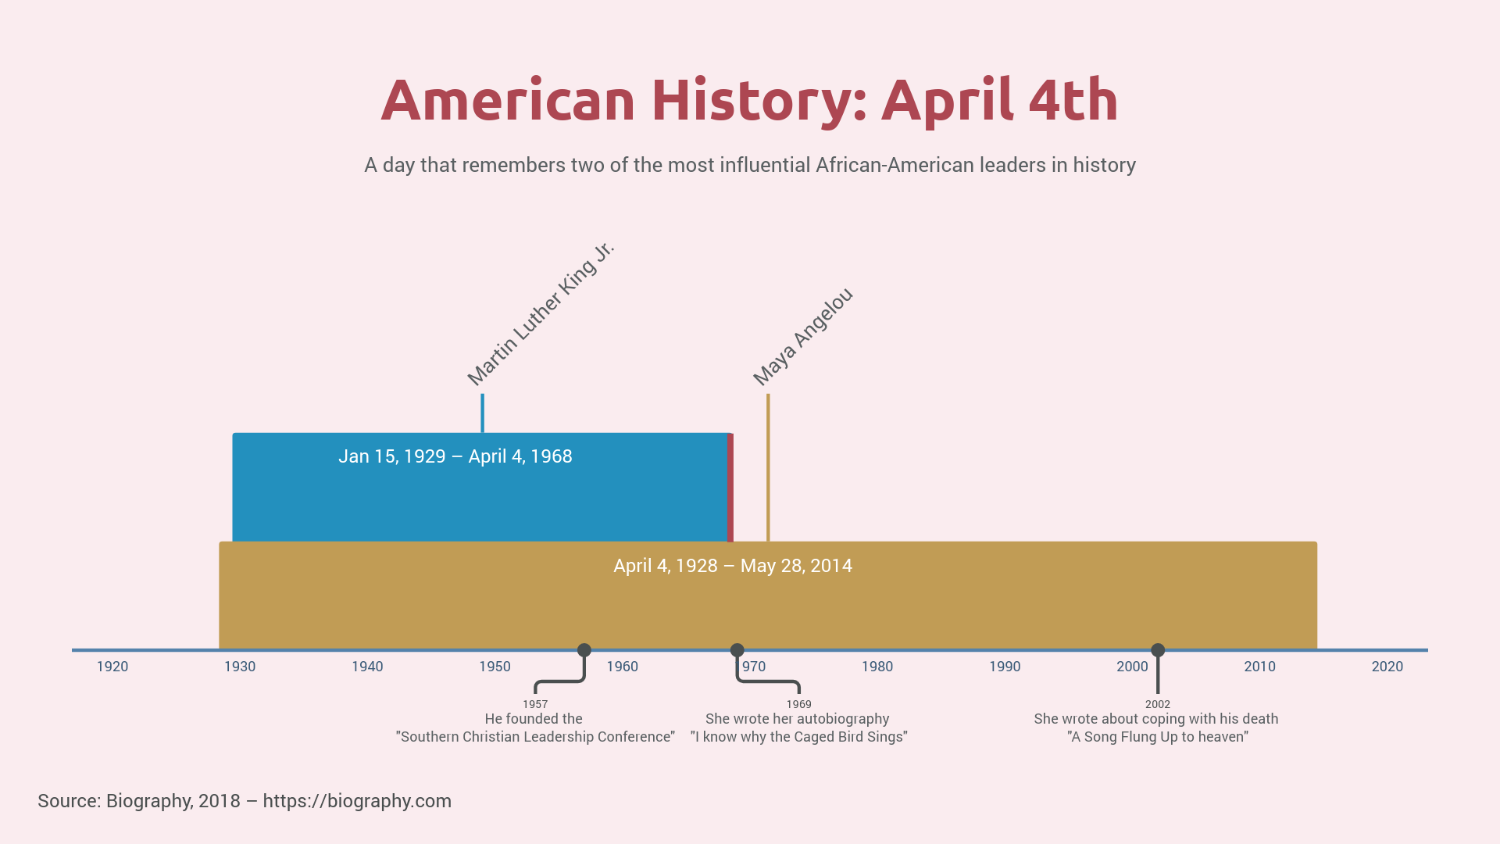
How to make a History Timeline: (Motivation) To Learn
Enhance the understanding of developments across time by showing the changes visually. Consider:
- Each notable event’s counterpart - for example, for every coronation of a monarch mark their birth and death for a fuller picture of history
- How events can be grouped to create time periods
- The global picture: are events elsewhere in the world that overlap* affecting each other?
*Pro Tip: our Layered Timeline is especially useful to visualize this concurrence
How to make a Science Timeline: (Motivation) To Compare
Significant scientific advancements and discoveries rarely happen overnight, which is where timelines can really help show the span of their development. Ensure you include:
- Names of all scientists involved in work that culminated in your advancement
- Dates of studies’ publication
- Criticism which contributed to the formation of new ideas*
- The lifespan from theory to evidence
*Pro Tip: So much information can look cluttered on a standard horizontal timeline infographic–try a Fishbone template for longer notes
Dataviz in Practice: Timeline Creator
Get creative with your timeline inforgraphics! Easily create a compelling timeline online and export it to your presentations and reports. Click on the video tutorial on the Create a Timeline Chart page or just follow these super easy steps:
- Select the document size on the tab “APPEARANCE” of the sidebar
- Choose a “date style” to define how to organize your data, if as days, weeks, months, etc.
- Click on any milestone to edit the data and change colors if necessary
- Click on the axis to add a new milestone or a scale break
- Finally, fine tune the look of your timeline exploring the customization options of the “APPEARANCE” tab
- Quickly add a larger amount of data using the spreadsheet. For this, click on the button “SPREADSHEET” in the tab “DATA” of the sidebar. With the help of the wheel icon, make sure that the date format matches with your dataset. Import or copy and paste your data into the table
Start designing your own timelines in just a few steps.
Vizzlo is super easy and you can try it for free .
Start designing your own charts and business graphics.
Try Vizzlo for free