Chart Vizzard
Vizzlo's AI-based chart generatorSeptember 19, 2019 • 6 min read
Increase the clarity of your project schedule with 5 Charts & Timelines
Rome wasn’t built in a day, but effective planning and realistic goals will help you close your projects faster than ever.

Managing a project will, without fail, always run more smoothly with a project timeline in place. You’ll be able to see exactly how and when all your tasks and aims will fit together, keeping everyone in your team focussed and aligned.
Now, listen to me when I say I know this from experience. I used to be like you; keeping all my team’s aims in my head, scribbling notes on any piece of paper available, thinking that ‘just doing it’ would save me time and lower my workload. If you’ve ever managed a project or a team this way and tried to take a vacation, you’ll know that this process never works (and those plane tickets never get booked). But what if you have no idea where to start? Enter: data visualization for project schedule planning.
Working for a data visualization company has given me access to all the charts and graphs my heart could desire, but I’ve settled on a few that help me better understand what’s ahead of me, communicate this with my team, and anticipate any potential threats ahead. Take a journey with me through the project-planning process step by step, and I’ll list my top 5 visual aids as we go.
1. What is your brief, in the briefest sentence?
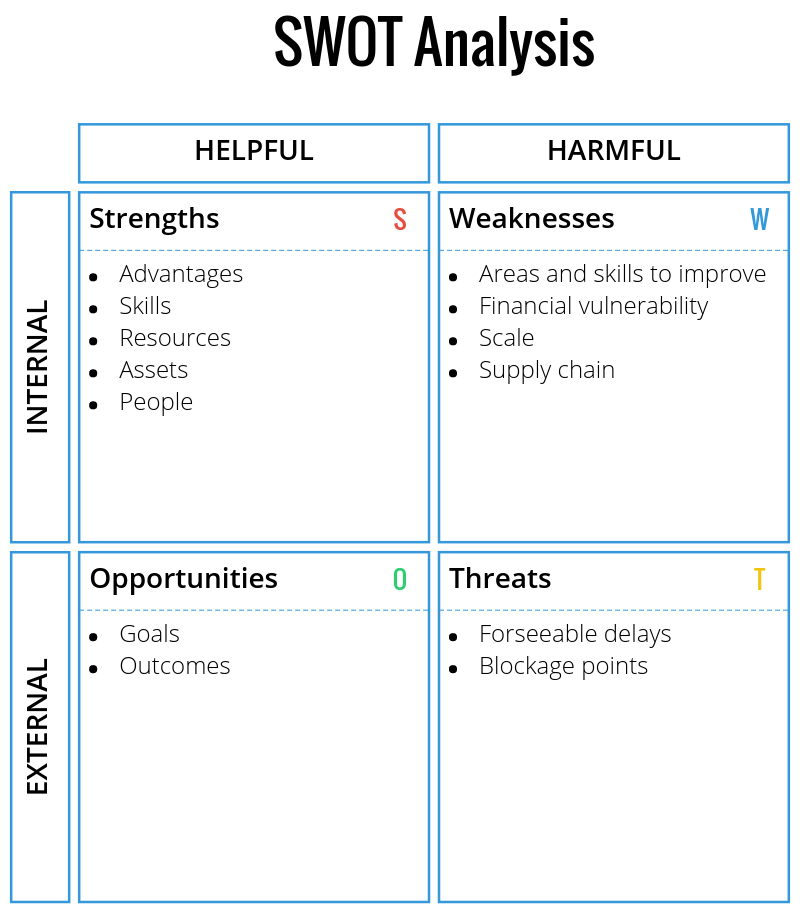
Having an awareness of the SWOT analysis for your project — strengths and resources, weak spots you’ll need to address to get the job done, potential threats and opportunities/outcomes — can help you clarify exactly how you’re going to approach this project and what the underlying aims are. Condense this into the most succinct sentence possible, that anyone could understand (no jargon!).
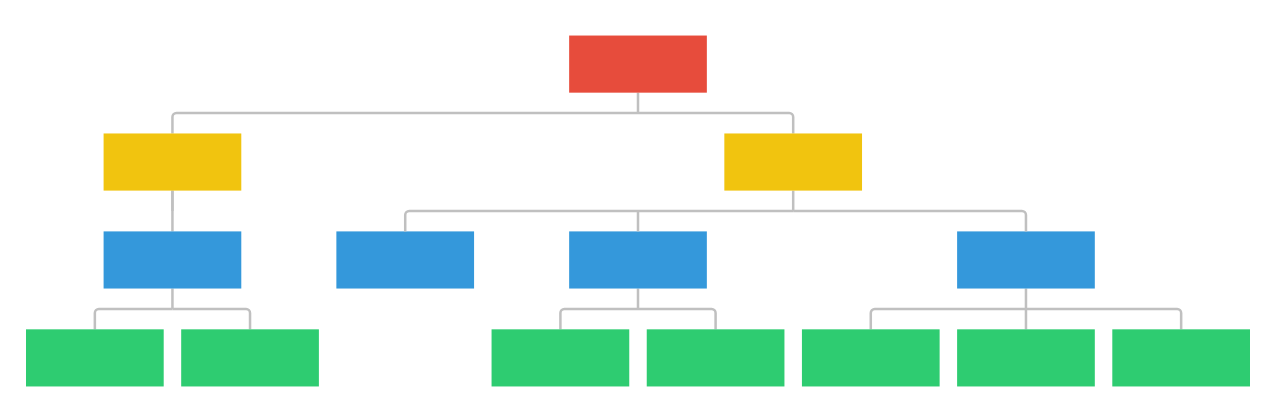
2. How can you break that down into smaller chunks?
Now that you have such a depth of understanding of the project ahead, it’s time to break it down into bitesize, actionable chunks. I find it easiest to use an Organizational Chart for this process, as you can update and re-format easily if you remember another aspect at the last minute (especially if you use live updating in the Vizzlo for PowerPoint add-in). Adding new branches as you go, it’s easy to visualize every area of the project split into individual tasks.
3. Who/what processes are responsible for actioning those tasks?
Assigning responsibility for each task in a visual overview keeps everyone abreast of their workload, avoids potential overloading of some key staff members, and enables the team to support each other more easily in crunch time. You can easily add names to the labels of you Org Chart. When a task has to go through several different employees blockages can occur — so aim to streamline this process by having as few people involved as possible, and give responsibility of the completed and released task to one staff member only.
4. How long will these (realistically) take?
Before you start building your timeline and setting deadlines for tasks, it’s a smart idea to remove dates from your thinking and focus on the time involved in each process. Jumping straight into a calendar view might mean you underestimate the resources involved and create deadlines you’ll never meet.
5. Where are your milestones? Spot potential blockages!
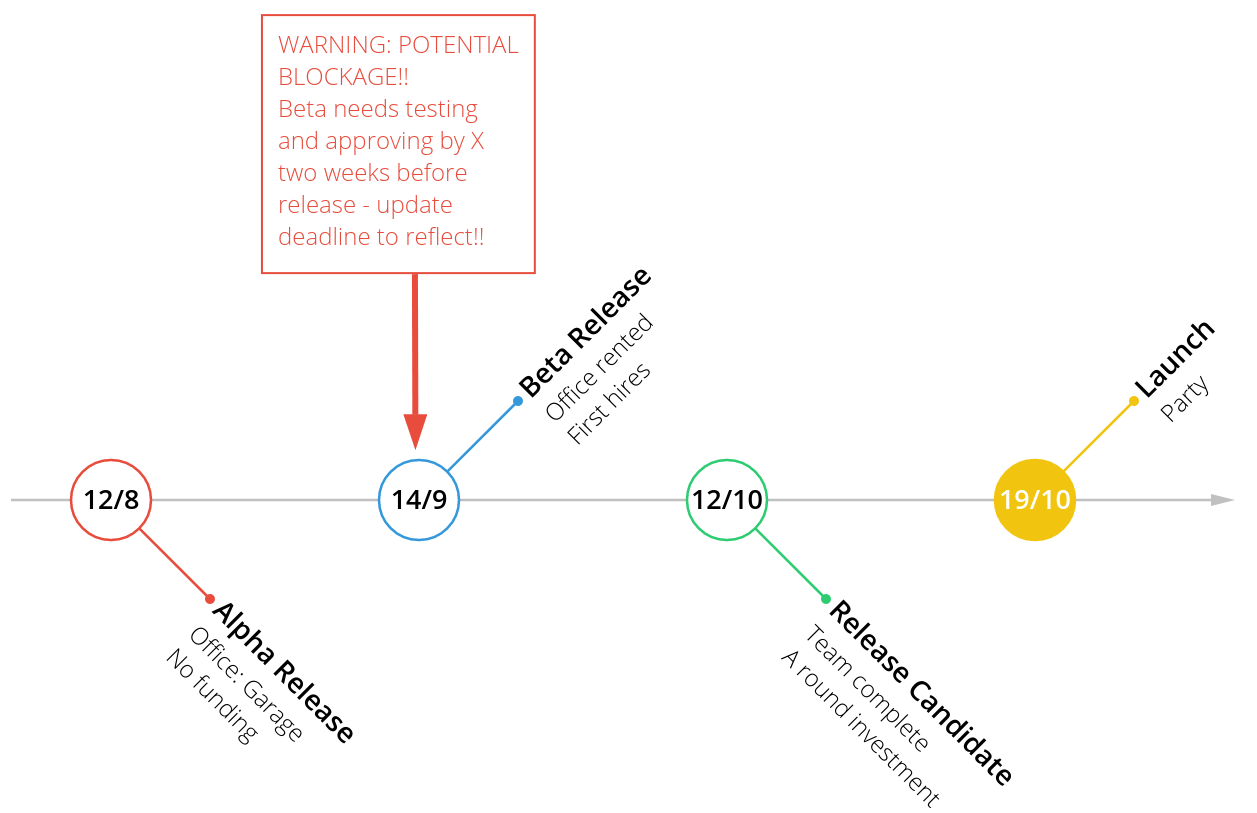
Now that you know your release date and estimated task durations, you can work backwards to find milestone dates for your project. These are key task completion or release dates, at which point you can check in with your team to ensure every step of the process is on schedule. I find the Vizzlo Fishbone Timeline really easy to use for this, as the slanted labels make it possible to fill in a lot of detailed information into tight spaces — there’s also a feature to automatically merge coinciding milestones, so you can just input dates and tasks from an Excel or Sheet and instantly simplify this for your timeline.
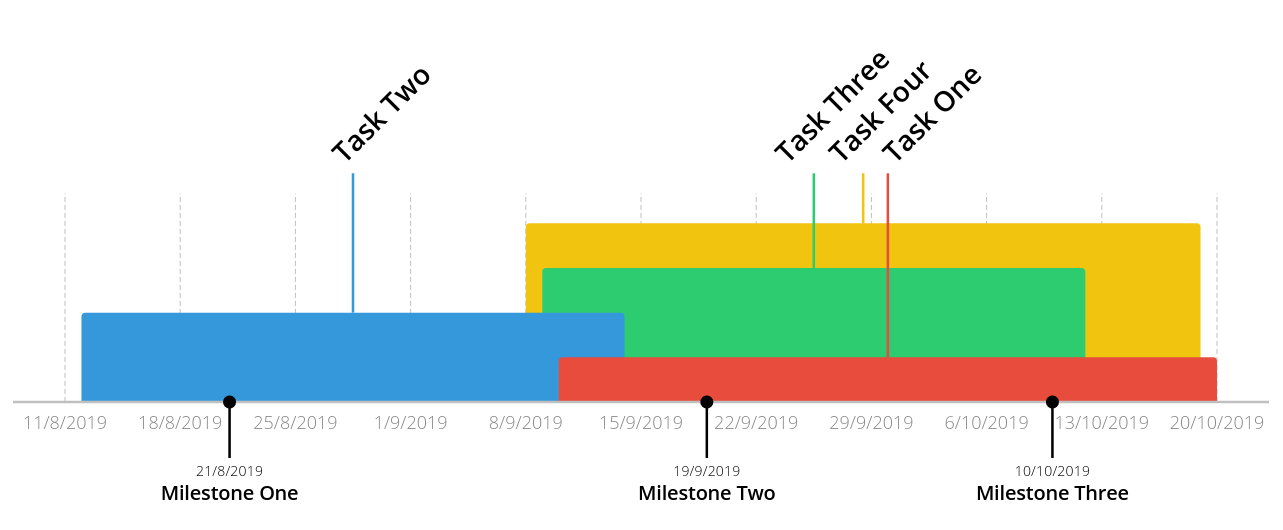
You may find that some of your project tasks can be worked on at the same time; one way to ascertain key crunch-dates is to use a Layered Timeline. Add in all your tasks and look for overlap of task completion dates — visualizing this will ensure you and your team are aware of which periods will need a ramp up in production.
6. How can you make this easy to understand?
The key here is to keep your overall milestone timeline as simplistic and linear as possible. The more detailed task lists above will definitely make day-to-day task planning run smoothly, but this level of complexity could be overwhelming for your team when visualizing the entire project run, and inaccessible for clients or investors that aren’t a part of the daily mechanics of your company. I favour a clean looking Timeline Chart at this point.
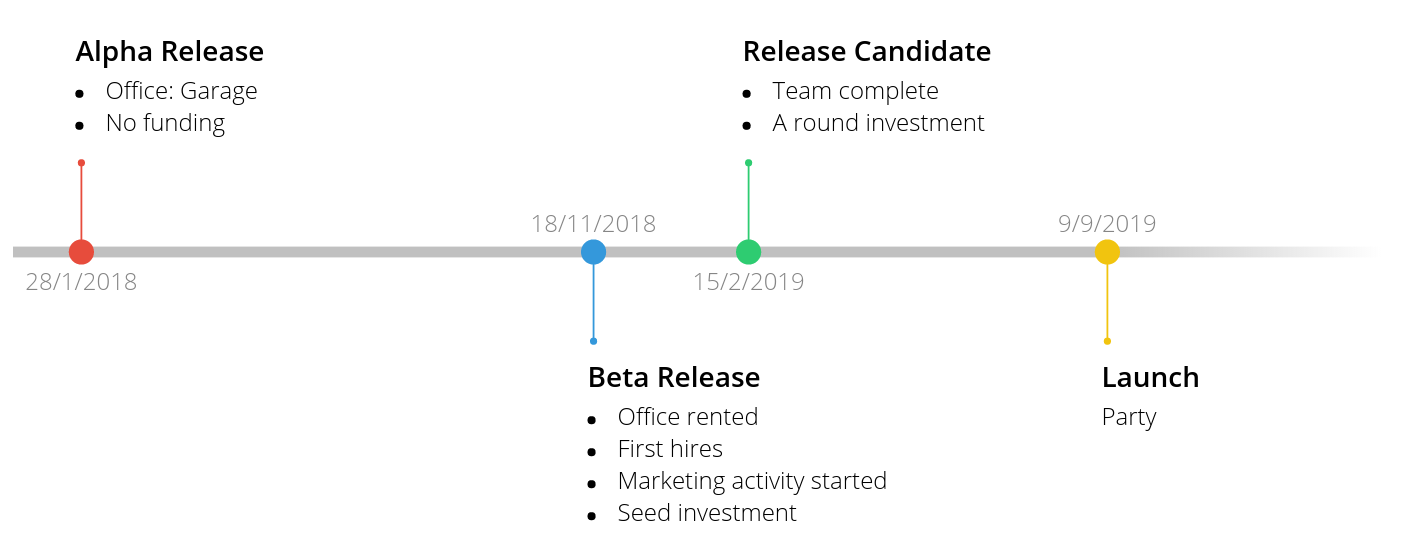
Entering the dates you need (customizable by day, week, month, quarter or year depending on how high-level your project planning needs to be) on Vizzlo’s Timeline Chart automatically spaces them accurately by date — so you can instantly see if there are any milestones too close together, or any long spaces of time without a check-in point. I find this feature incredibly useful, but if for whatever reason this doesn’t work for you, there are options to change the positioning manually or automatically space milestones evenly. You can utilise this feature anywhere in the world — as a European, I can’t tell you how many times I’ve got the wrong date for a meeting with a tool that only uses US date formatting — but Vizzlo’s Timeline date formats are entirely customizable, which prevents a lot of confusion.
You may think the information is the only important feature of your project timeline, but that’s not the case. Did you know that a better looking visualization in 30x more likely to be read than plain text? Customizing colours, fonts and themes will encourage your team to pay attention to deadlines and keep on task!
This might seem like a mammoth amount of planning to do but once you get into the habit, each step of the process becomes incredibly quick — especially with a fast and easy-to-use tool. From my experience, I can say without a doubt I’ve saved endless re-works, stumbling points and a whole lot of time in the long run. If you fail to plan then you plan to fail: it’s a cliche for a reason!