Chart Vizzard
Vizzlo's AI-based chart generatorLayered Timeline
Make an attractive timeline to visualize overlapping and concurrent processes with ease.
What is a layered timeline?
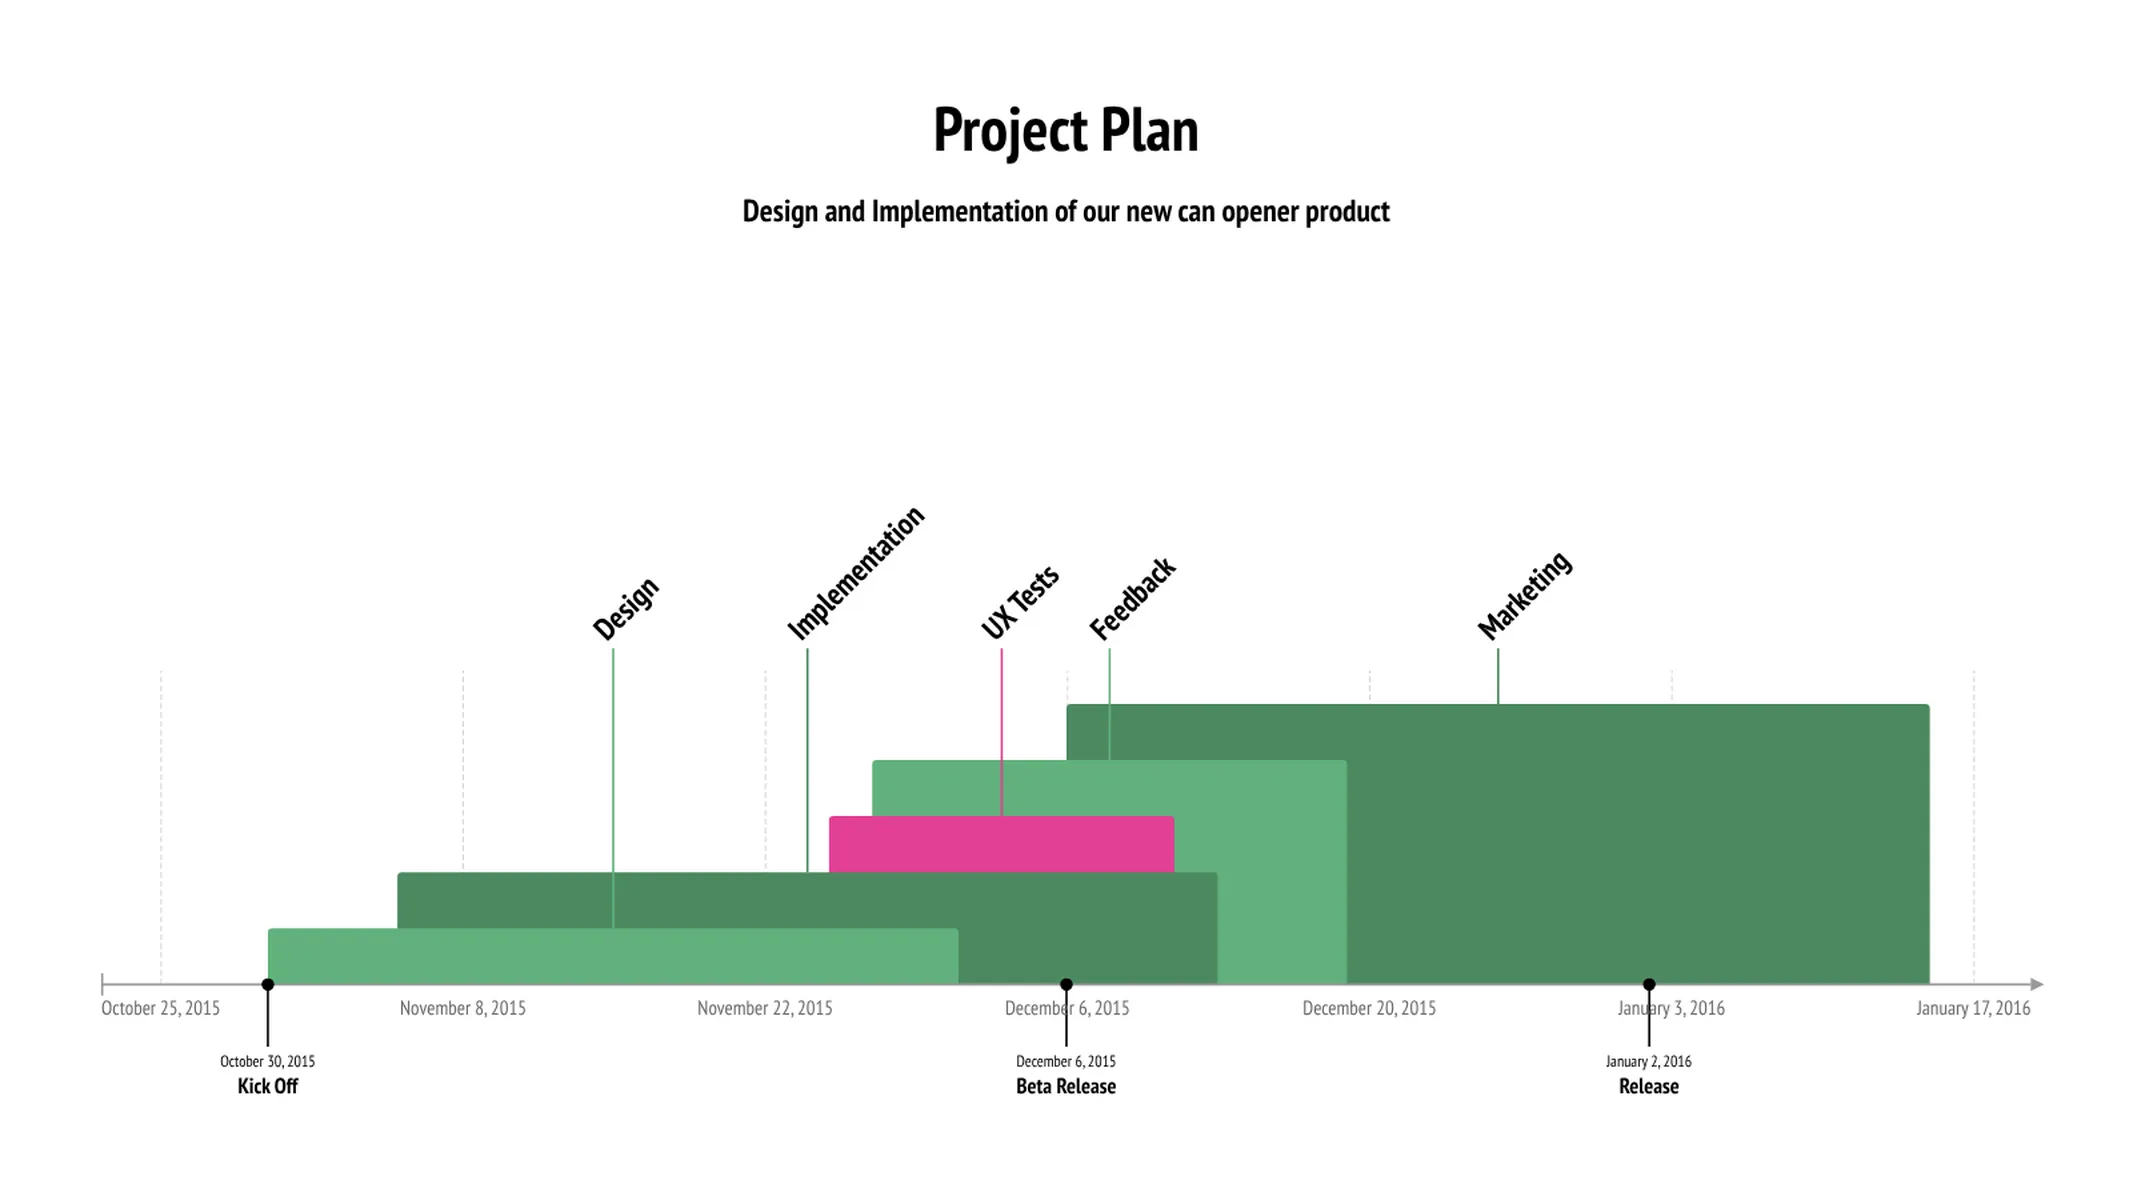
A layered timeline is a graphical visualization of time periods that might or not overlap. Compared to a standard timeline that shows pinpointed single events, the layered timeline accurately expresses the duration/length of whole processes or events. Like in a Gantt chart, each bar/layer represents one process/task, with a start and an end date.
Vizzlo’s layered timeline is elegant and very intelligible. All elements are easy to identify: even if your tasks/processes happen at the same time, they get organized into visible overlapping layers, with different colors and sizes.
How to make a layered timeline with Vizzlo?
Use this designer-grade timeline to illustrate processes or project tasks and milestones in a matter of minutes! Follow these easy steps to create your chart online:
- Click on any layer to directly edit it. You can also use the active card on the sidebar as a support to enter your data.
- Pull the sides to adjust the length/duration of your processes.
- Grab the dotted handles on the top of the layers to rearrange them.
- Drag and drop the layers to adjust their position along the time axis.
- Hover the mouse below the time axis to add your milestones.
- Explore the possibilities of the “APPEARANCE” tab to refine the look of your timeline.
Layered timeline: key features
- Custom date formats and colors
- Optional milestones
- Adjustable height
Pro tip: Quickly add a larger amount of data using the spreadsheet. Make sure to match the date formats before you import or paste your data.
Layered Timeline: What's new?
The maximum amount of records is increased to 100.
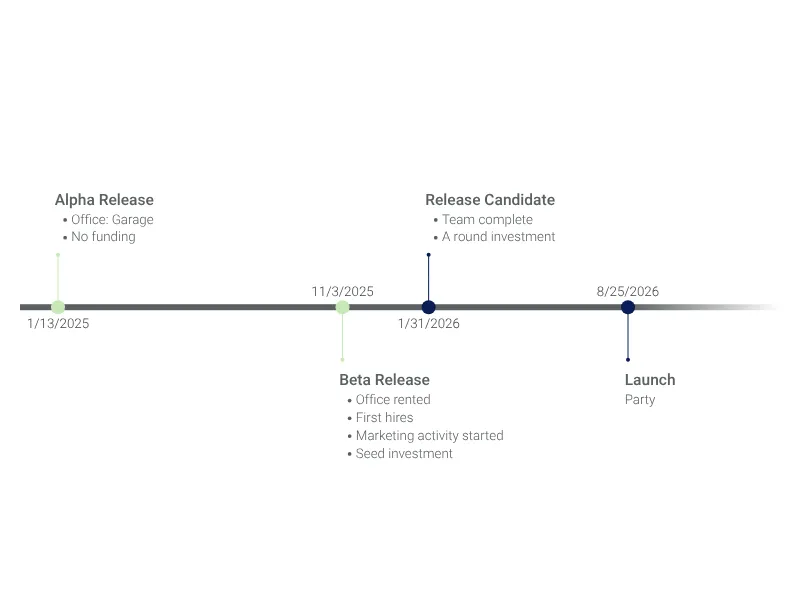
Layered Timeline Alternatives
Enhance your productivity
Create a Layered Timeline directly in the tools you love

Create a Layered Timeline in PowerPoint with
Vizzlo's add-in

Loved by professionals around the world


Visualizations your audience won’t forget
Convey abstract concepts and data with professionally designed
charts and graphics you can easily edit and customize.