Chart Vizzard
Vizzlo's AI-based chart generatorHeatwave

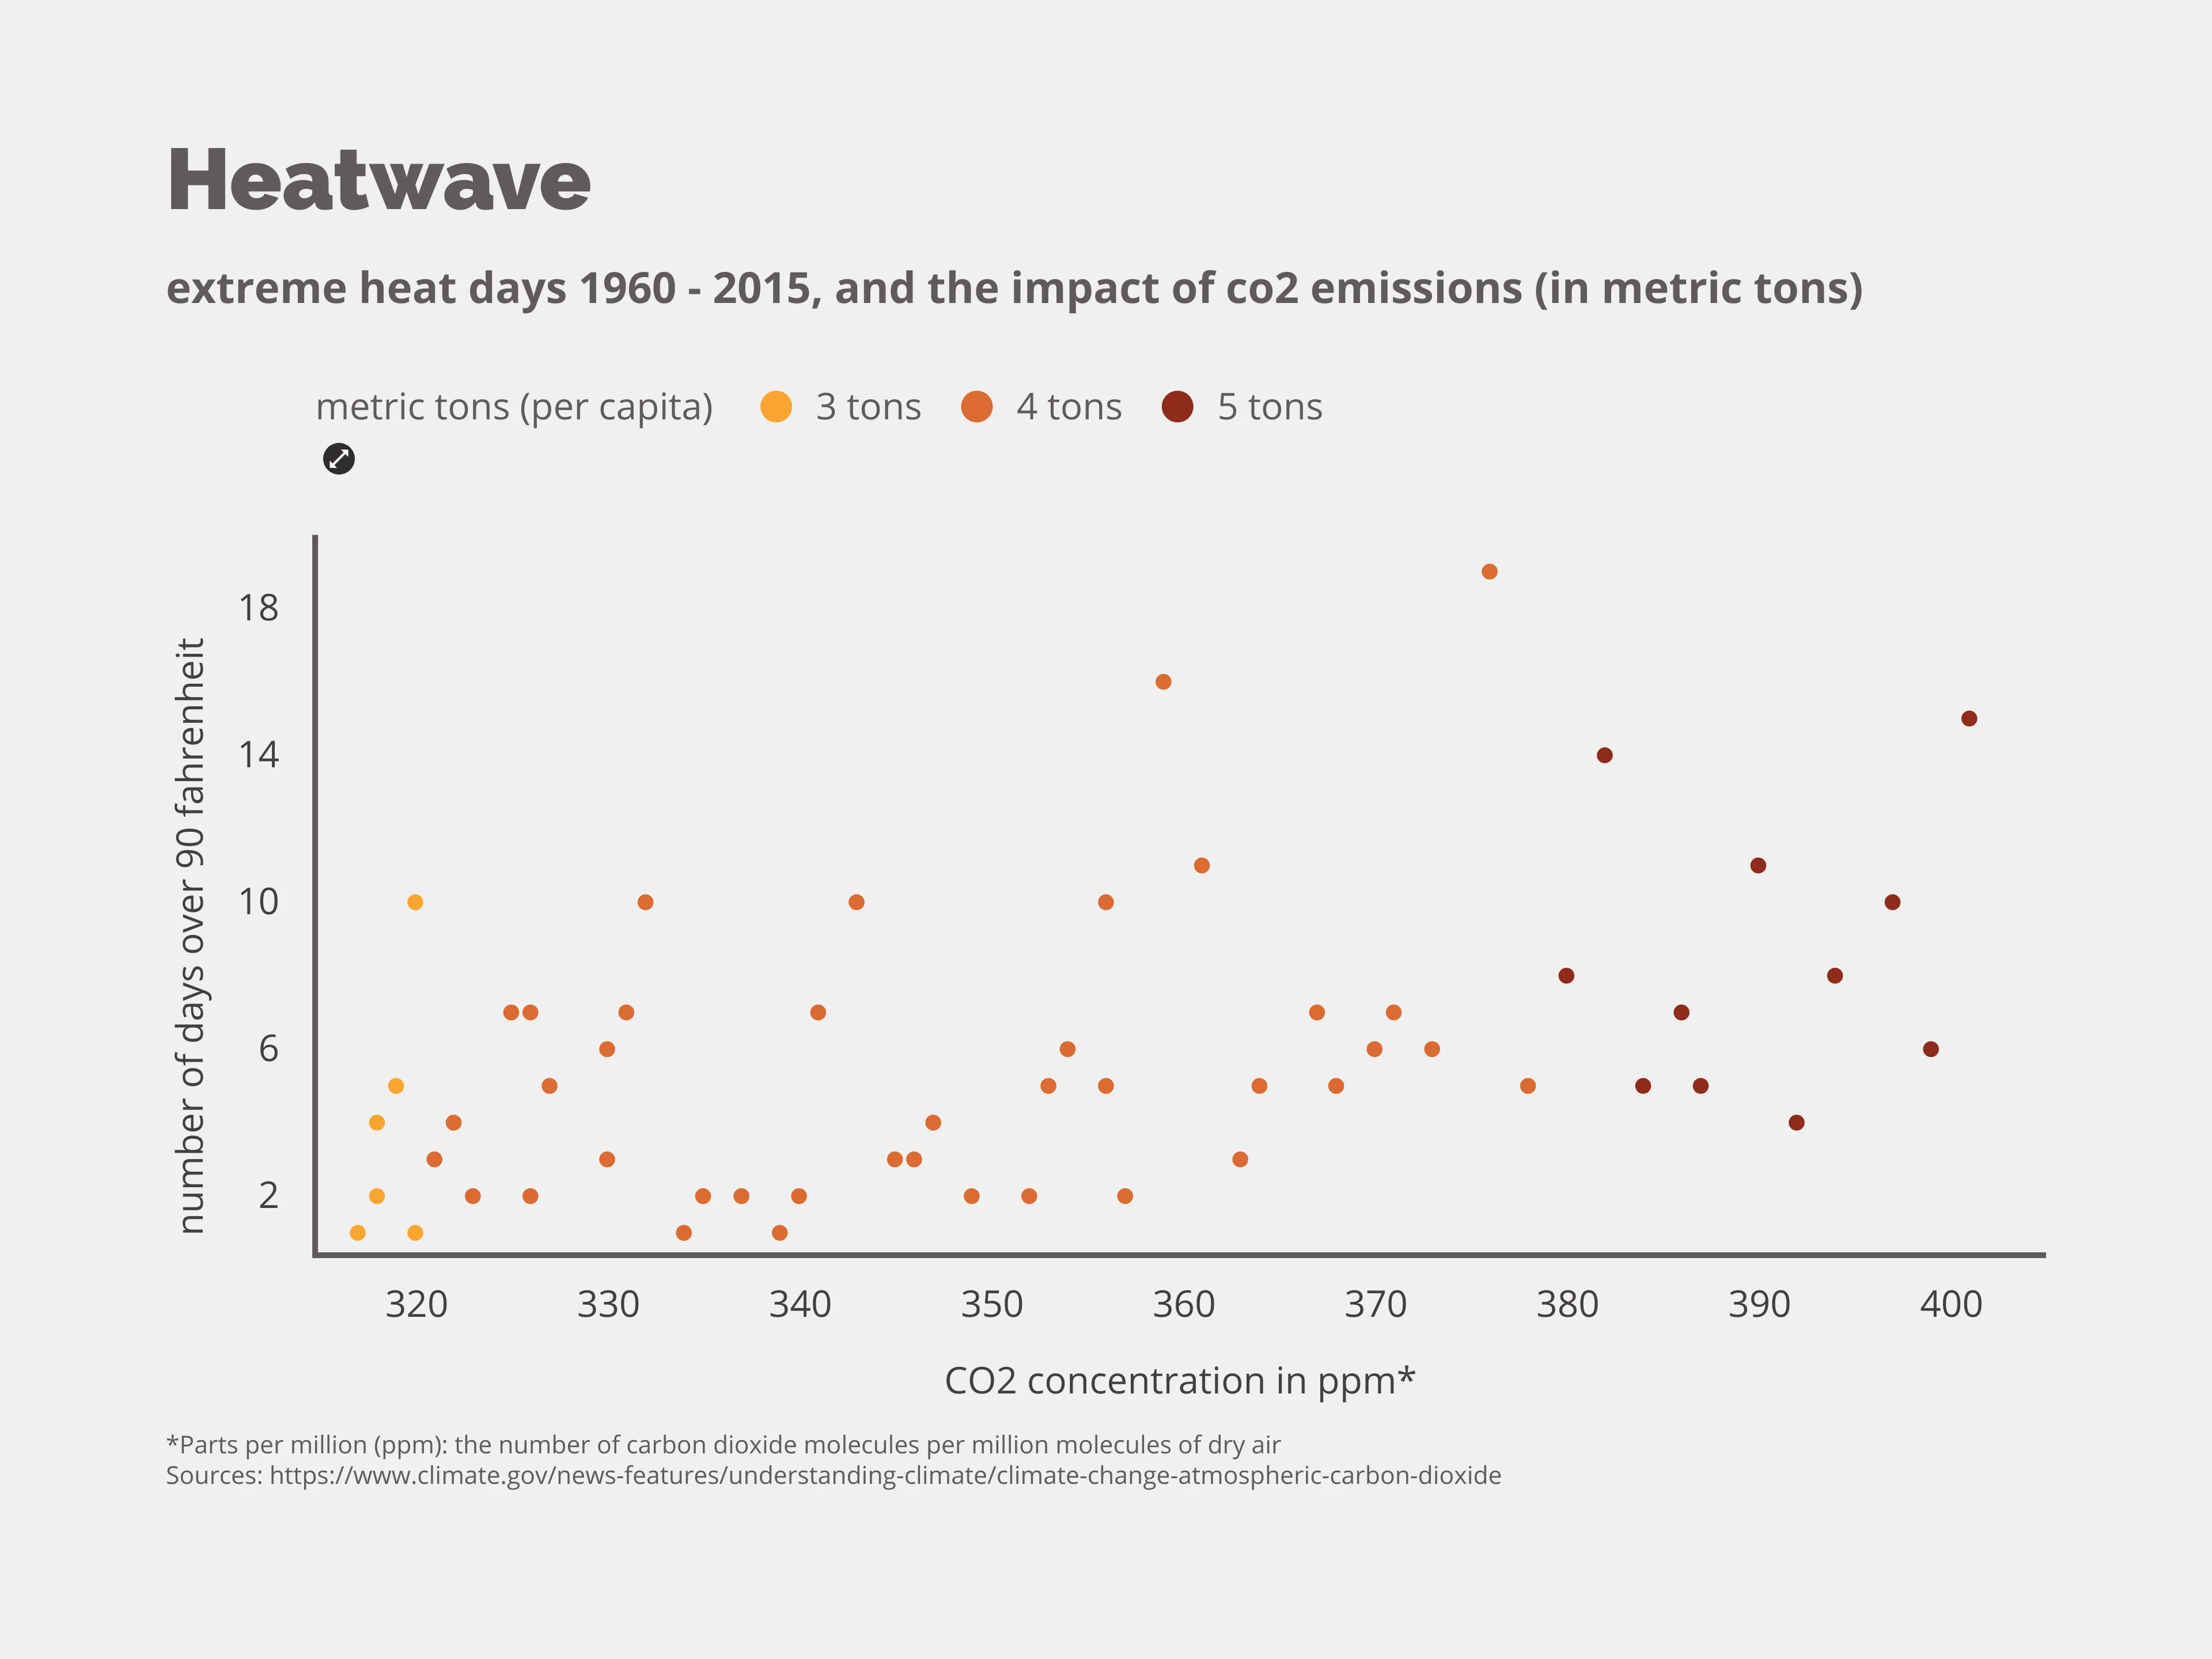
With temperatures over 90 degrees Fahrenheit in Germany and concerns over climate change being the number one topic for some time now, we thought we’d take a look at the amount of heat days over the last fifty years and what might cause them. CO2 is a greenhouse gas, that once released into the atmosphere, blocks heat from leaving our planet into space. We humans produce 1.6 Billion tons of it annually and even though our planet is slowly heating up, the production of CO2 doesn’t seem to slow down any time soon.

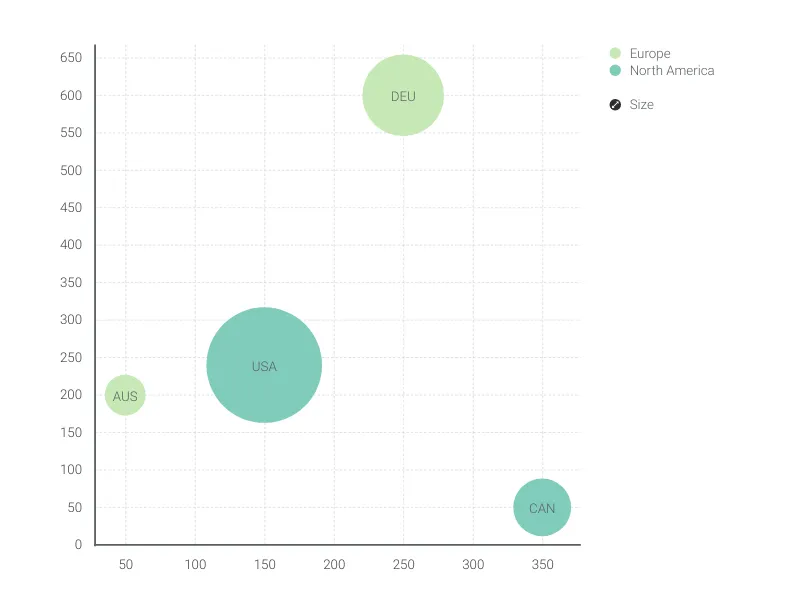
This is an example of Vizzlo's “Bubble Chart”
A multivariable graph for visualizing and comparing up to four dimension of your data.
Finance & Economics Sales & Marketing Scatter plots & Bubble charts