Chart Vizzard
Vizzlo's AI-based chart generatorLargest Global Debt at the End of the Decade
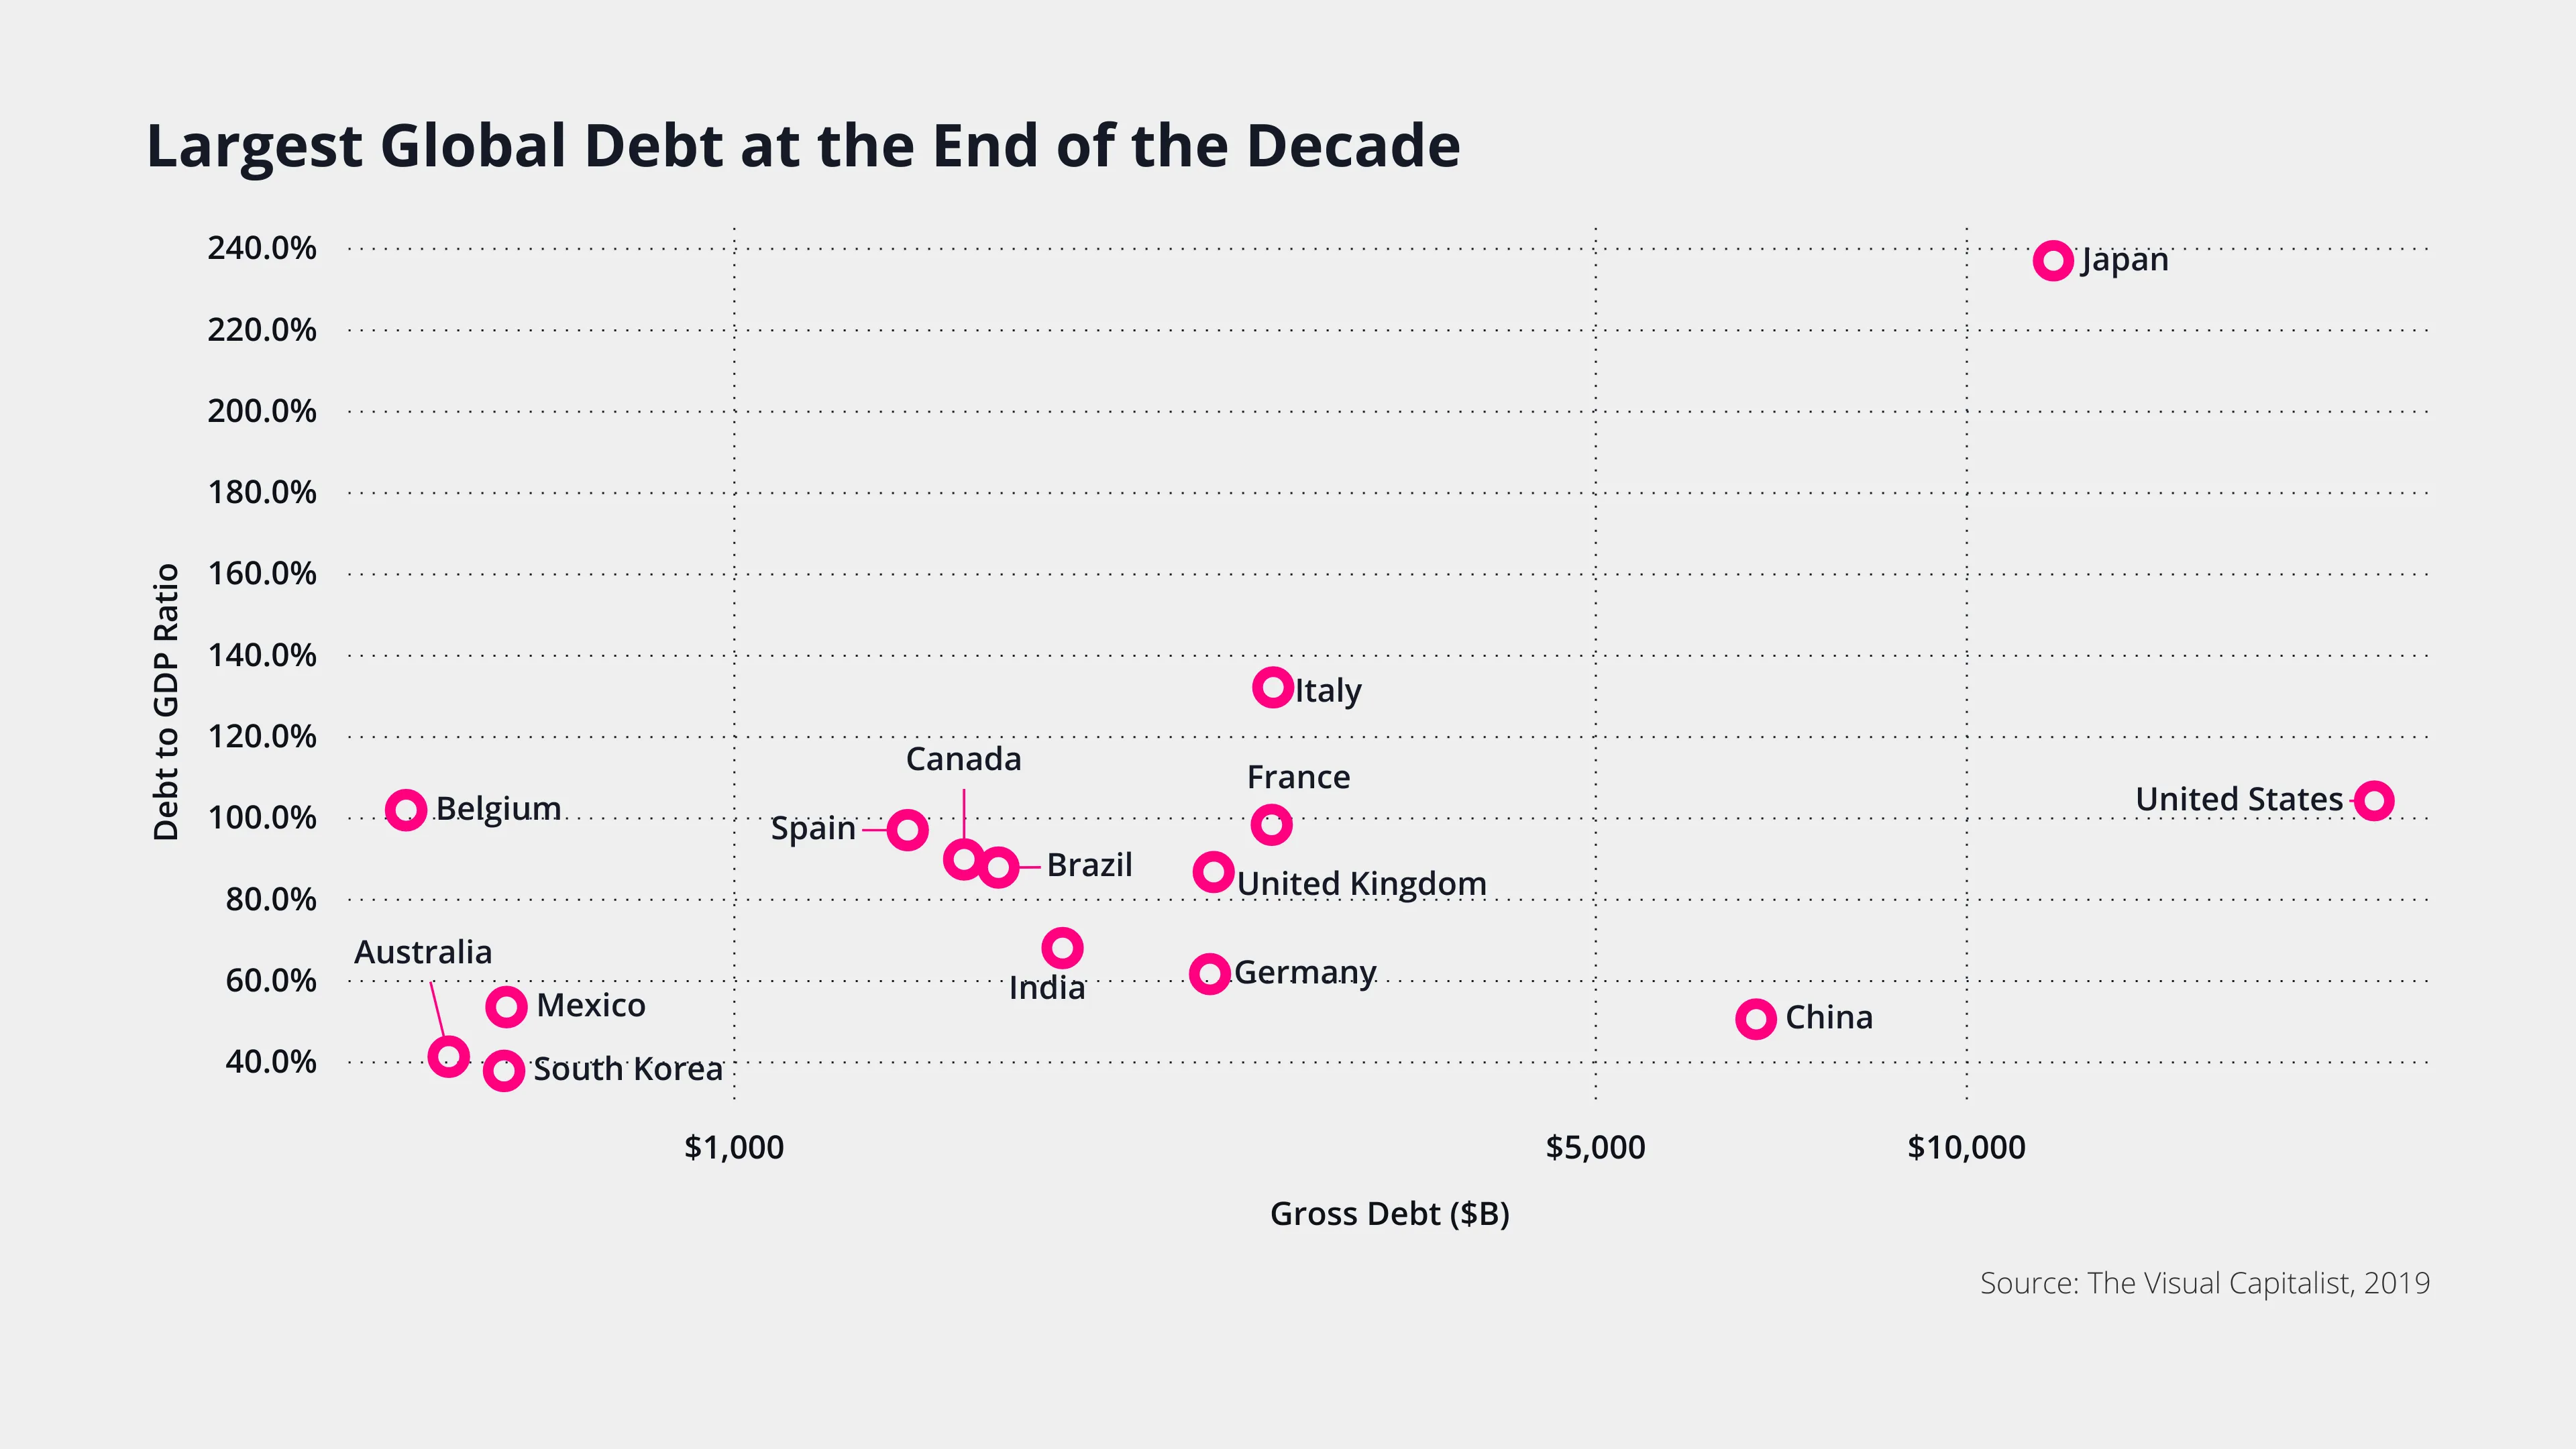
As we come to the end of the 2010’s, it’s time to reflect on the state of global affairs at this milestone point.
Global national debt is at an all-time high at roughly $70trillion (quite a staggering rise from 2018’s $65.7tn), mainly due to a surge in U.S. federal debt.
In fact, America is one of three countries in the top 10 to owe more than its total GDP - talk about living beyond one’s means!
However, the debate between economists rages on as to whether national debt is actually a cause for concern, or a tool to encourage spending and create a strong economy.
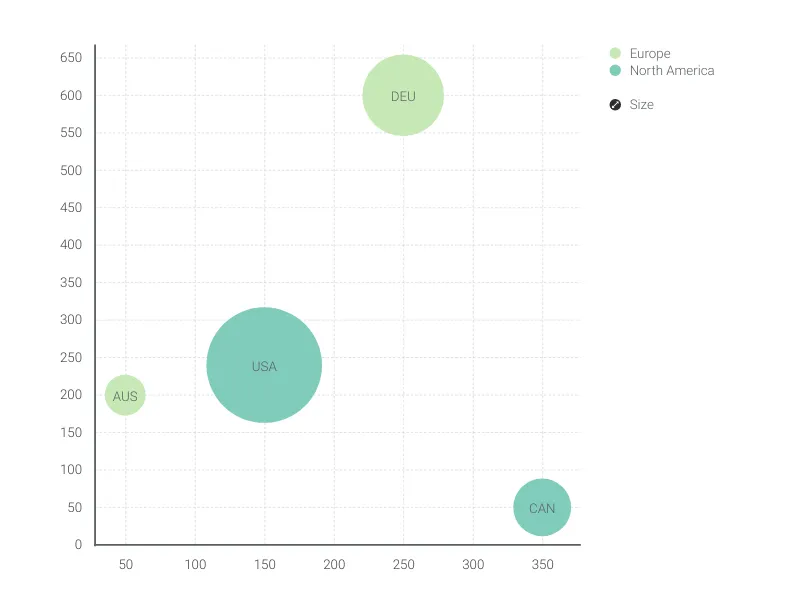
This is an example of Vizzlo's “Bubble Chart”
A multivariable graph for visualizing and comparing up to four dimension of your data.
Finance & Economics Sales & Marketing Scatter plots & Bubble charts