Chart Vizzard
Vizzlo's AI-based chart generatorUS Standard of Living

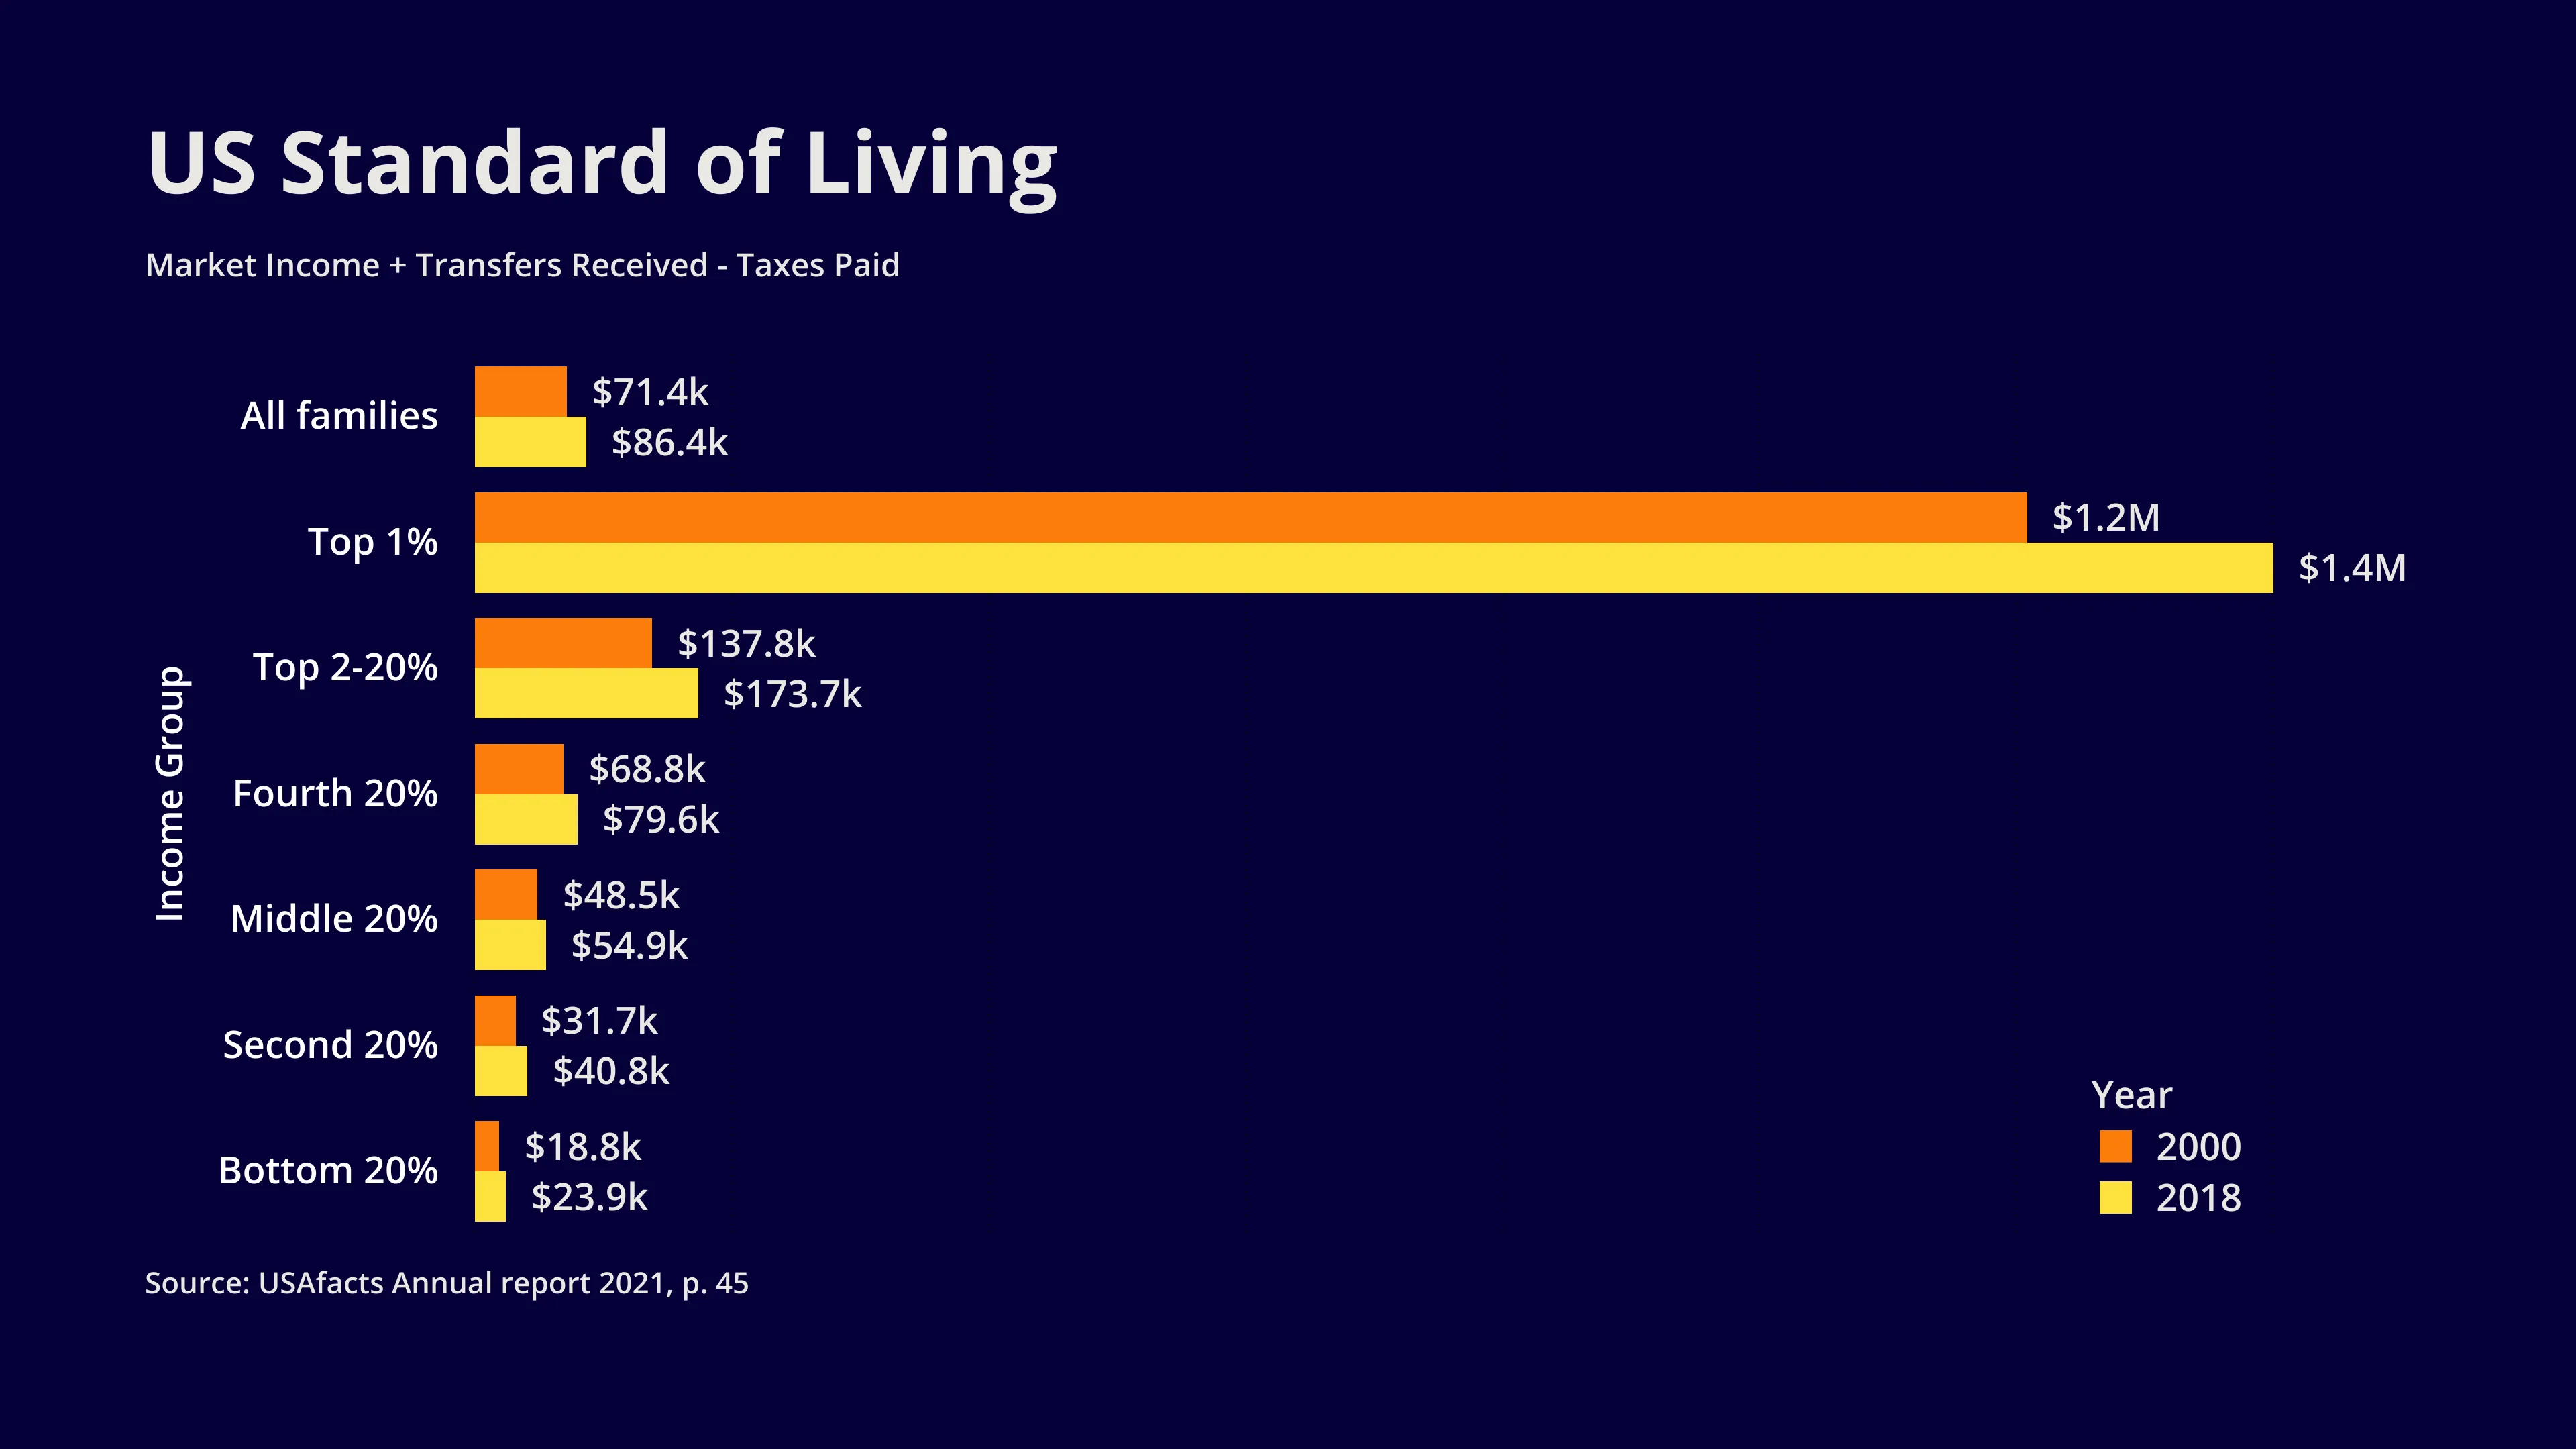
If one measures living standards by disposable income, the average American is better off today than 20 years ago. Although market income has developed differently in the various income groups, tax breaks and transfer payments mean that Americans have more money in their pockets. In absolute terms, the richest 1% of the population has seen the greatest increase in income, whereas in relative terms it is the second 20% - if you add up market income and transfer payments and subtract the tax burden.
Note: Market income sources include wages, investments, and retirement. Transfers include cash transfers like unemployment insurance and noncash like Medicaid. Taxes include both direct taxes, such as income and sales taxes, and indirect taxes, like the FICA and unemployment insurance payroll taxes.
Source: USAfacts Annual Report 2021

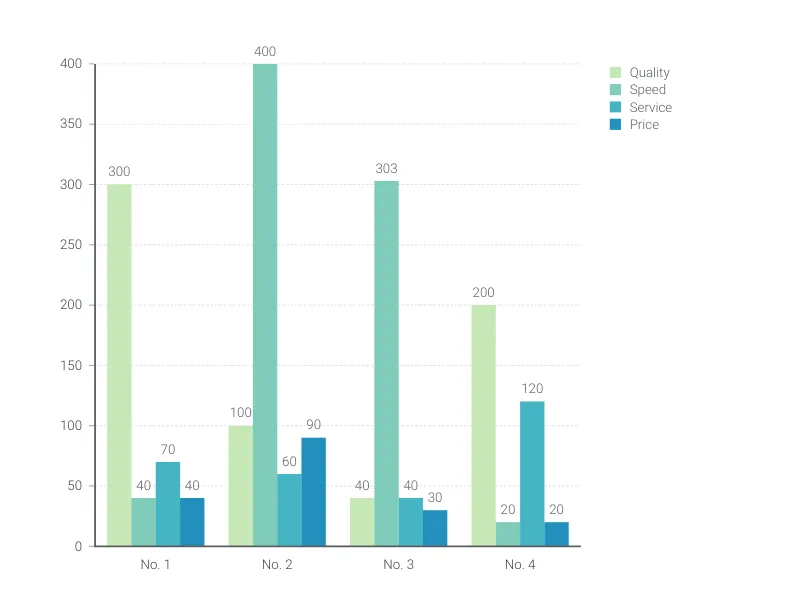
This is an example of Vizzlo's “Grouped Bar Chart”
Use a grouped bar chart to compare the same categories within different groups.