Chart Vizzard
Vizzlo's AI-based chart generator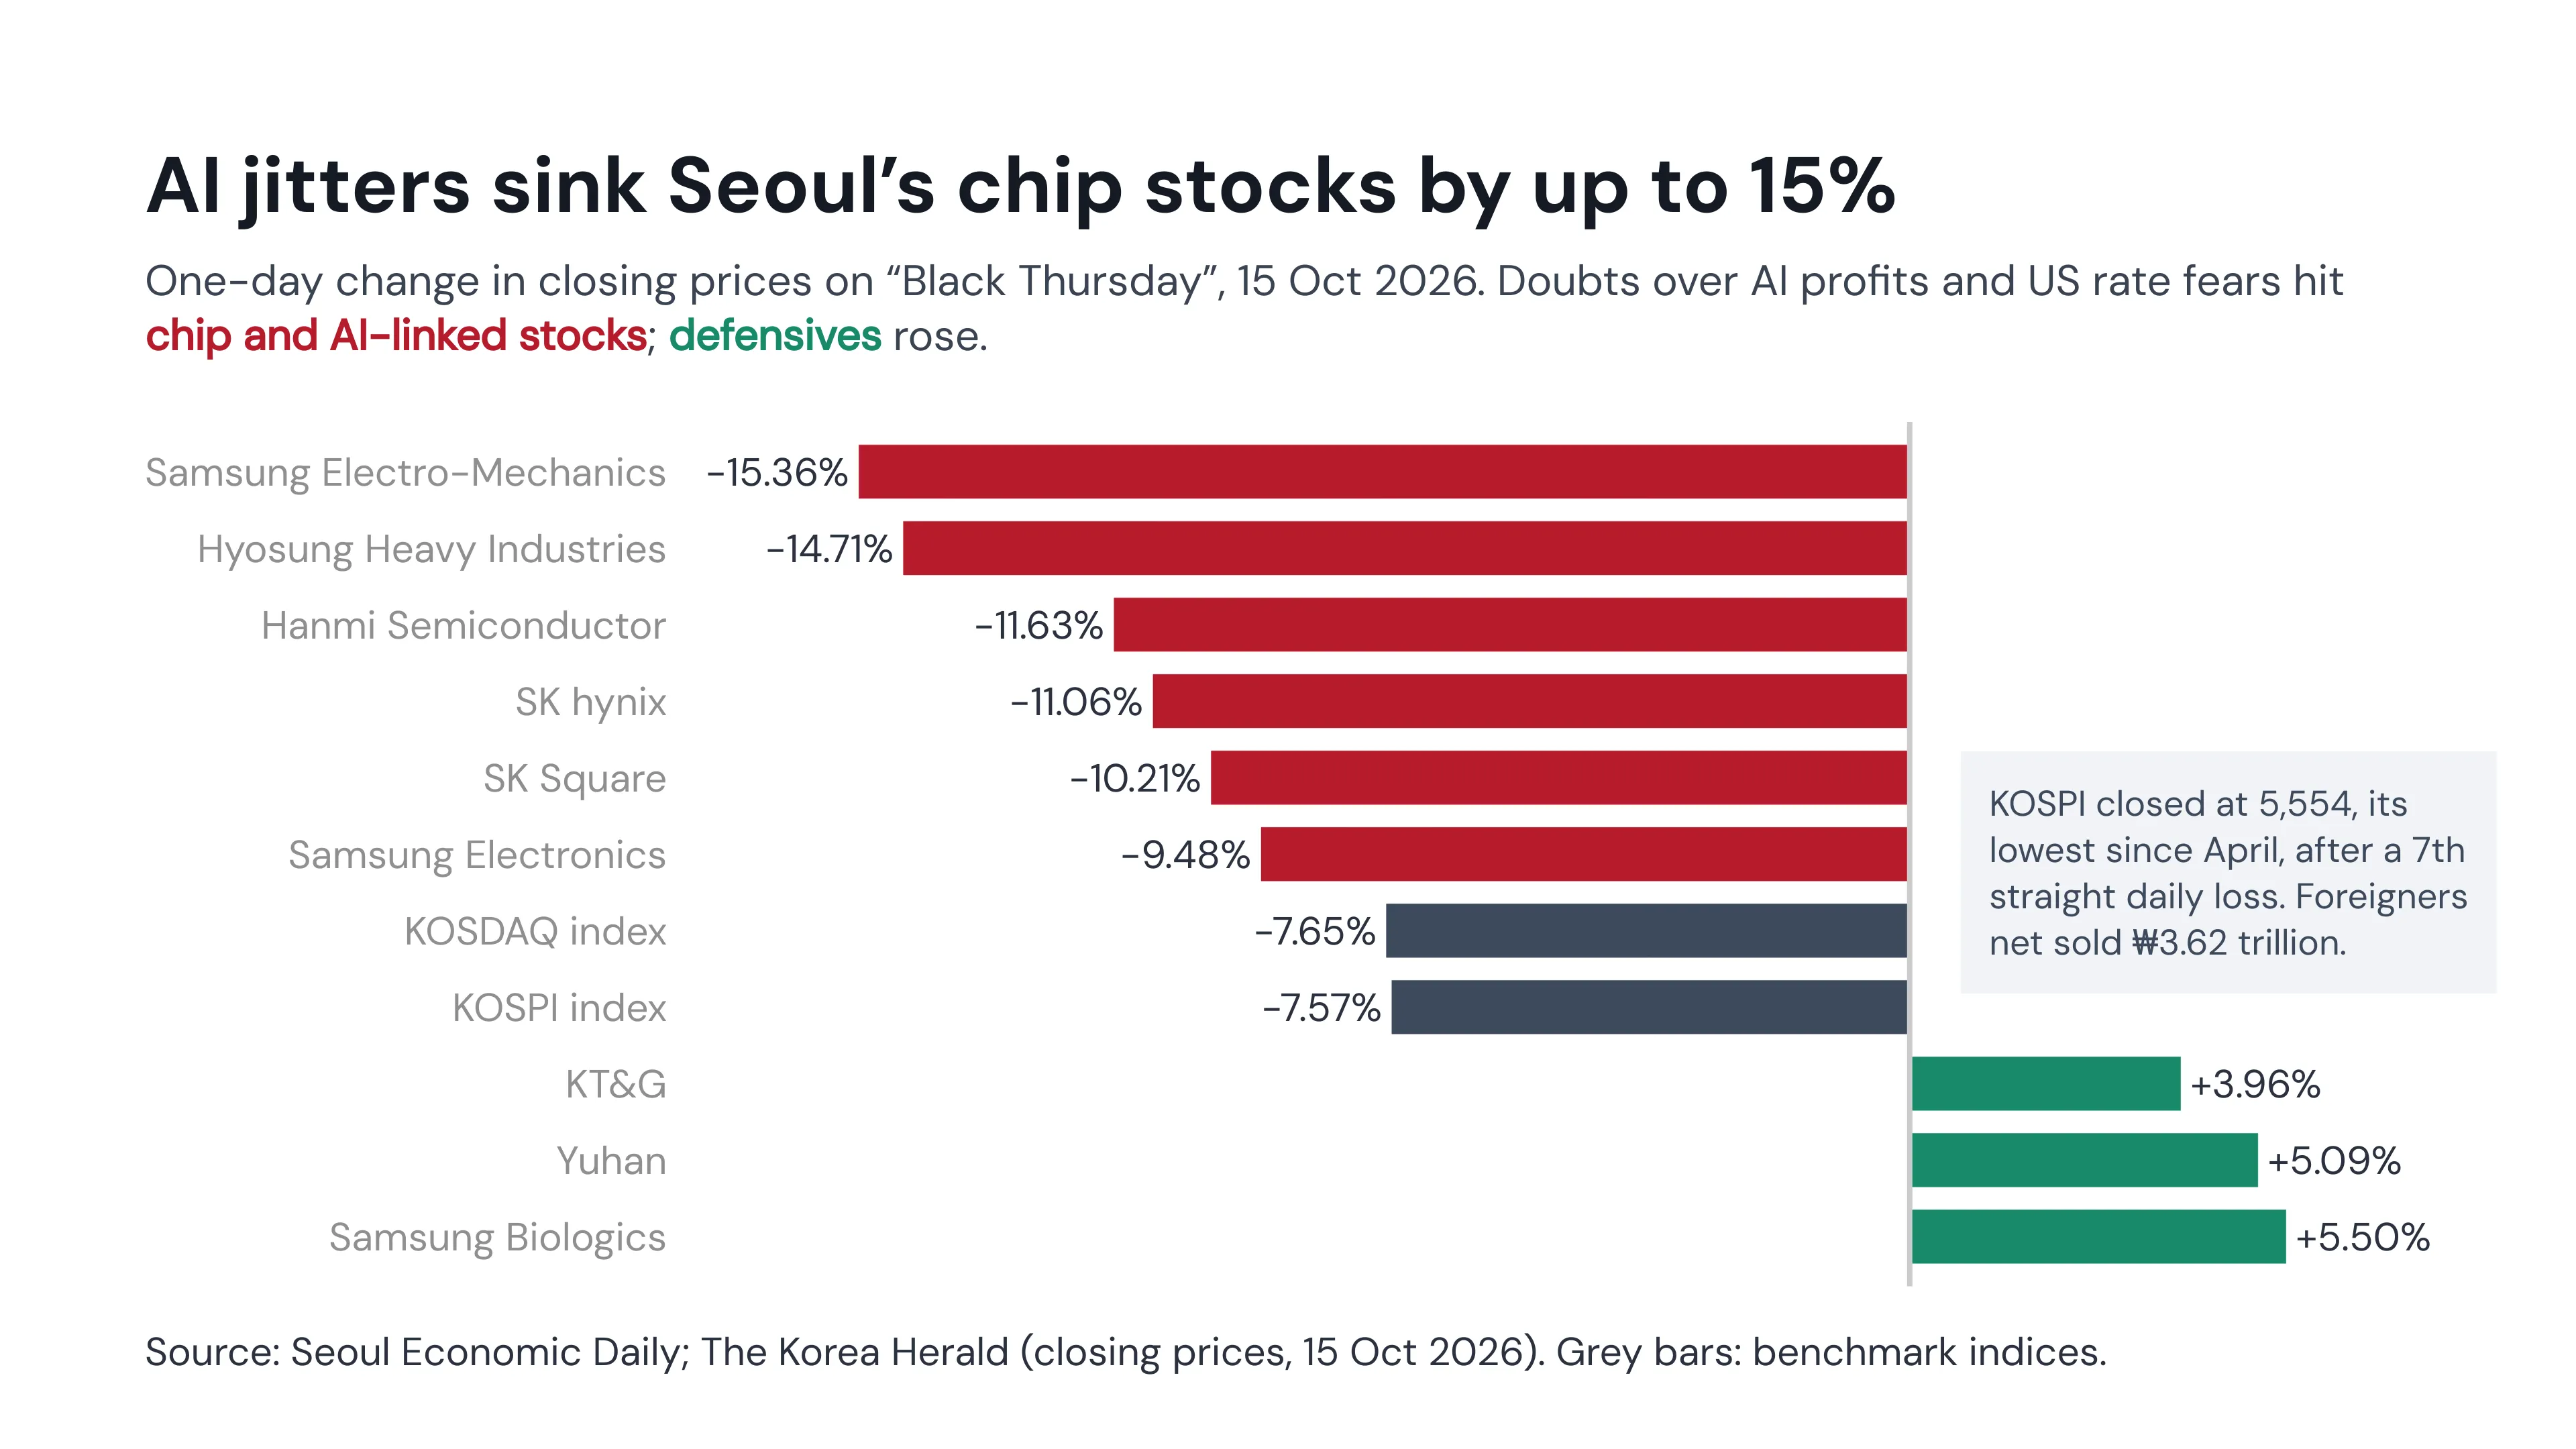
AI jitters sink Seoul’s chip stocks by up to 15%
South Korea’s stock market suffered a “Black Thursday” on 15 October 2026. The benchmark KOSPI fell 454.59 points, or 7.57%, to 5,554.22, its lowest close since April and its seventh straight daily loss, while the tech-heavy KOSDAQ dropped 7.65% to 760.82, according to the Seoul Economic Daily and The Korea Herald. Chip and AI-linked stocks took the worst of it: Samsung Electro-Mechanics lost 15.36%, SK hynix 11.06% and Samsung Electronics 9.48%. Both markets hit circuit breakers that halted trading for 20 minutes. The KOSPI had fallen more than 9% at its intraday low of 5,450.81 before it recovered slightly.
Why chipmakers led the rout
The sell-off was driven by fresh doubts about whether the AI infrastructure boom will pay off, combined with a US rate scare:
- AI financing worries: bonds of the US AI cloud provider CoreWeave fell into distressed territory, with yields near 15%, and a Gartner report warned about the survival of “neocloud” AI providers (Seoul Economic Daily, Bloomingbit).
- US rate fears: US consumer prices rose 0.6% in September from August, the fastest monthly increase since April, and 3.7% from a year earlier. That revived bets that the Federal Reserve could raise rates again (The Korea Herald).
- Memory competition: China’s ChangXin Memory Technologies said it had commercialized a new memory architecture (Seoul Economic Daily).
Investors fled to defensive stocks such as pharma and tobacco. Foreigners sold heavily while local investors bought the dip.
| Stock / index | Group | Close, 15 Oct 2026 | Change |
|---|---|---|---|
| Samsung Electro-Mechanics | Chip & AI-linked | ₩1.16 million | −15.36% |
| Hyosung Heavy Industries | Chip & AI-linked | – | −14.71% |
| Hanmi Semiconductor | Chip & AI-linked | – | −11.63% |
| SK hynix | Chip & AI-linked | ₩1,262,000 | −11.06% |
| SK Square | Chip & AI-linked | ₩765,000 | −10.21% |
| Samsung Electronics | Chip & AI-linked | ₩210,000 | −9.48% |
| KOSDAQ | Index | 760.82 | −7.65% |
| KOSPI | Index | 5,554.22 | −7.57% |
| KT&G | Defensive | – | +3.96% |
| Yuhan | Defensive | – | +5.09% |
| Samsung Biologics | Defensive | – | +5.50% |
| KOSPI flows, 15 Oct 2026 | Net (₩ trillion) |
|---|---|
| Foreign investors | −3.62 (net sold) |
| Institutions | +1.69 (net bought) |
| Individuals | +1.29 (net bought) |
Source for both tables: Seoul Economic Daily and The Korea Herald.
What it means
Korea’s market is heavily exposed to the AI memory-chip cycle, with Samsung Electronics and SK hynix as its two heavyweights. Only a week earlier, Samsung had guided to a record quarterly operating profit of about ₩107 trillion (see our 8 Oct chart). Thursday’s crash shows that markets now worry less about current earnings and more about whether AI spending can be financed and sustained. According to Bloomingbit, the seven-session slide erased about ₩1,193.5 trillion (20.67%) of KOSPI market value.
The selling spread across Asia. Japan’s Nikkei 225 fell 4.90% to 64,425.90 on the same day, and Kioxia and SoftBank Group lost more than 9% each (TradingKey). Korean shares bounced back on Friday, 16 October: Reuters reported a 2.5% rebound during the session (Reuters via The Star), and the Rio Times puts the close at 5,668.05 (+2.1%). Next to watch is the Bank of Korea’s rate decision on 22 October (Seoul time), where a hold at 3% is expected (Rio Times).
How to read the chart
- Each bar shows one stock’s or index’s percentage change in closing price on Thursday, 15 October 2026, compared with the previous close. Bars to the left of the zero line are losses, bars to the right are gains.
- Red bars are chip and AI-linked stocks (chipmakers, chip-parts and chip-equipment makers, power-grid equipment, and SK hynix’s holding company SK Square). Dark grey bars are the two benchmark indices (KOSPI and KOSDAQ). Green bars are defensive stocks that rose (tobacco, pharma, biotech).
- The grey box gives the KOSPI’s closing level and the foreign net selling for the day.
- The small red-and-blue roundel (a simplified taegeuk from South Korea’s flag) marks the country the chart is about.
Sources
- KOSPI Plunges 7.6% to Six-Month Low in ‘Black Thursday’ Selloff: Seoul Economic Daily, 15 Oct 2026 (index closes, all stock moves, investor flows, causes)
- Kospi slides over 7% as chip stocks sink: The Korea Herald, 15 Oct 2026 (index closes, intraday low, Samsung/SK stock moves, flows, circuit breakers, US CPI)
- Japan, South Korea Stocks Slump; Kospi Closes Down 7.57%, Nikkei 225 Falls Nearly 5%: TradingKey, 15 Oct 2026 (Nikkei close, Kioxia, SoftBank)
- Kospi Sinks 7.6%, Wiping Out 1,193.5 Trillion Won in Seven Days: Bloomingbit, 15 Oct 2026 (market value lost, CoreWeave and Gartner context)
- Jakarta stocks plunge 11% as MSCI set to drop Indonesia from indexes: Reuters via The Star, 16 Oct 2026 (Korean rebound on Friday)
- Asia Intelligence Brief, Friday, October 16, 2026: The Rio Times, 16 Oct 2026 (Friday close of the KOSPI, Bank of Korea rate expectations)
Notes
- All changes are one-day changes in closing prices from 14 to 15 October 2026, in percent with two decimals, as reported by the sources. Where Seoul Economic Daily gives 5,554.22 for the KOSPI close, TradingKey gives 5,554.23, a rounding difference.
- The chart shows the heaviest losers and the biggest defensive gainers that the sources name, not a full ranking of all KOSPI stocks. Other large declines on the day may not be shown.
- Closing prices for Hyosung Heavy Industries, Hanmi Semiconductor, KT&G, Yuhan and Samsung Biologics were not reported in the sources, so the table leaves them blank.
- The ₩1,193.5 trillion market-value loss comes from a single source (Bloomingbit) and covers seven sessions, not just Thursday.
- The sources disagree on how far the KOSPI has fallen from its 2026 high: Seoul Economic Daily cites both 26% and 40.4%. Because the peak level could not be verified, it is not shown here.
- Dollar conversions of the foreign net selling differ between sources ($2.5 billion vs. $2.68 billion), so only the won figure is used.
This is an example of Vizzlo's “Horizontal Bar Chart”
A horizontal variant of the classic column chart.