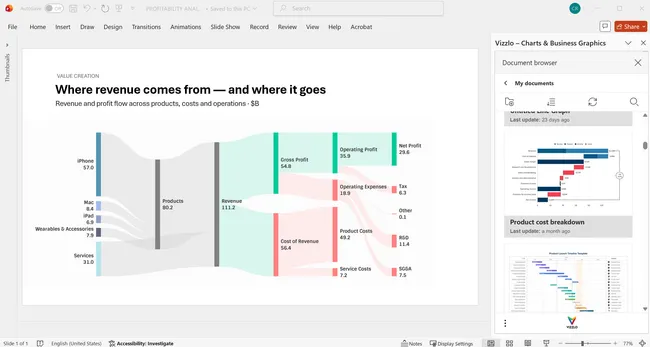







Make complex decisions easier to see
Turn data, priorities and plans into clear, presentation-ready charts.
-
 Create charts faster
-
 Update without rebuilding
-
 Keep presentations consistent
From business information to clear decisions
-
Start with your data
Paste your data or import it from your workflow.
-
Choose the right chart
Start with business data, research or plans.
-
Highlight what matters
Make priorities and trade-offs easy to see.
-
Present
Use charts in PowerPoint or Google Slides.
The right chart for every analysis
Choose from 120+ chart types for reporting, forecasting, and performance analysis
Make priorities easier to see
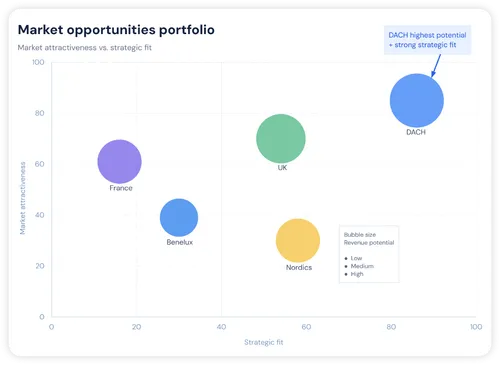
Strategic decisions often require comparing multiple opportunities at once. Vizzlo helps you visualize the trade-offs, so teams can focus on the options that matter most.
- Compare opportunities
- Show trade-offs
- Add context
- Highlight priorities
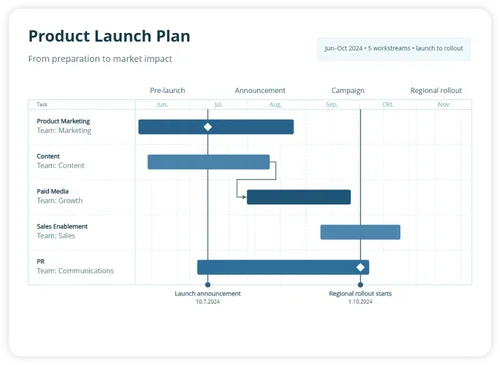
Visualize strategic plans on a clear timeline
Map initiatives, milestones and ownership over time with a clear, easy-to-follow roadmap.
- Plan the rollout
- Align teams
- Track milestones
- Share the plan
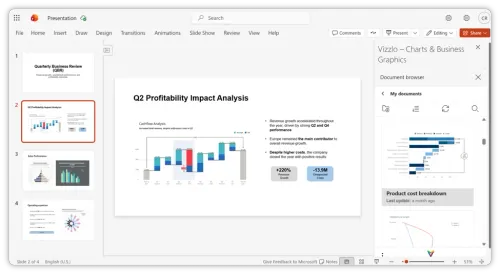
Work where your presentations already happen
Create and edit charts in PowerPoint, Google Slides or your browser — or export them wherever you need.


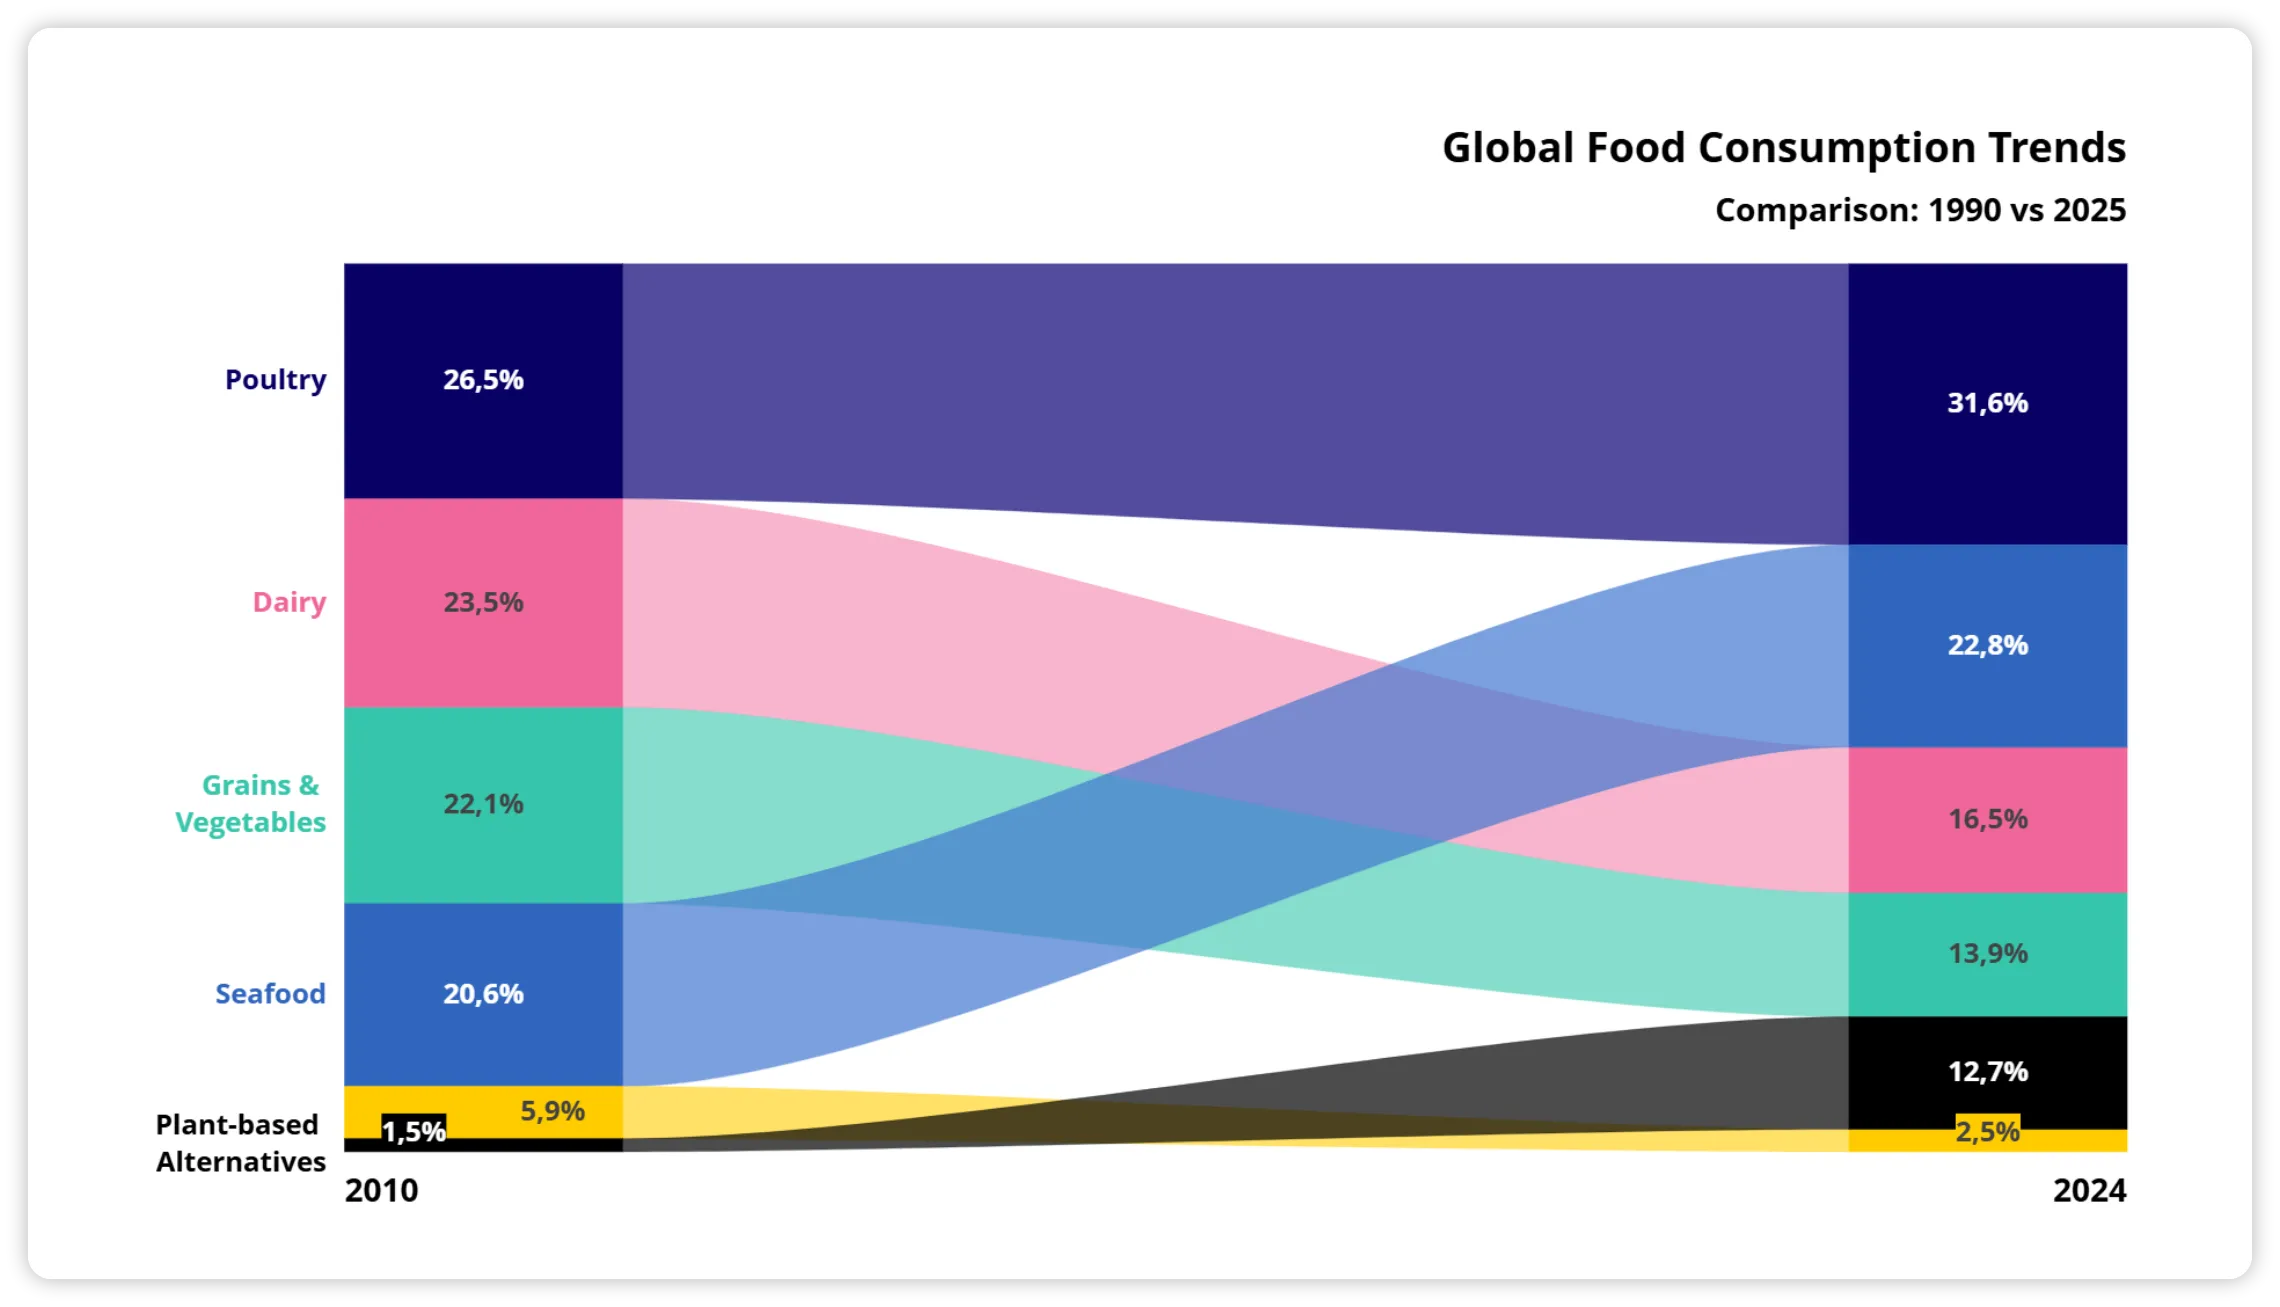
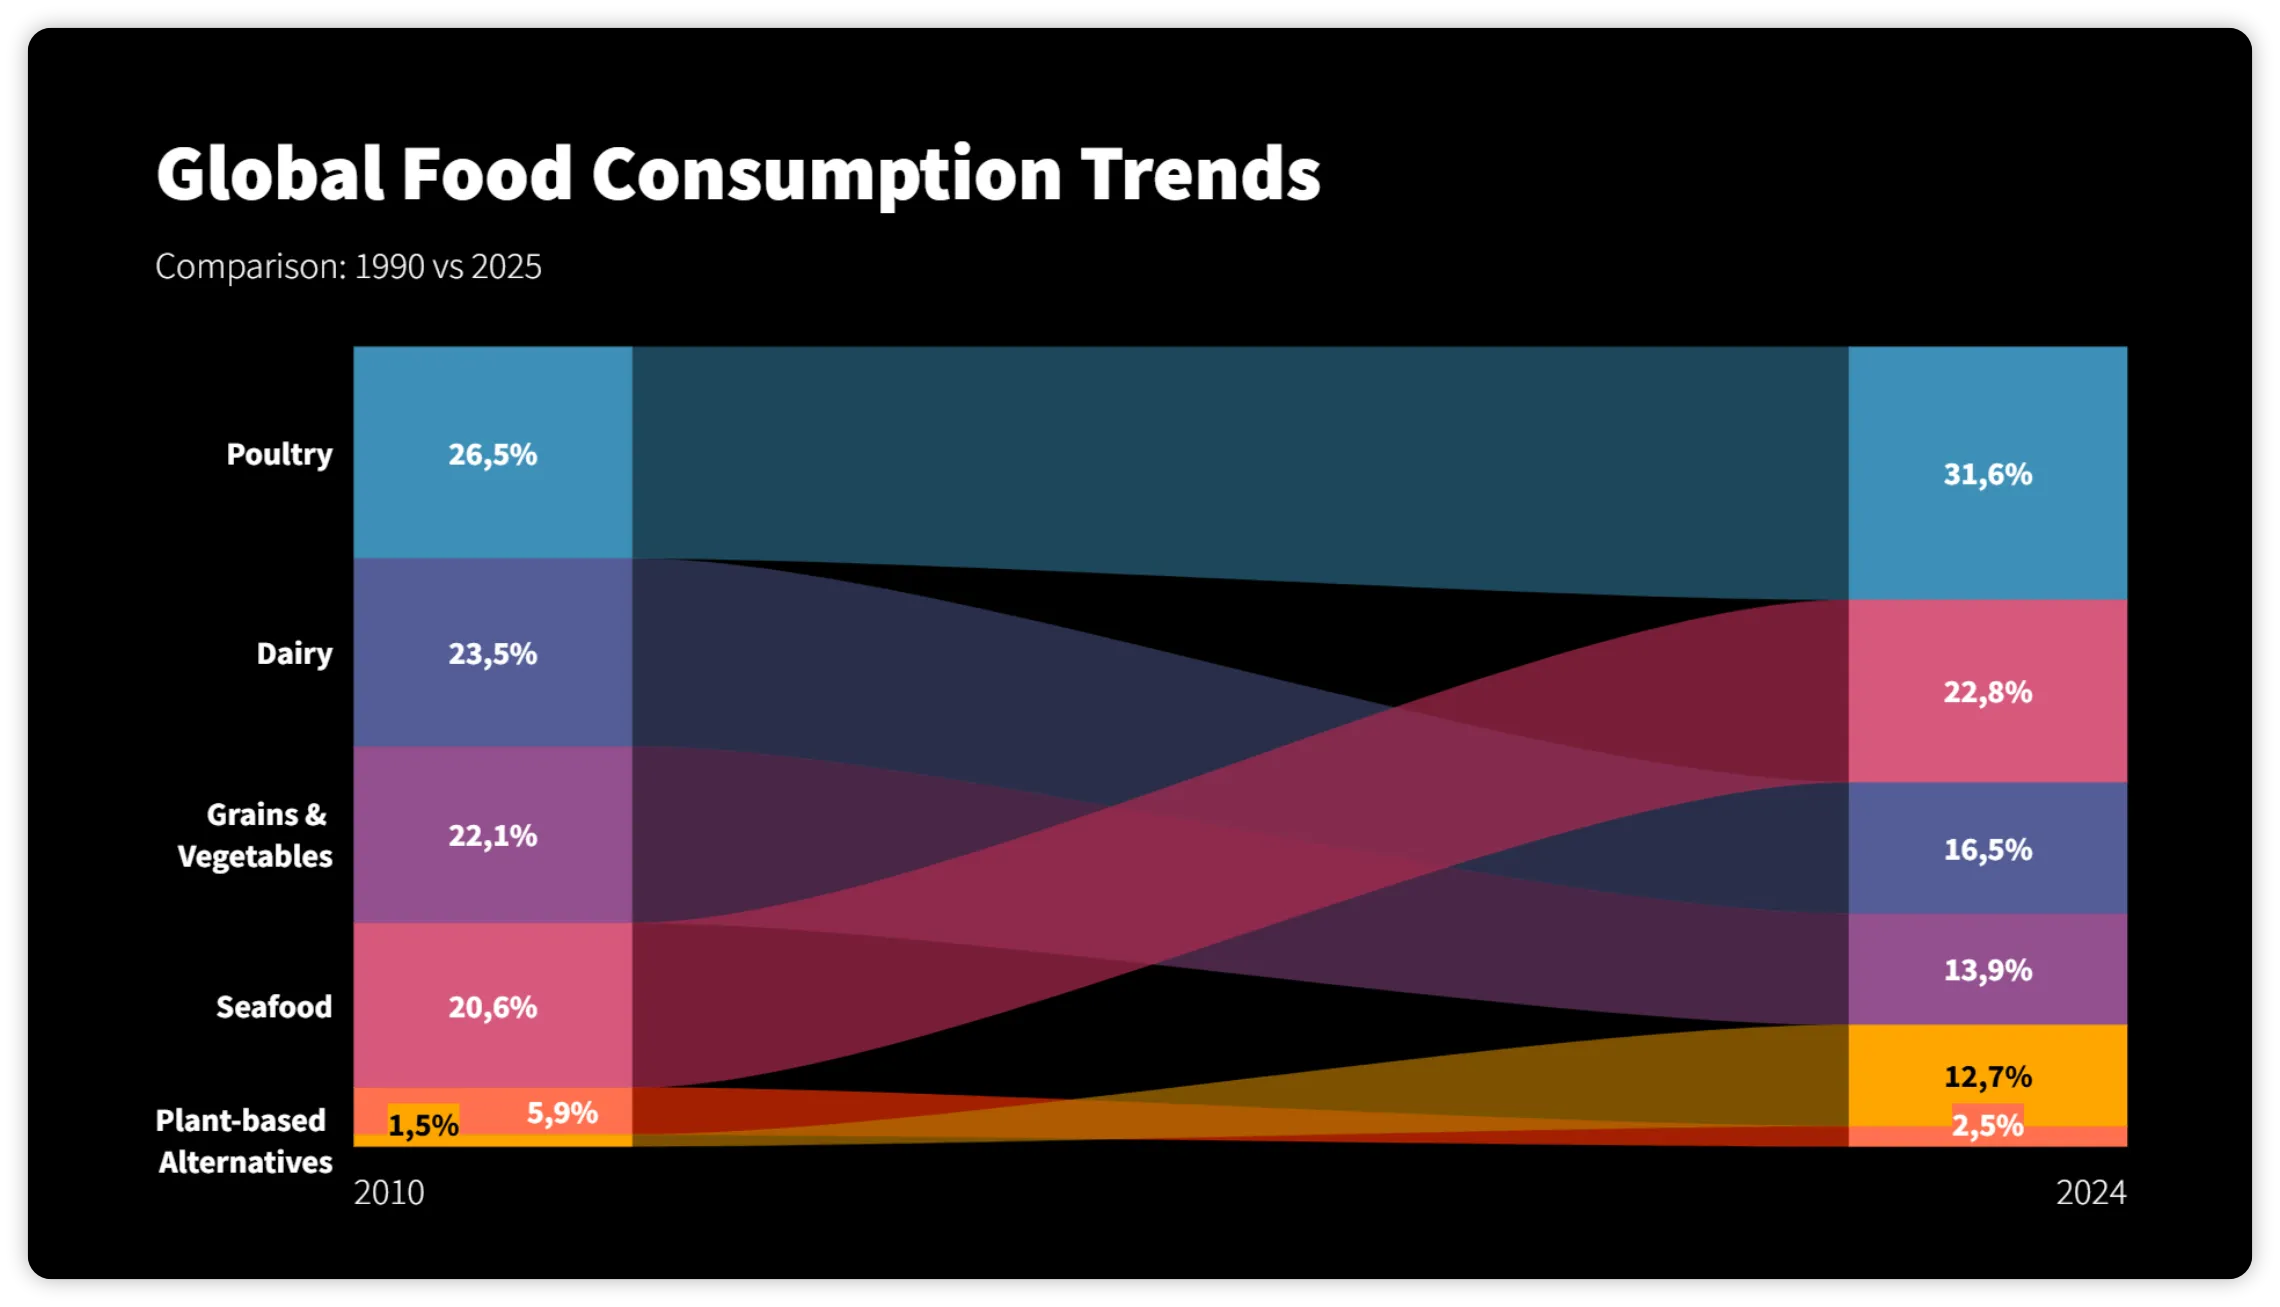
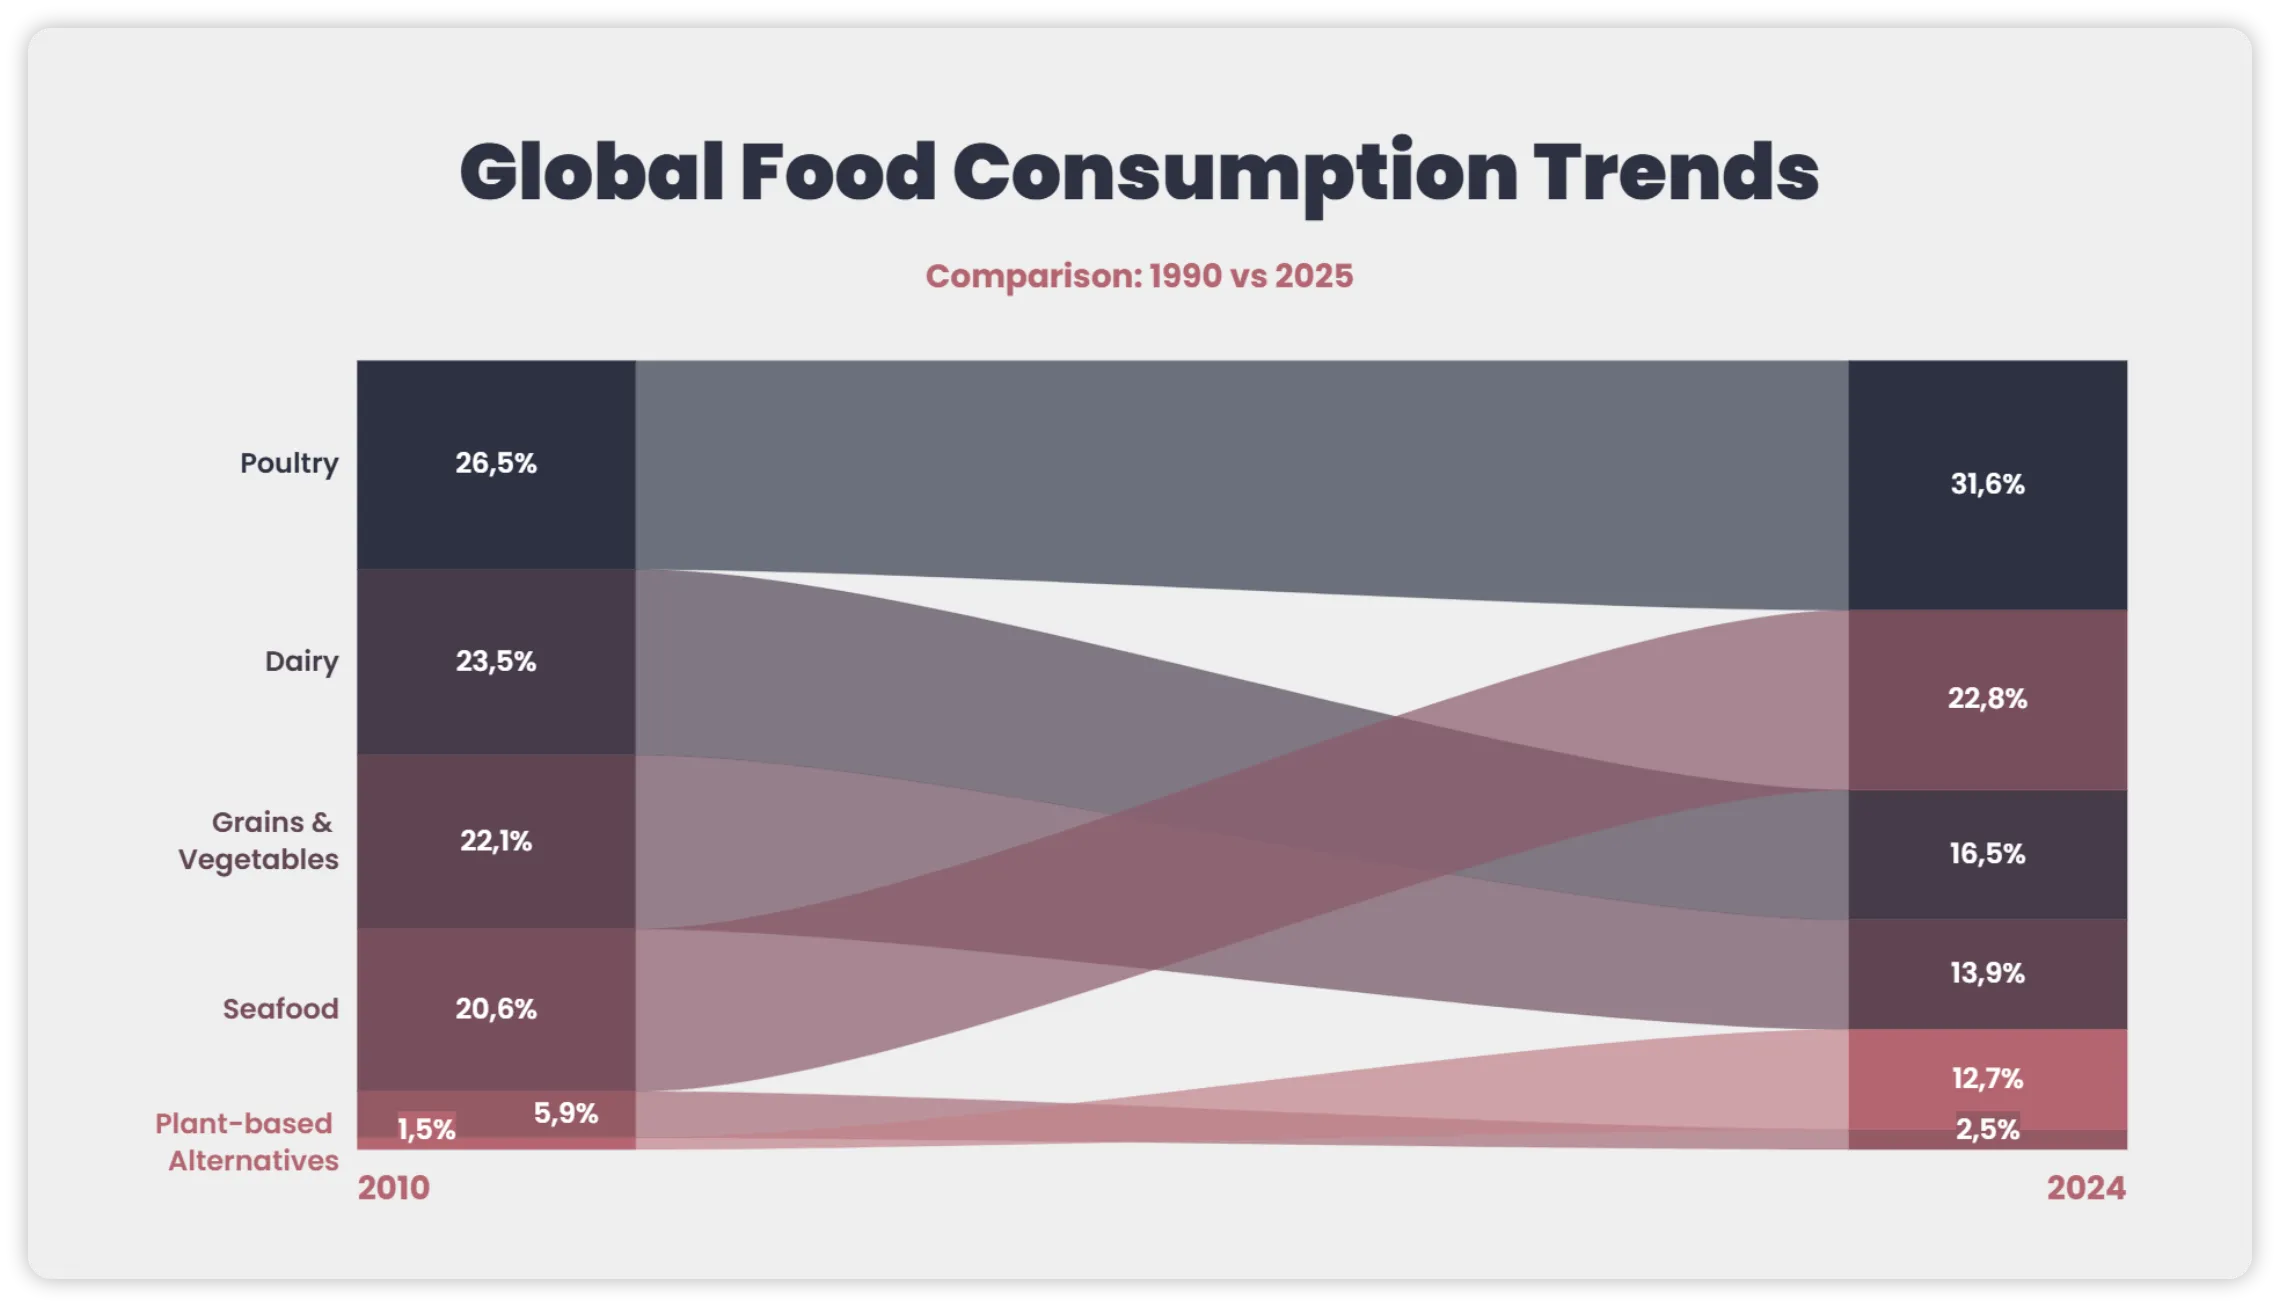
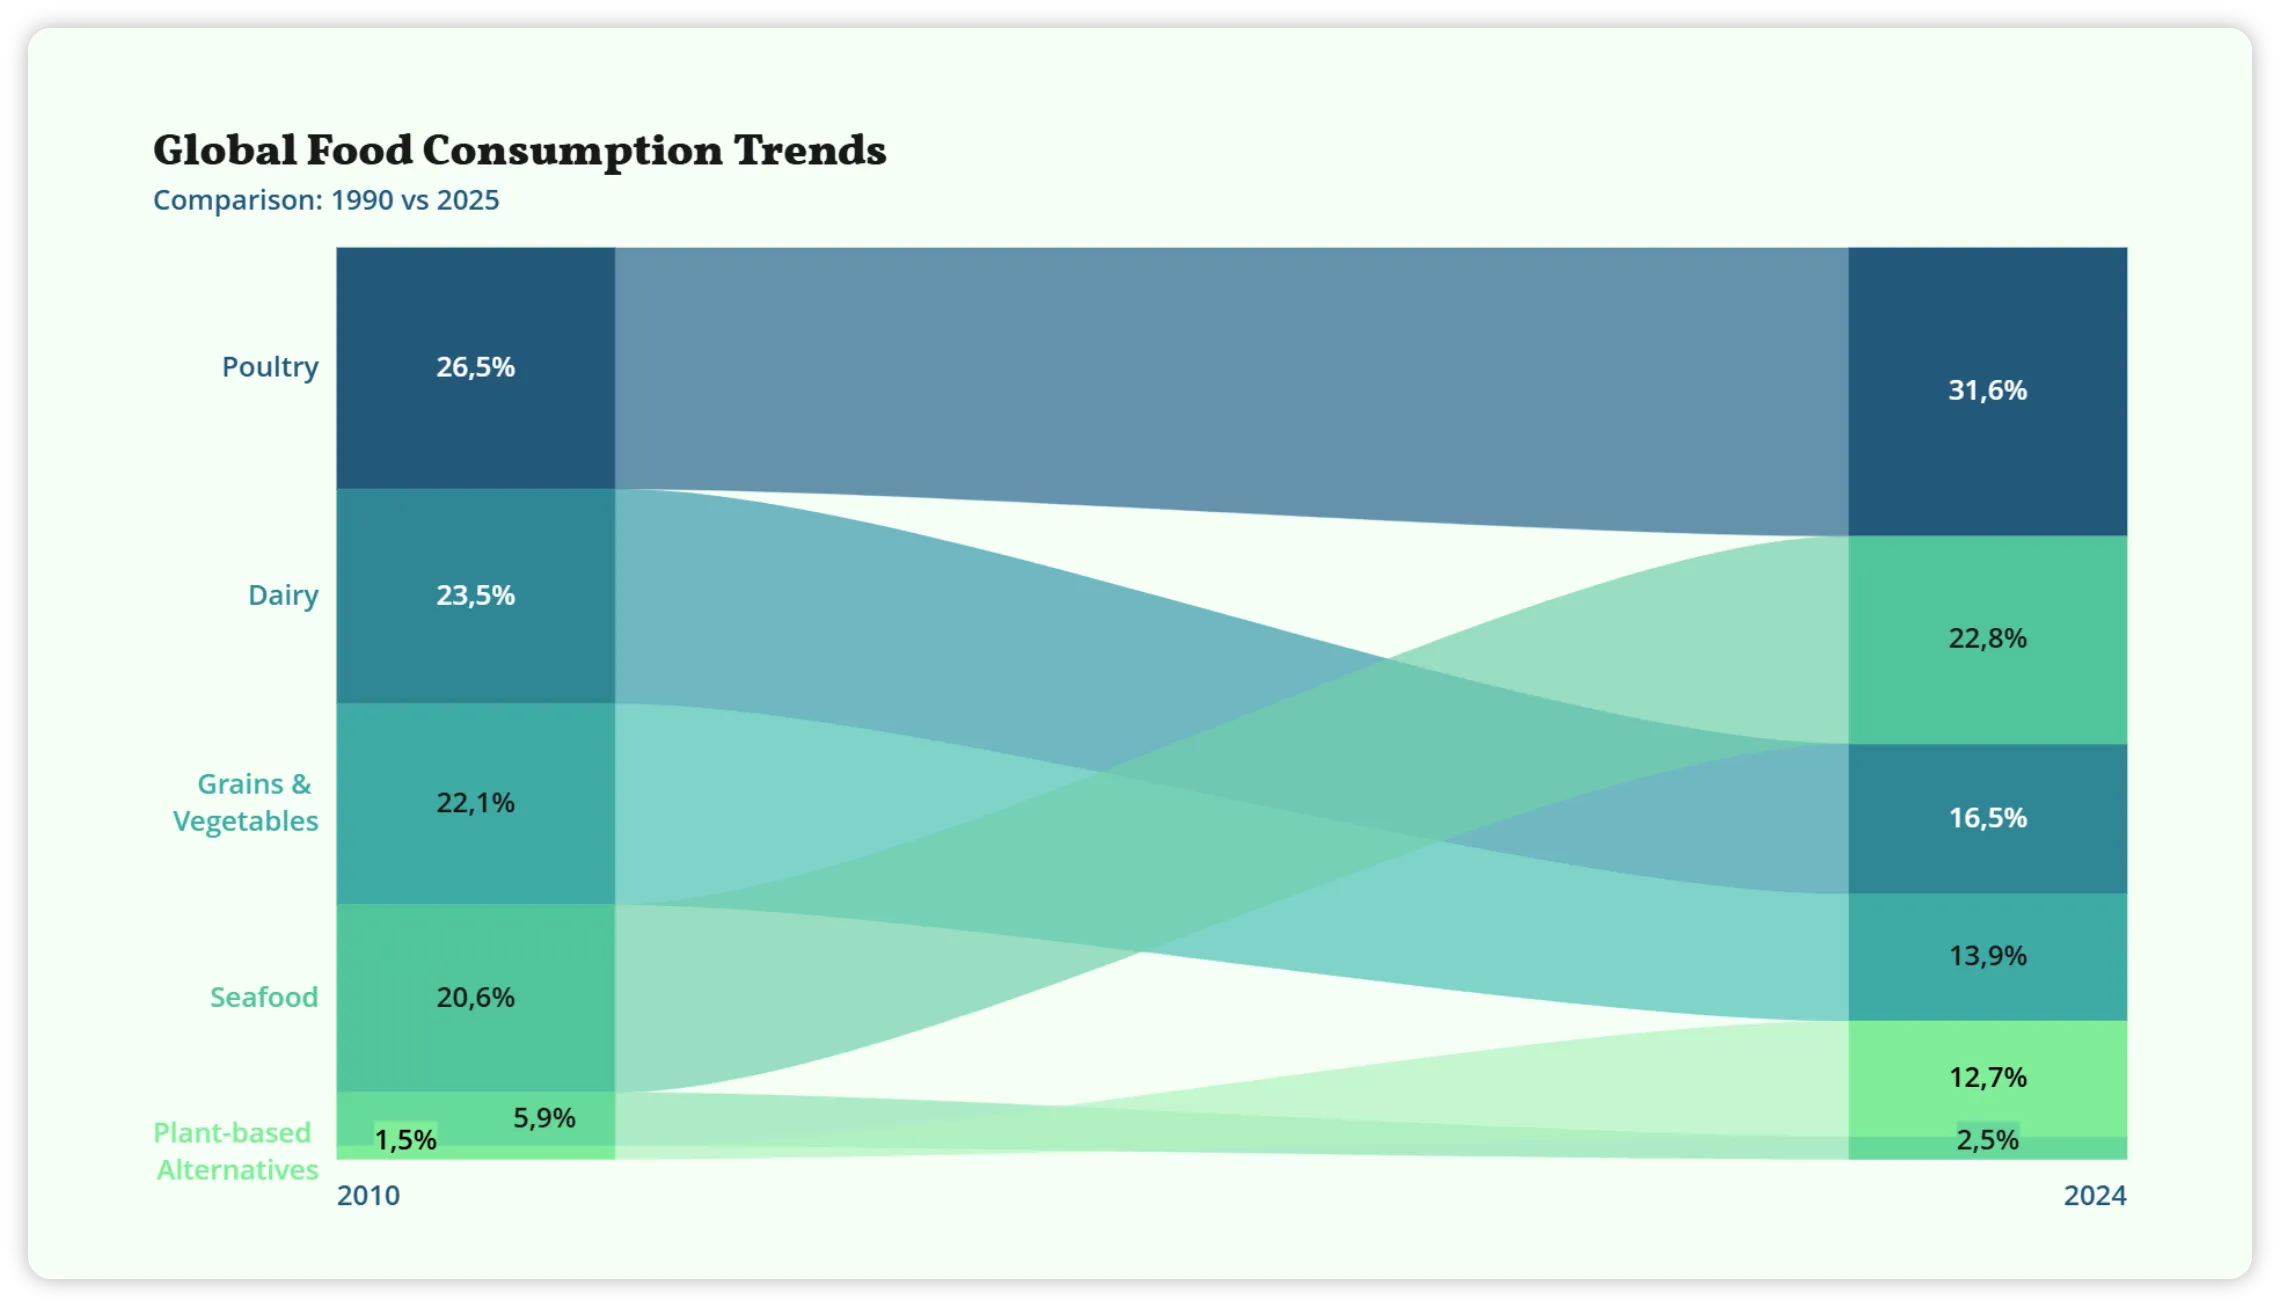
One visual standard across every presentation
Keep charts, templates and access consistent across teams, business units and leadership presentations.
- Shared themes
- Brand colors & fonts
- Reusable templates


