Chart Vizzard
Vizzlo's AI-based chart generator Camilo Rada
July 22, 2026 • 3 min read
A Redesigned PowerPoint Experience Across Windows, Mac, and the Web
We’ve completely redesigned our PowerPoint integration to make creating, updating, and managing charts feel more natural than ever.
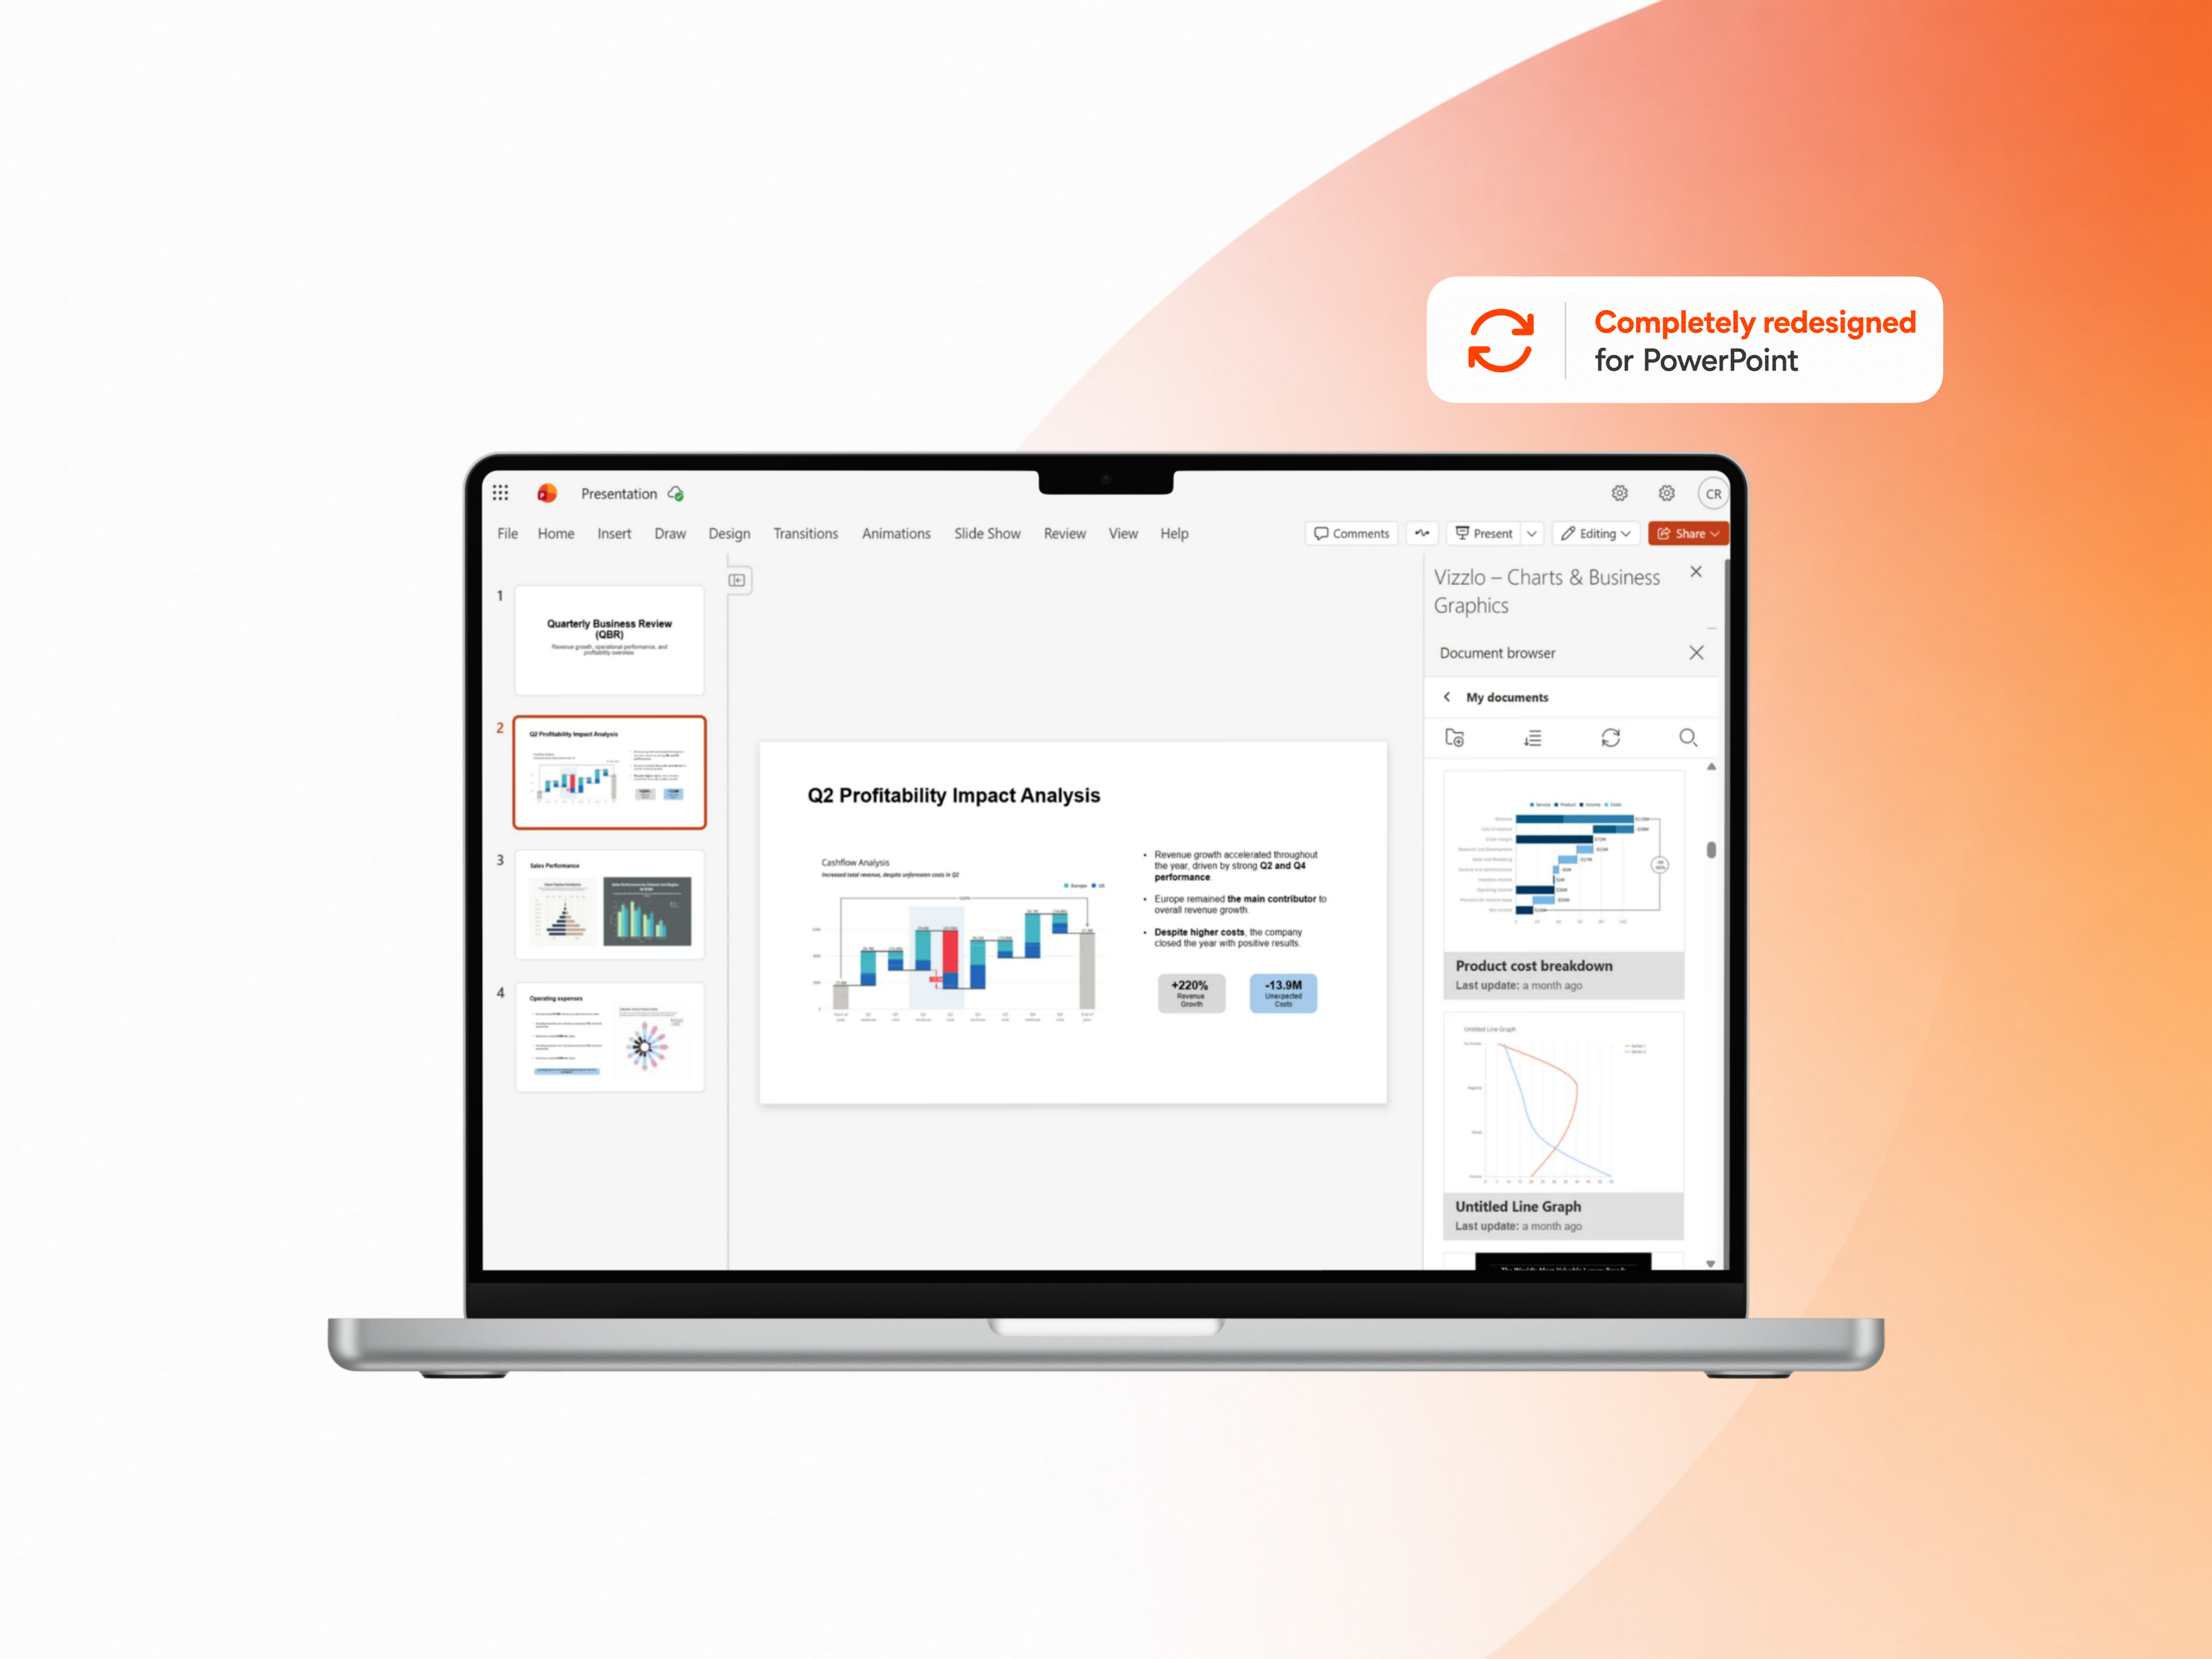
For years, Vizzlo has helped PowerPoint users create professional, presentation-ready charts directly within their presentations. Our native Windows integration has long delivered a tightly integrated charting experience, while the experience on PowerPoint for the web and Mac wasn’t yet on par with Windows.
Meanwhile, hundreds of thousands of users have adopted Vizzlo for Google Slides. Along the way, we’ve learned a great deal about how modern teams build presentations. Data changes, slides evolve, and charts need to keep up.
We’ve now brought those learnings back to the Microsoft ecosystem with a completely redesigned experience across PowerPoint for Windows, PowerPoint for the web, and PowerPoint for Mac. The result is a faster, more intuitive, and more consistent way to create, insert, and update charts.
Designed Around the Way You Really Work
Presentations are rarely finished in the first draft. As feedback comes in, data changes, and messaging evolves, your charts need to evolve too.
The redesigned experience is built for exactly that: helping you create new charts, insert existing ones, and keep them up to date without disrupting your workflow.
We’ve refined the way you interact with Vizzlo inside PowerPoint, improving everything from the sidebar experience to chart updates and presentation interactions. The result is a workflow that feels more consistent, intuitive, and connected.
Many of these improvements may seem small on their own, but together they make working with charts significantly easier.
Whether you’re building consulting decks, executive reports, sales presentations, or strategy updates, Vizzlo gives you access to a rich library of professional charts—from Waterfall and Marimekko charts to Gantt charts, Timelines, Sankey diagrams, and dozens more—directly inside PowerPoint.
Wherever You Create Your Presentations
Vizzlo now works seamlessly across PowerPoint for Windows, PowerPoint for the web, and PowerPoint for Mac, giving you a consistent charting experience wherever you build presentations.
Wherever you work, Vizzlo fits naturally into your workflow, so you can spend less time managing charts and more time communicating what matters most.
Try It Today
If you’re already using Vizzlo with PowerPoint, you’ll notice the difference from your very first presentation.
And if you haven’t tried it yet, there’s never been a better time to discover a more integrated and intuitive way to create professional charts without leaving PowerPoint.
Getting started only takes a minute:
- Open Microsoft PowerPoint.
- Go to Home → Add-ins (or Insert → Get Add-ins, depending on your version of PowerPoint).
- Search for Vizzlo in the Microsoft Marketplace.
- Click Add to install the Vizzlo PowerPoint Add-in.
- Sign in with your Vizzlo account and start creating, inserting, and updating professional charts directly from your presentation.
The best tools disappear into your workflow, so your charts can speak for themselves.
If you would like to learn more about this integration or want to join a demo for your organization, please get in touch with us.