Chart Vizzard
Vizzlo's AI-based chart generatorCreate your Progress Bar Chart in seconds
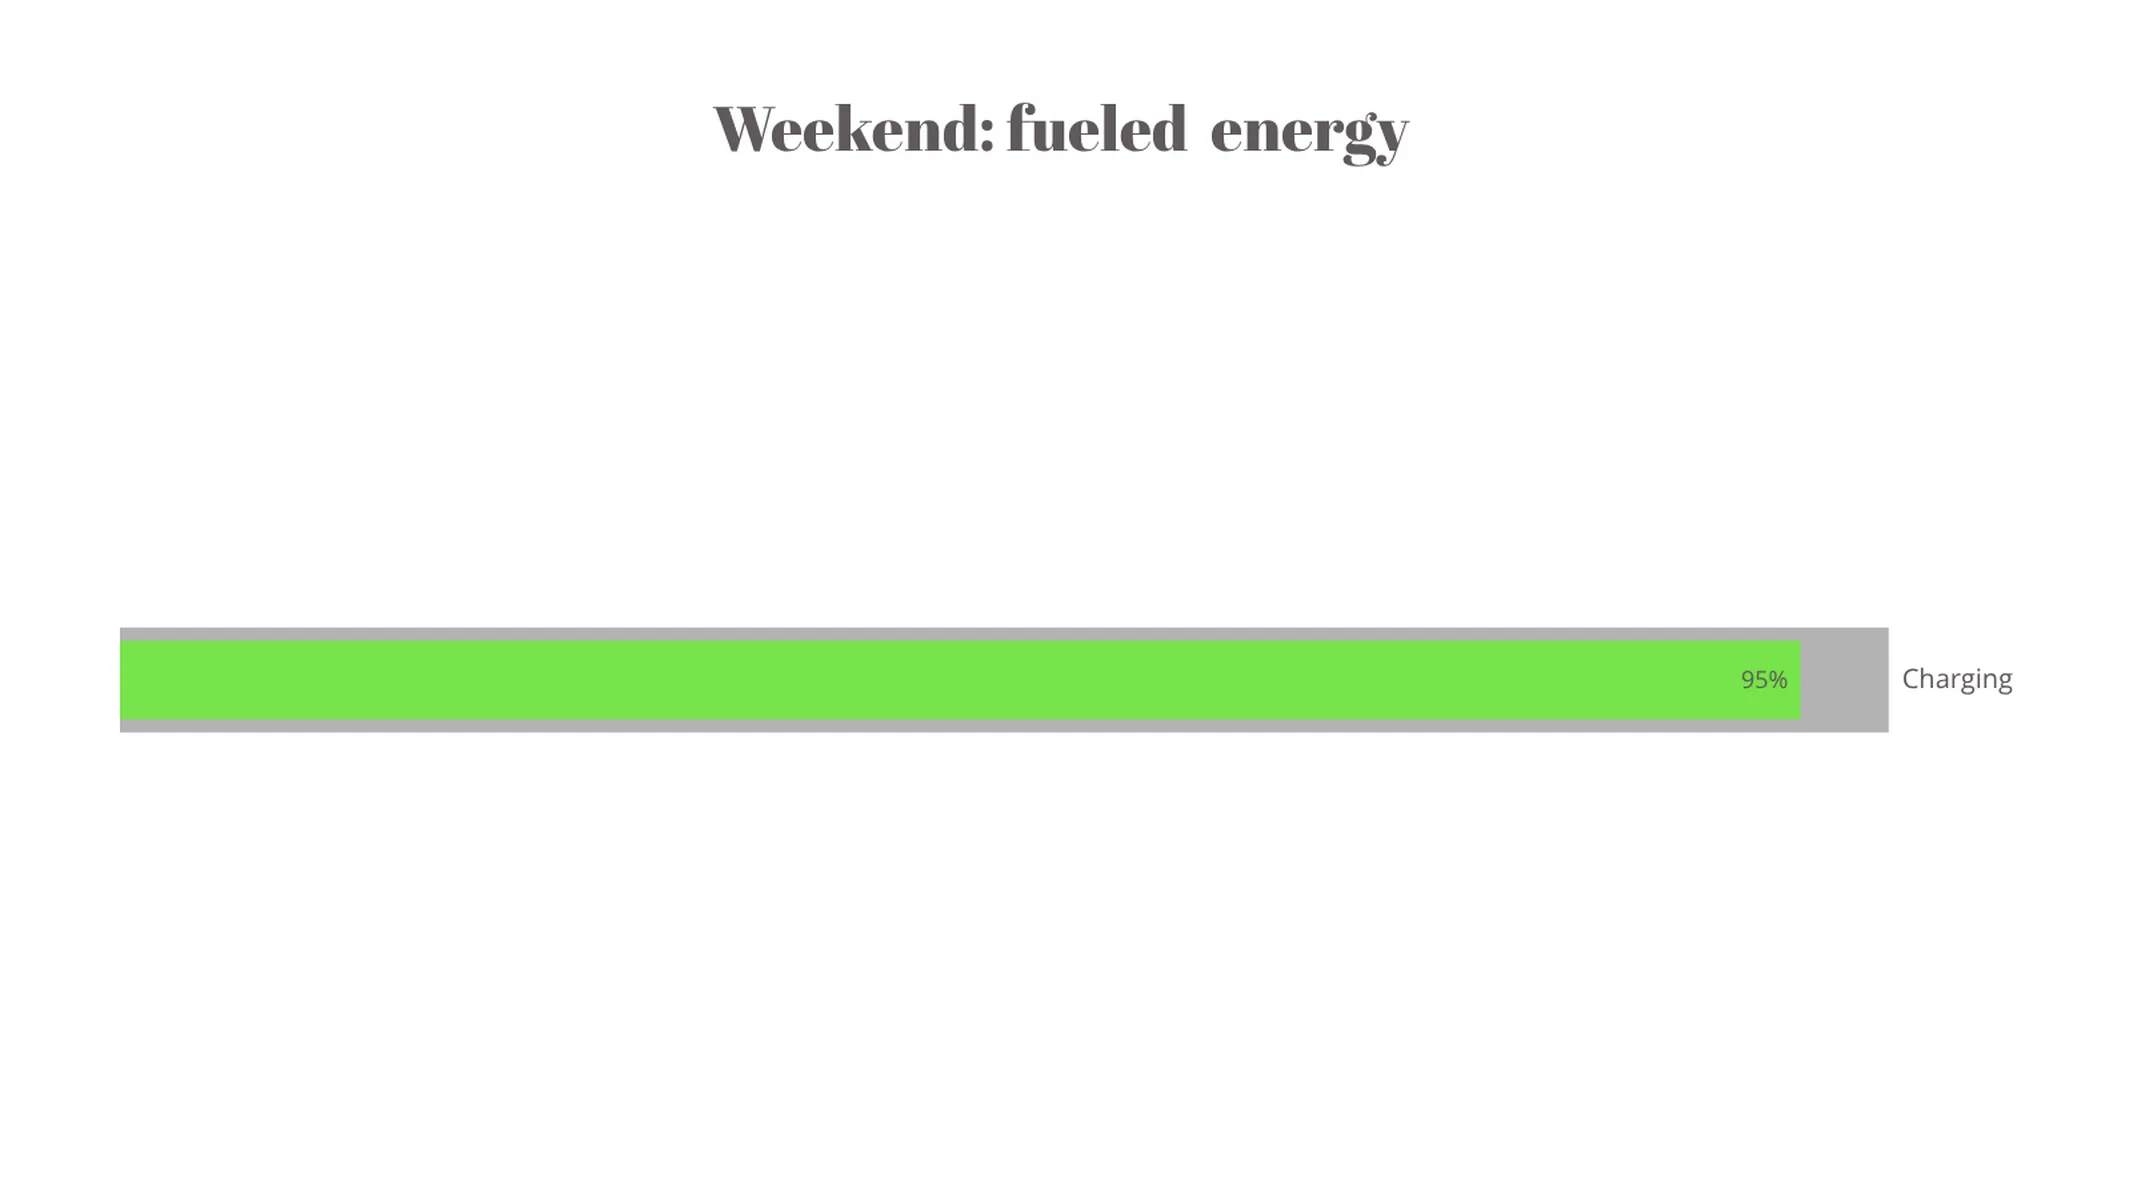
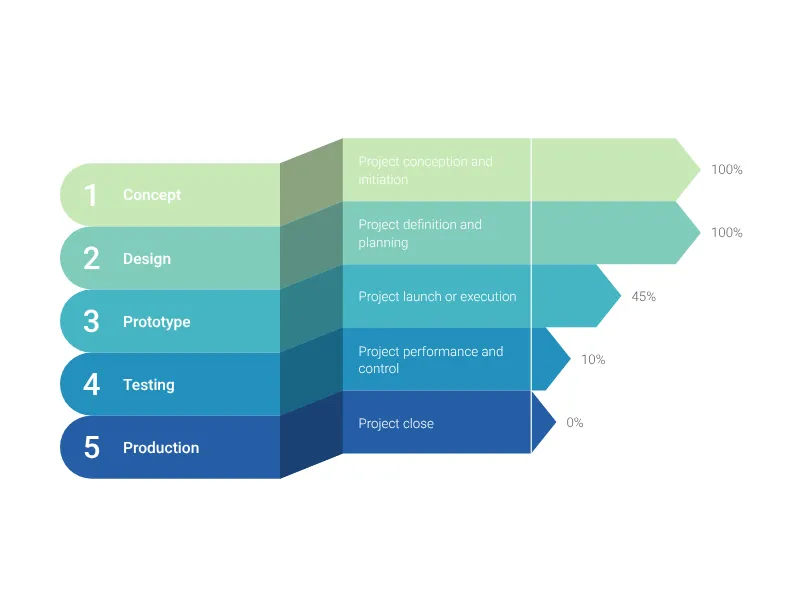
Communicate the completion status of a task list with our progress bar chart.
Create your chart in 3 simple steps
- Create new Progress Bar Chart
- Add your data
- Export or share
Why Vizzlo?
- Create professional charts in seconds
- Fully customizable, no design skills needed
- Create directly in PowerPoint & Google Slides
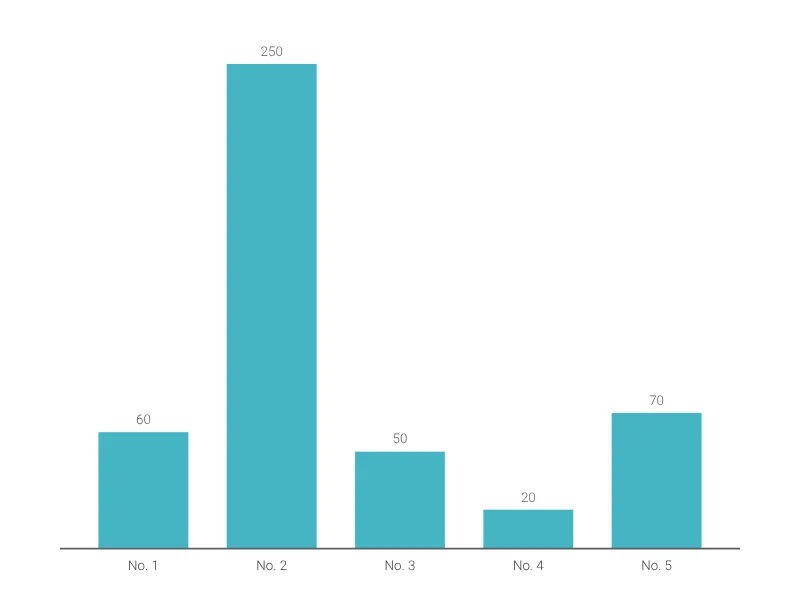
What is a progress bar chart?
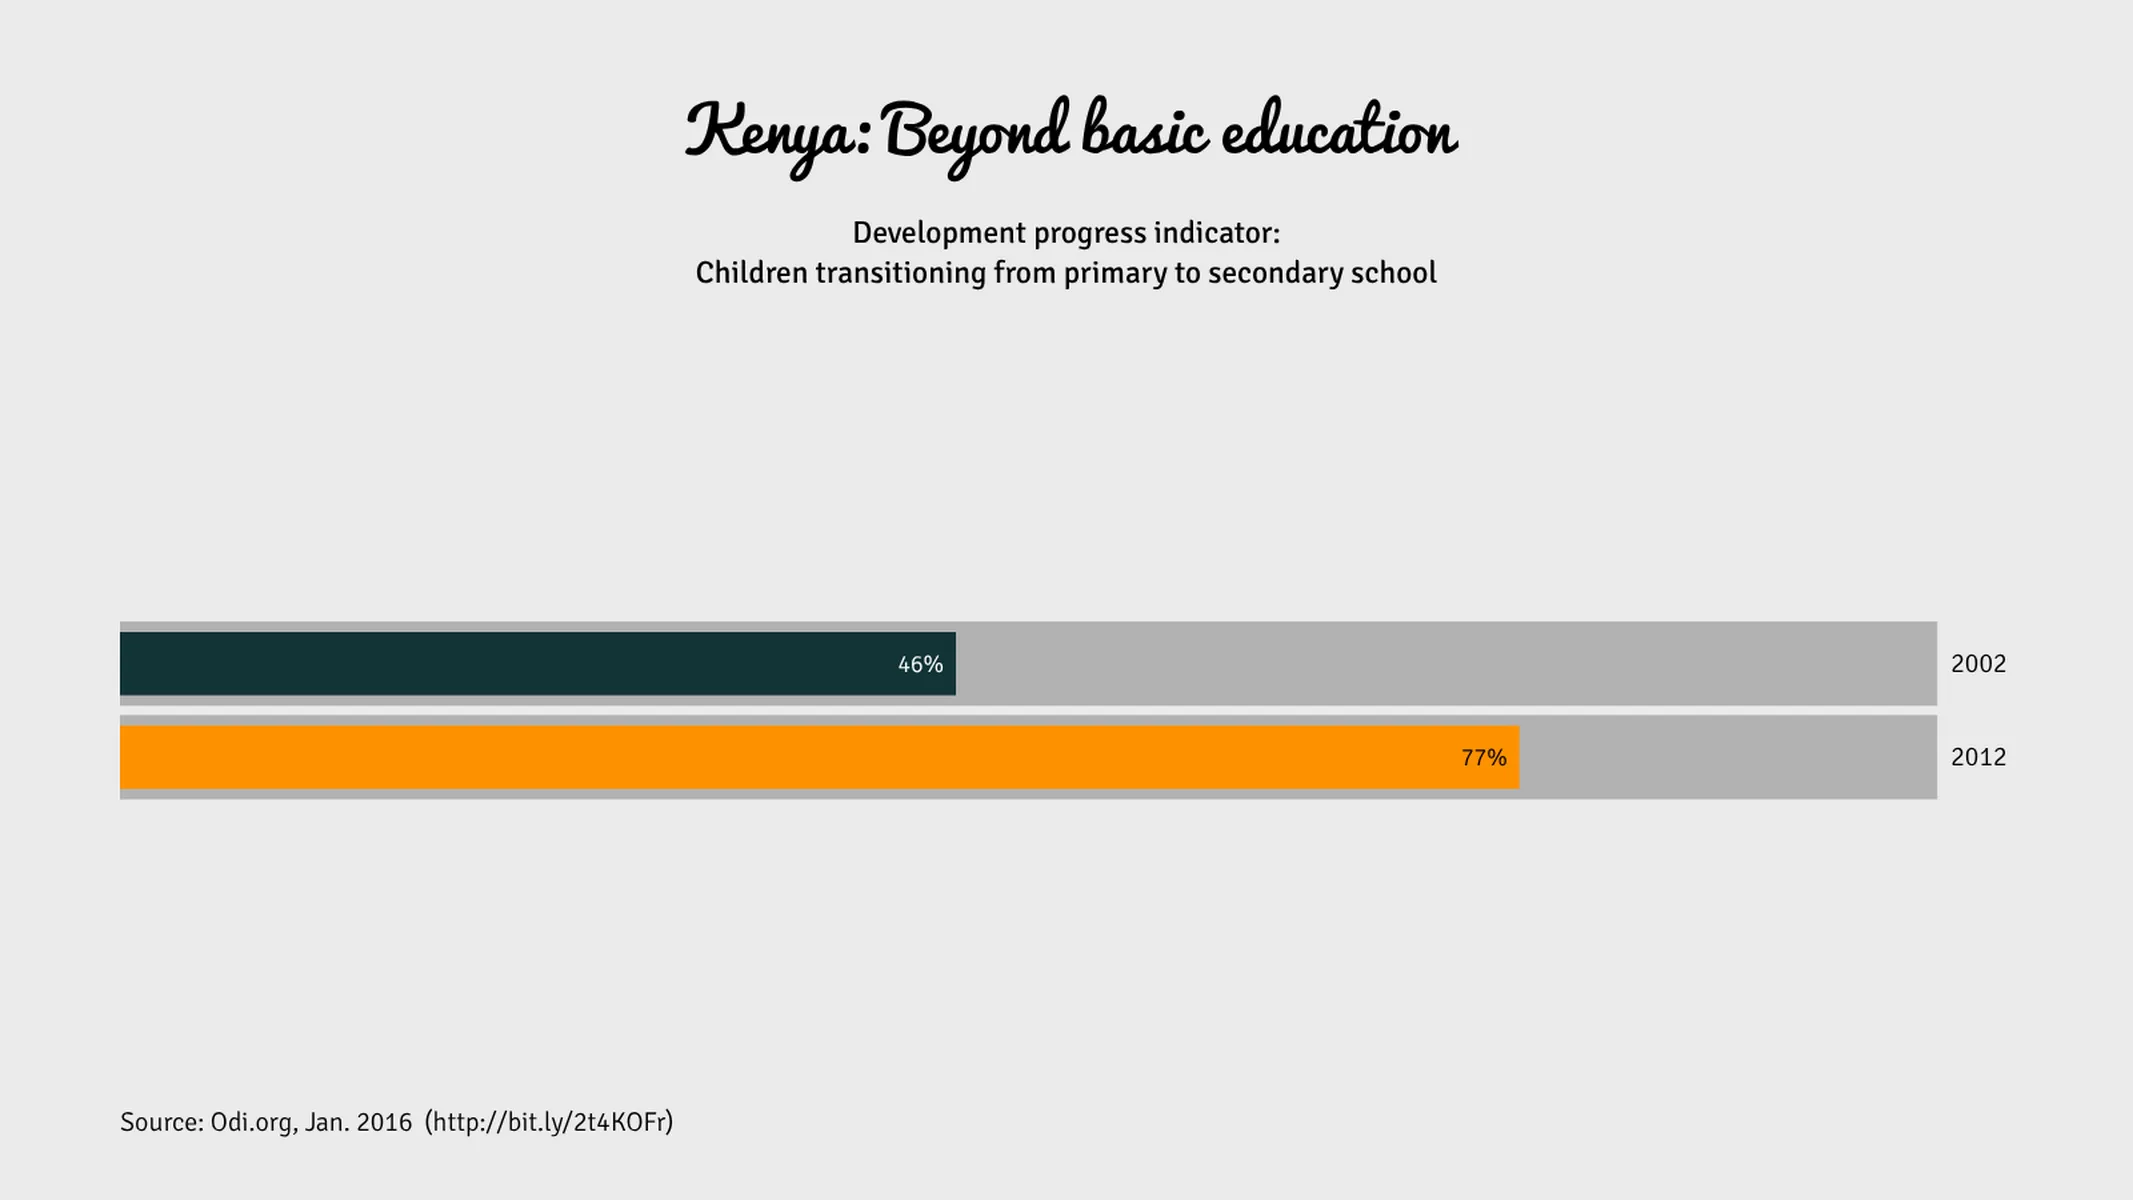
The progress bar graph displays filled bars that proportionally indicate how much of a planned activity or goal has been completed.
After defining your project goals and milestones, this chart helps you to visualize and keep track of your team’s work.
How to make a progress bar chart with Vizzlo?
Make an elegant progress bar chart online to visualize and communicate the status of your project with ease.
- Select any bar to edit it.
- Use the active cards to change labels, values and to highlight the selected bar.
- You can also use Vizzlo’s spreadsheet to enter your data.
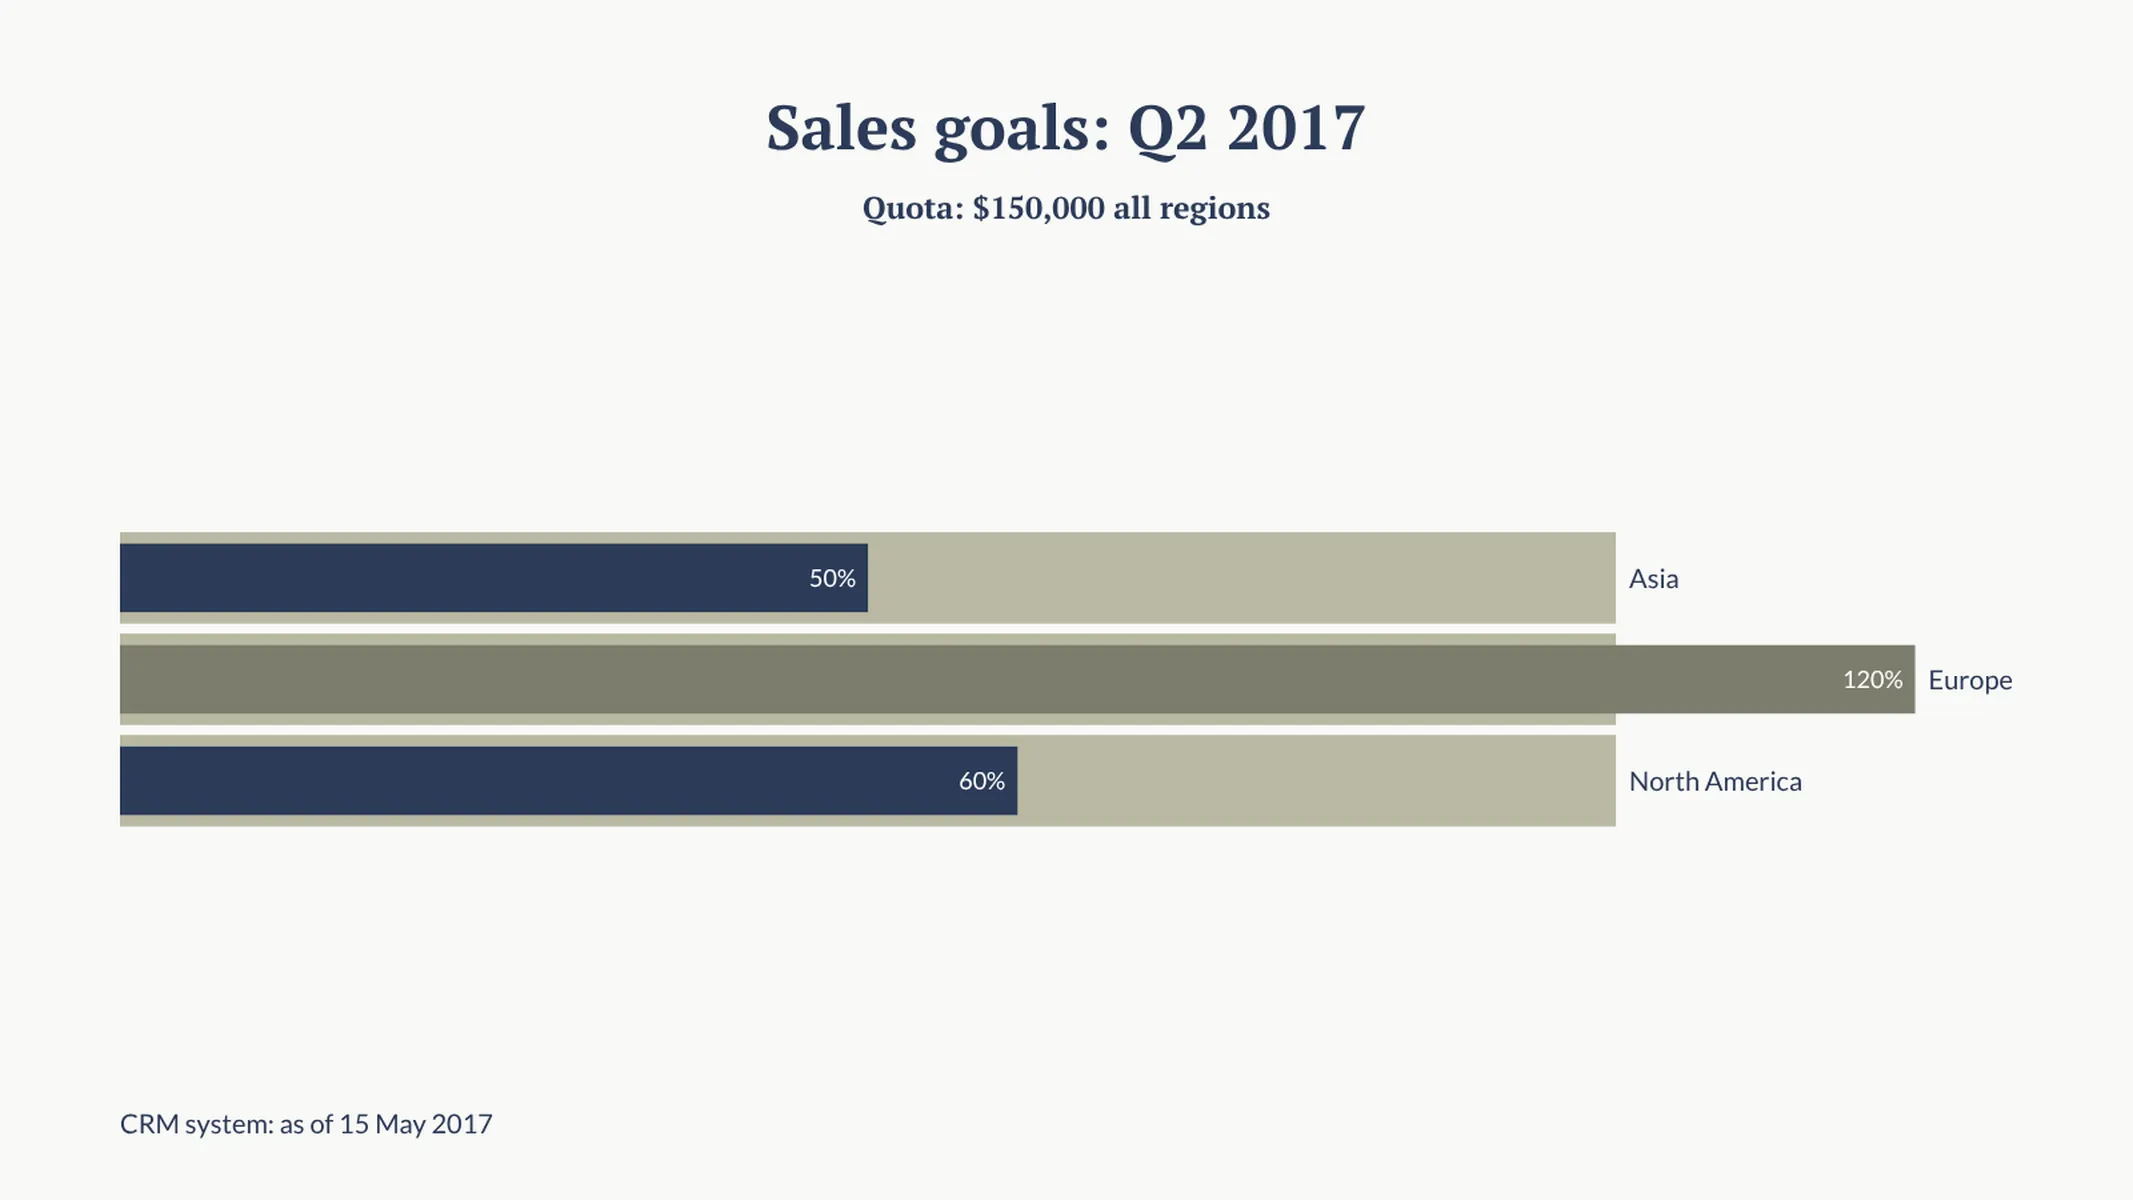
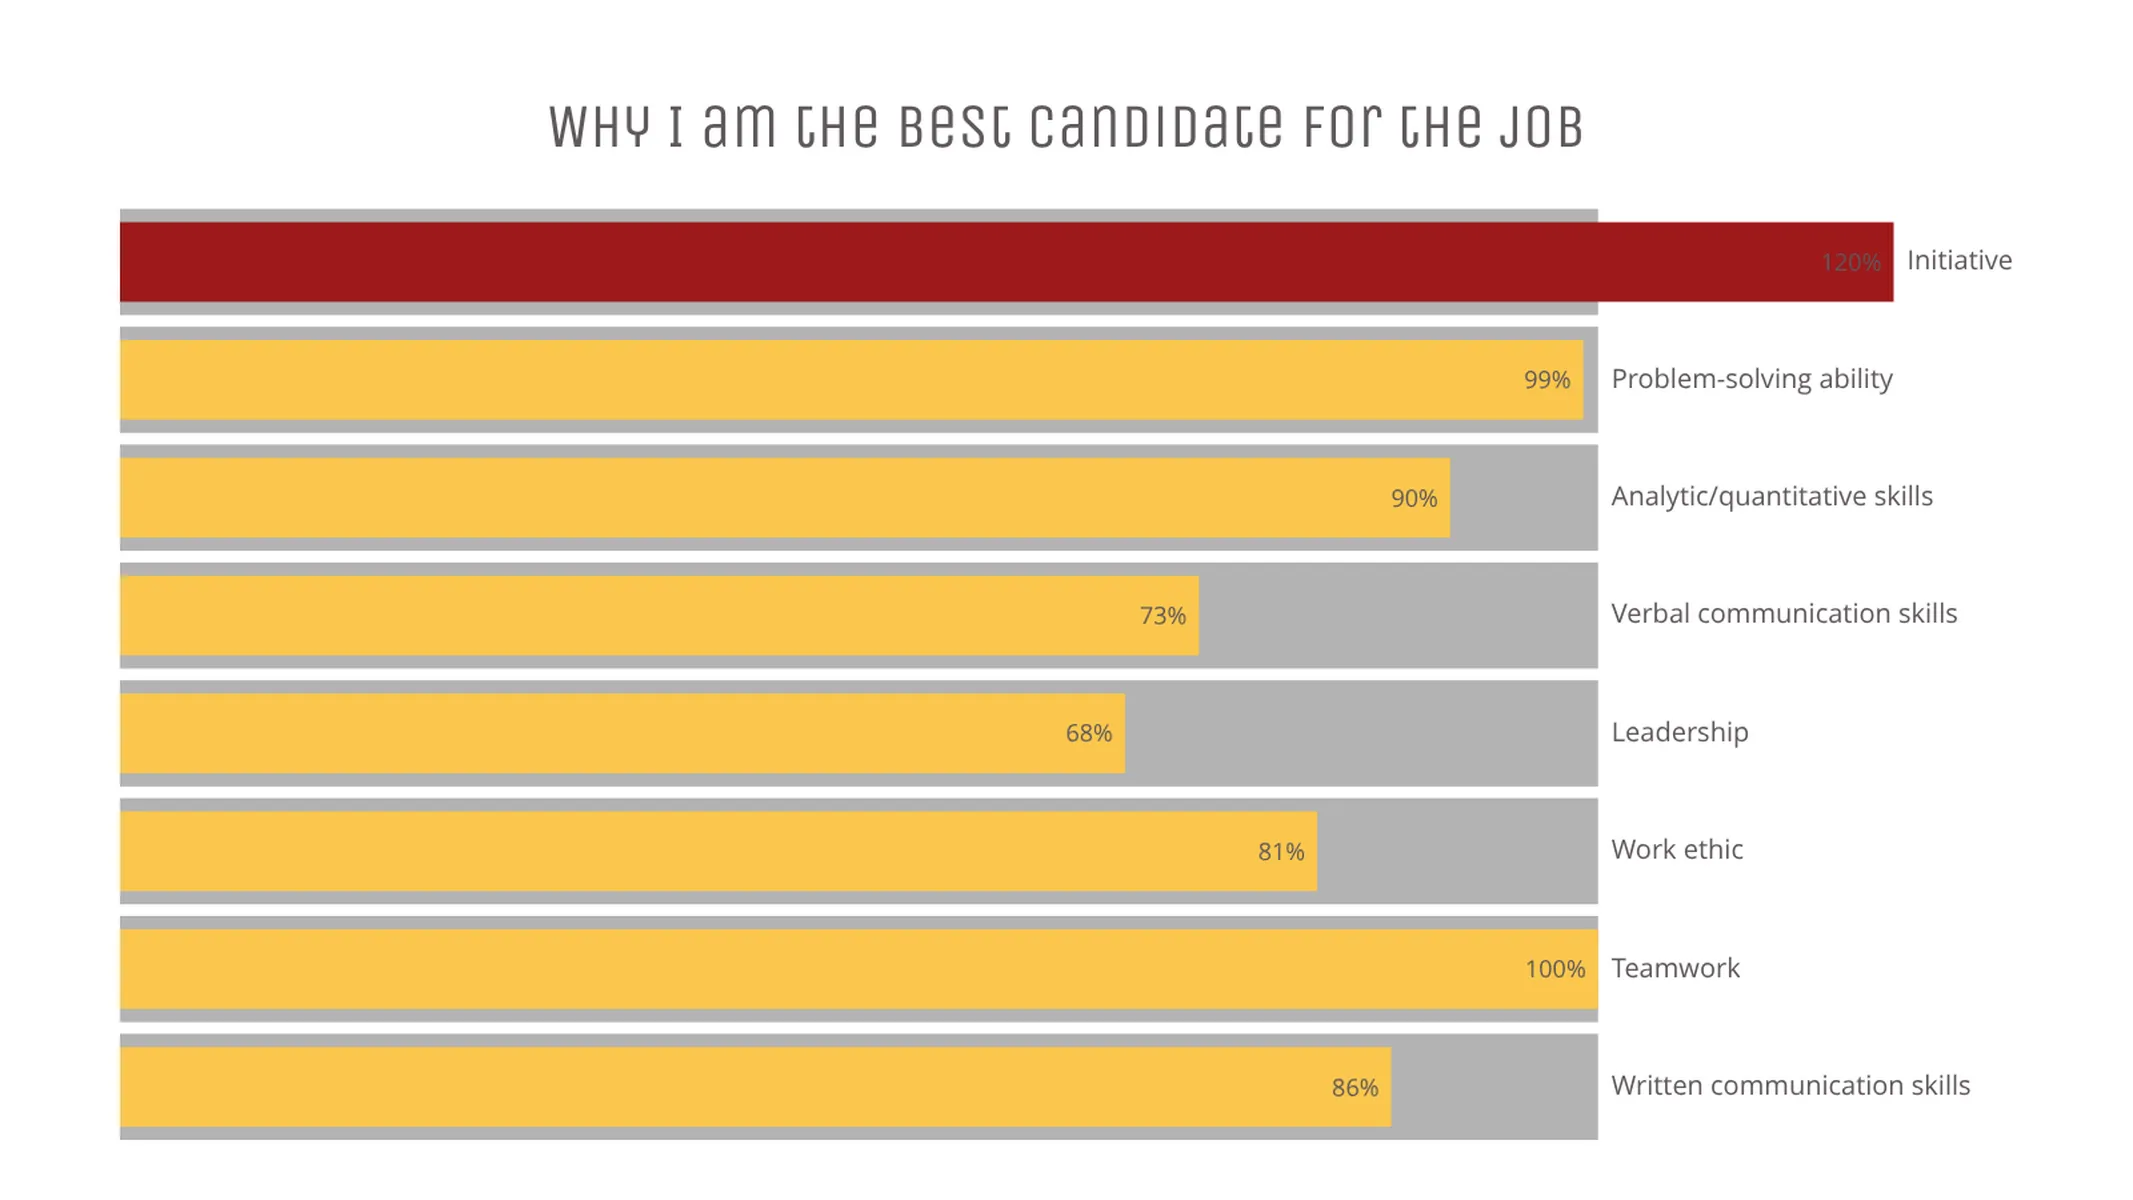
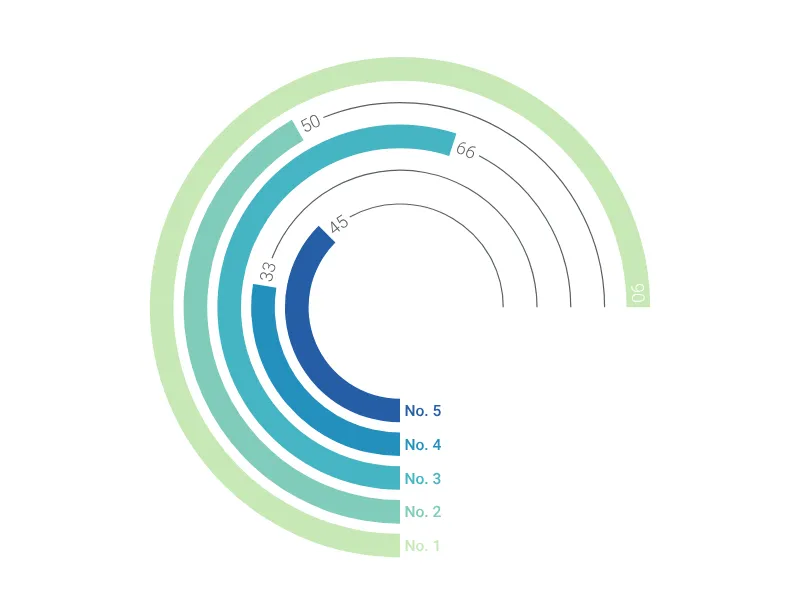
Pro tip: If your team has exceeded the goals (we, too, think that’s great!), the chart will display any progress made beyond 100%.
Progress bar chart maker: key features
- Custom colors
- Highlighted bars
- Optional labeling of values
- Displays exceeded goals
Progress Bar Chart: What's new?
You can now edit the colors of bars individually.
These chart types now all support adding custom formatting to individual value labels.
Progress Bar Chart Alternatives
Enhance your productivity
Create a Progress Bar Chart directly in the tools you love

Create a Progress Bar Chart in PowerPoint with
Vizzlo's add-in

Loved by professionals around the world


Visualizations your audience won’t forget
Convey abstract concepts and data with professionally designed
charts and graphics you can easily edit and customize.