Chart Vizzard
Vizzlo's AI-based chart generatorBird’s-Eye Funnel
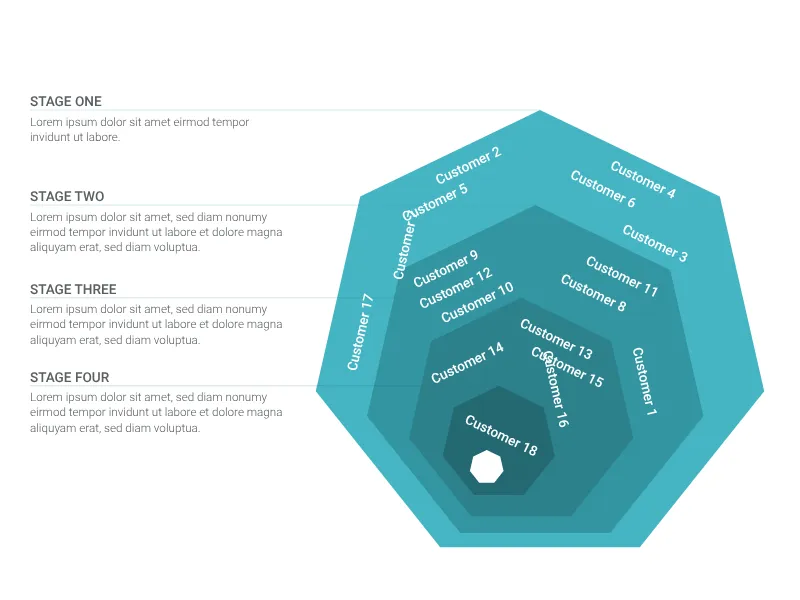
A fantastic representation of a funnel chart from the top of it. Perfect to represent the stages of your sales process!
What is a bird’s-eye funnel?
From prospecting a new client to the closing of a deal, the sales process has many steps, each with risks and opportunities to observe.
This plugin helps you to visualize the whole process from a different perspective: a bird’s-eye view, i.e. from an elevated positon into the center of the funnel — a visual effect that stresses an “in-depth” approach. Additionally, it offers extra room to add some detail to each stage and rank your customers accordingly.
It is a great visual aid to communicate your organization’s sales process to new team members, superiors or investors, facilitating analysis and decision making.
How to make a bird’s-eye funnel with Vizzlo?
- Click on the “DATA” tab on the sidebar and click on the corresponding card to edit the labels.
- To adjust the position of the labels, simply drag and drop them into place. Alternatively, adjust the positioning manually by inputting the X and Y values on the card.
- Check/uncheck the box “Round” to choose to display your funnel chart with circles instead of polygons.
Bird’s-eye maker: key features
- Switch between heptagon and circular view
- Custom colors
Bird’s-Eye Funnel : What's new?
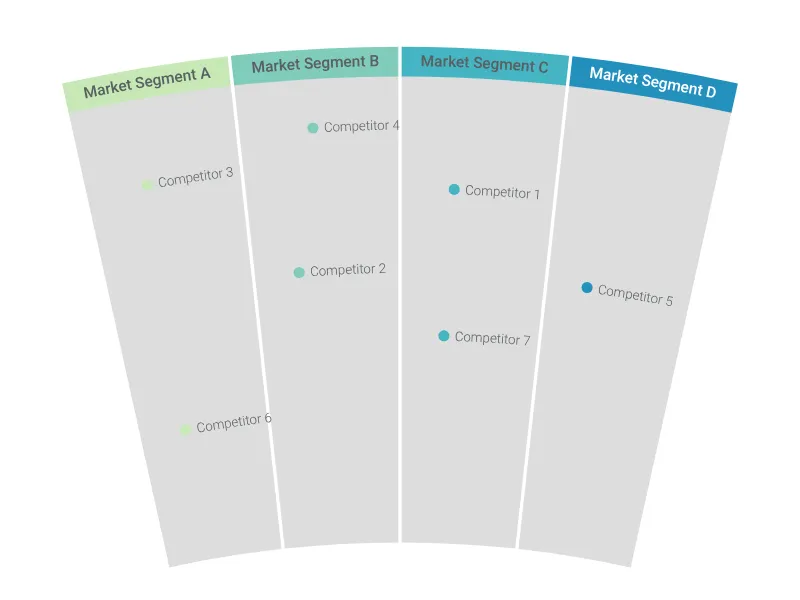
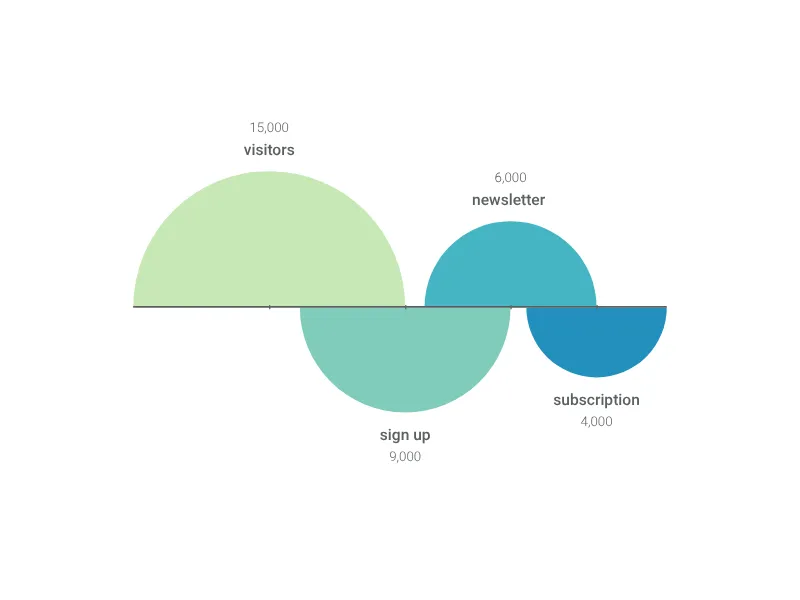
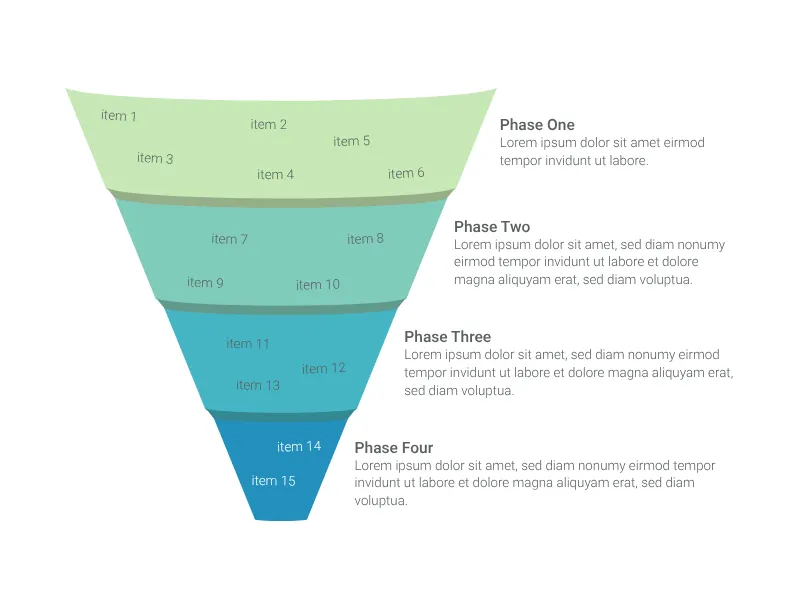
Bird’s-Eye Funnel Alternatives
Enhance your productivity
Create a Bird’s-Eye Funnel directly in the tools you love

Create a Bird’s-Eye Funnel in PowerPoint with
Vizzlo's add-in

Loved by professionals around the world


Visualizations your audience won’t forget
Convey abstract concepts and data with professionally designed
charts and graphics you can easily edit and customize.