Chart Vizzard
Vizzlo's AI-based chart generatorComparison Matrix
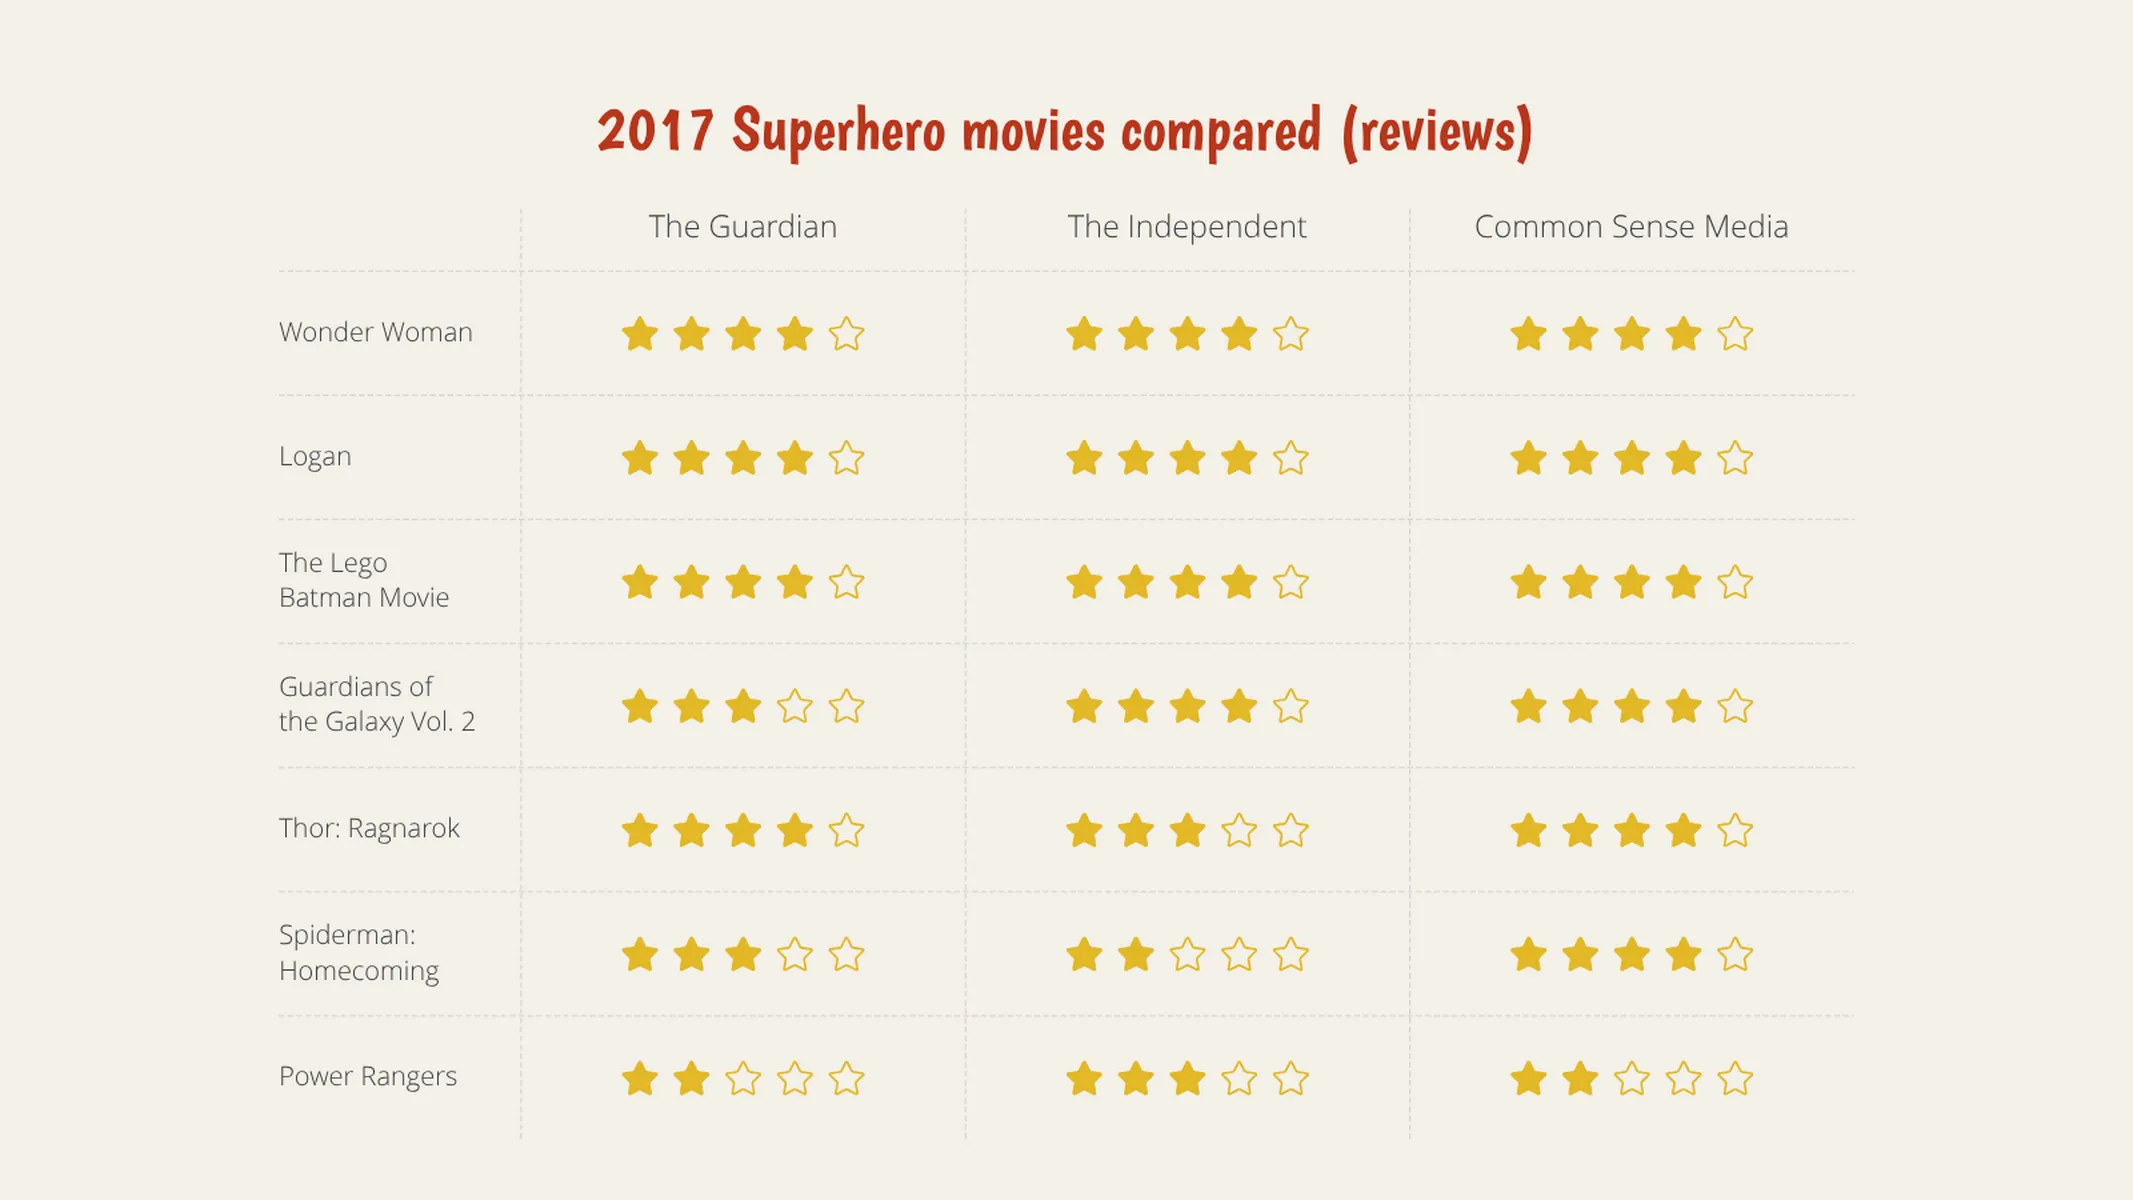
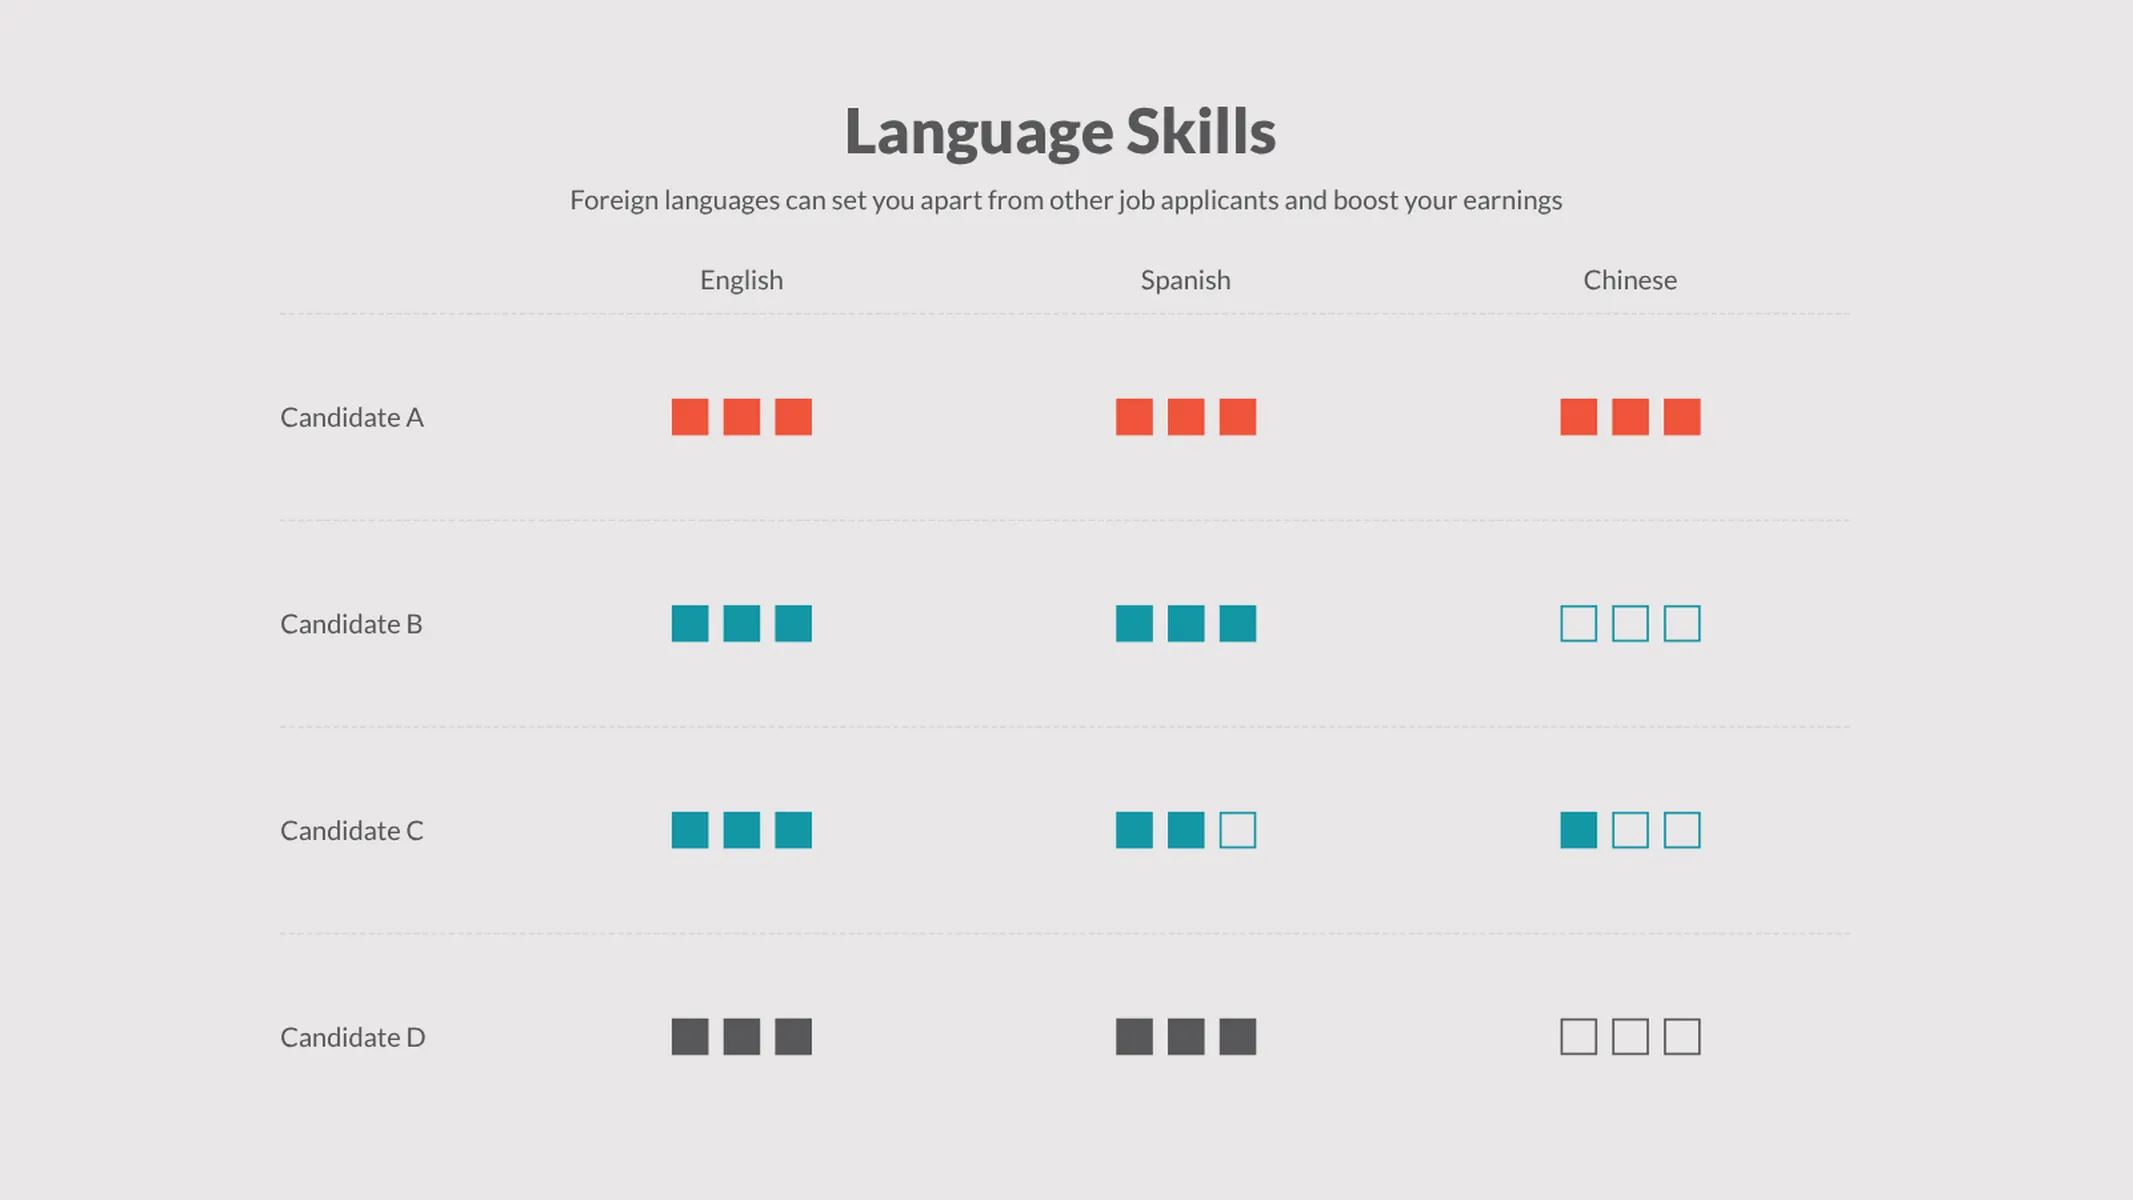
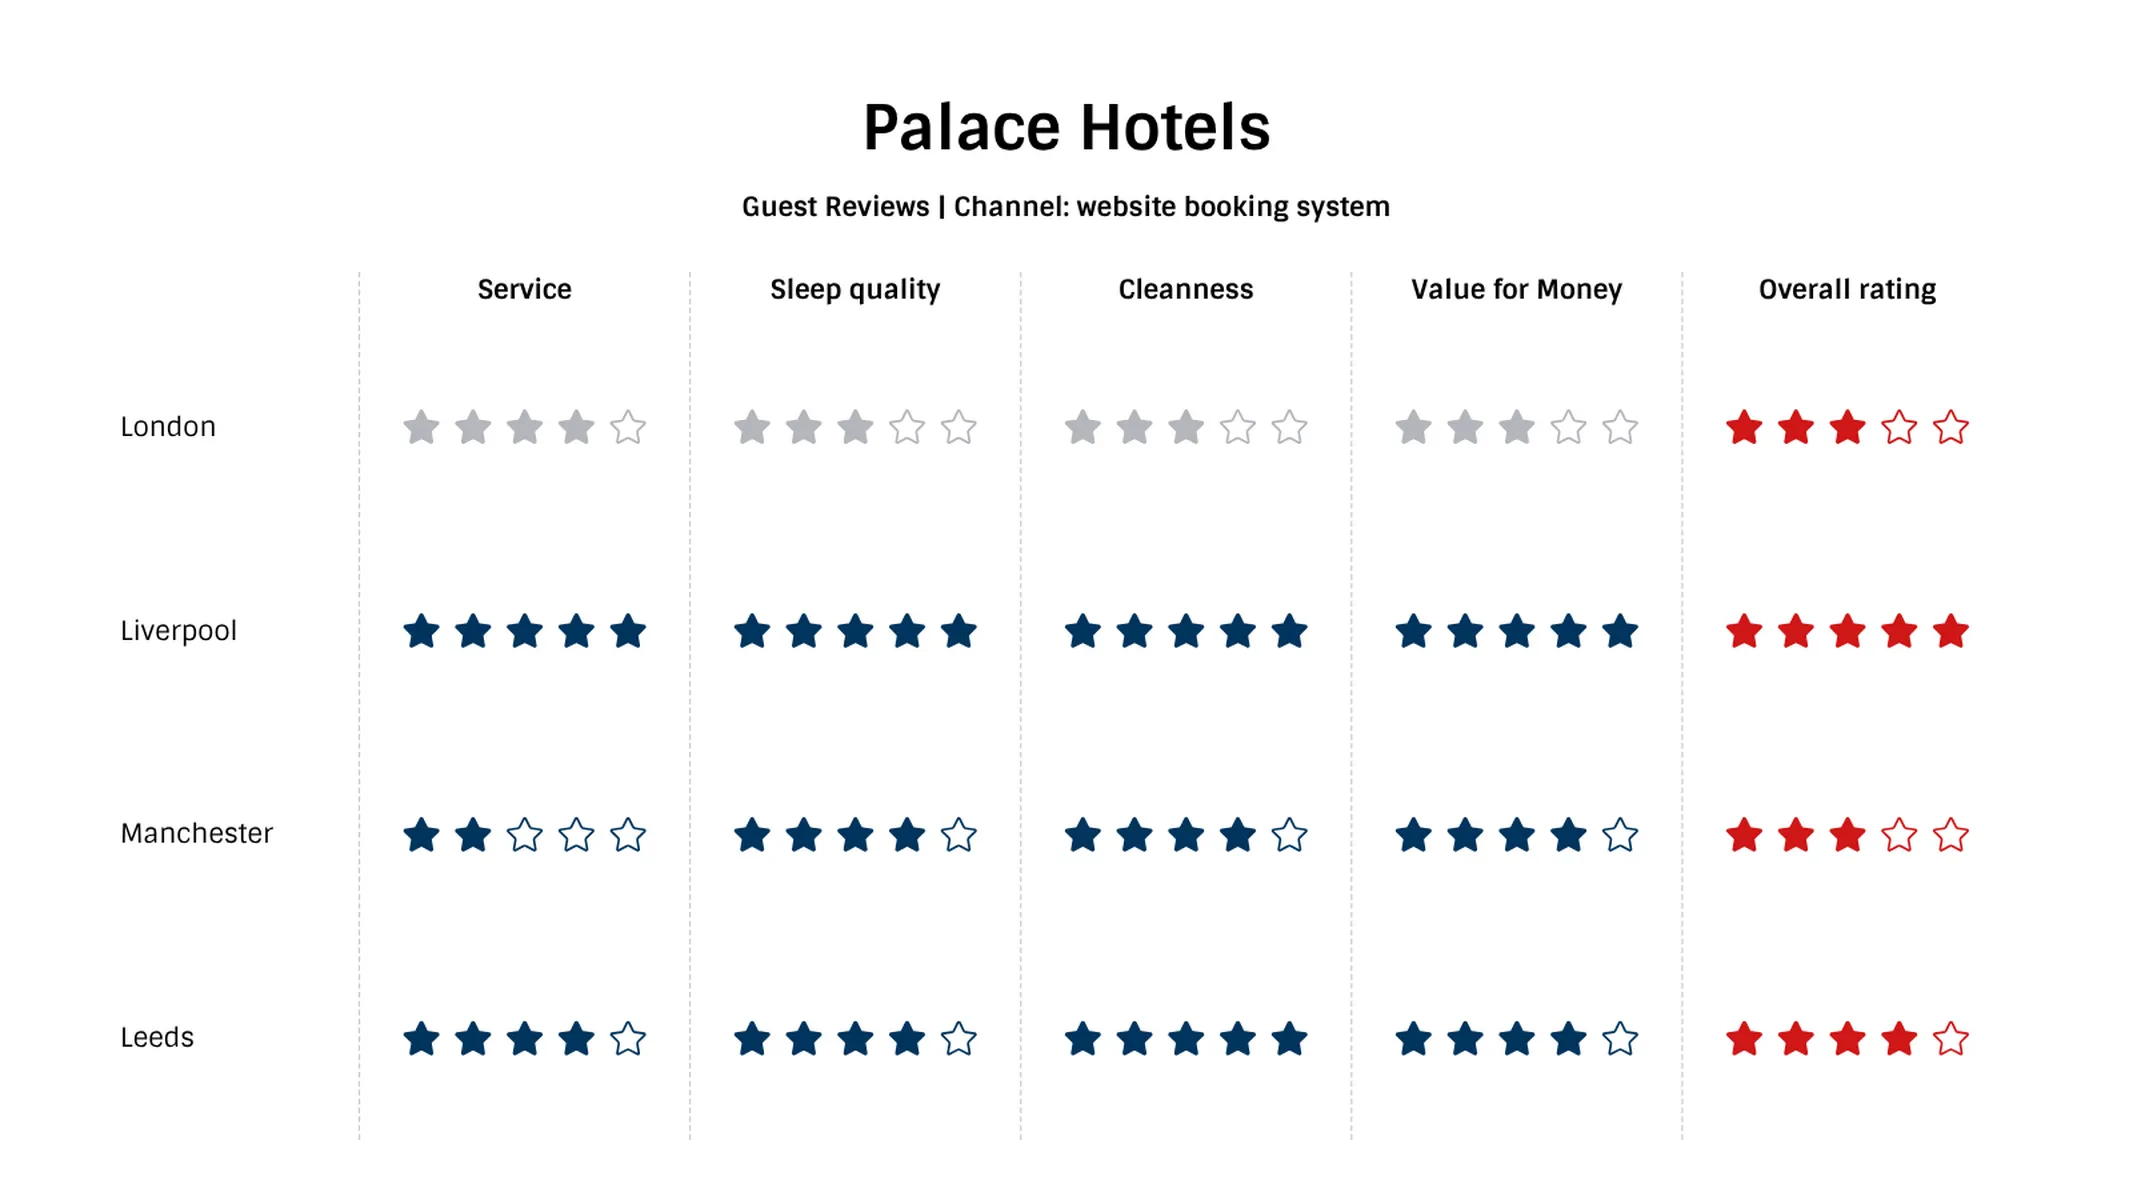
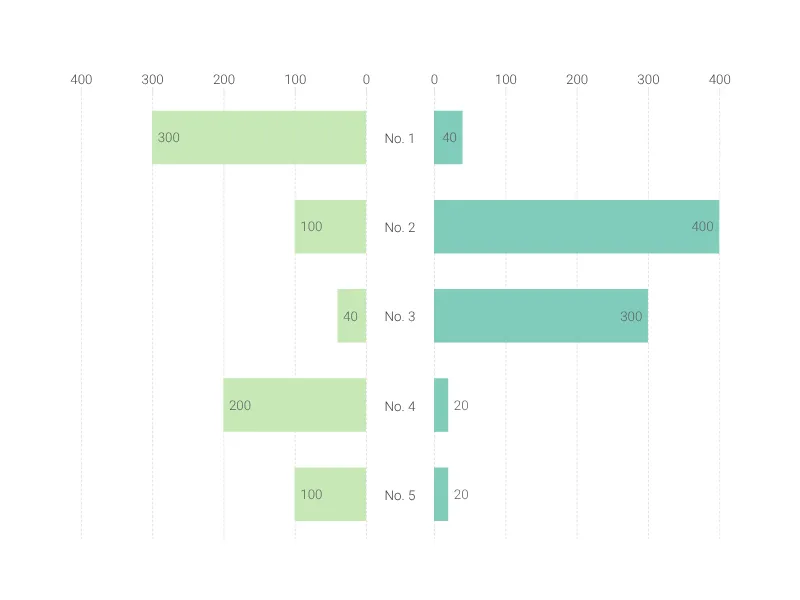
Use this table to compare product features or skills, and tell at a glance which option suits you best.
What is a comparison matrix?
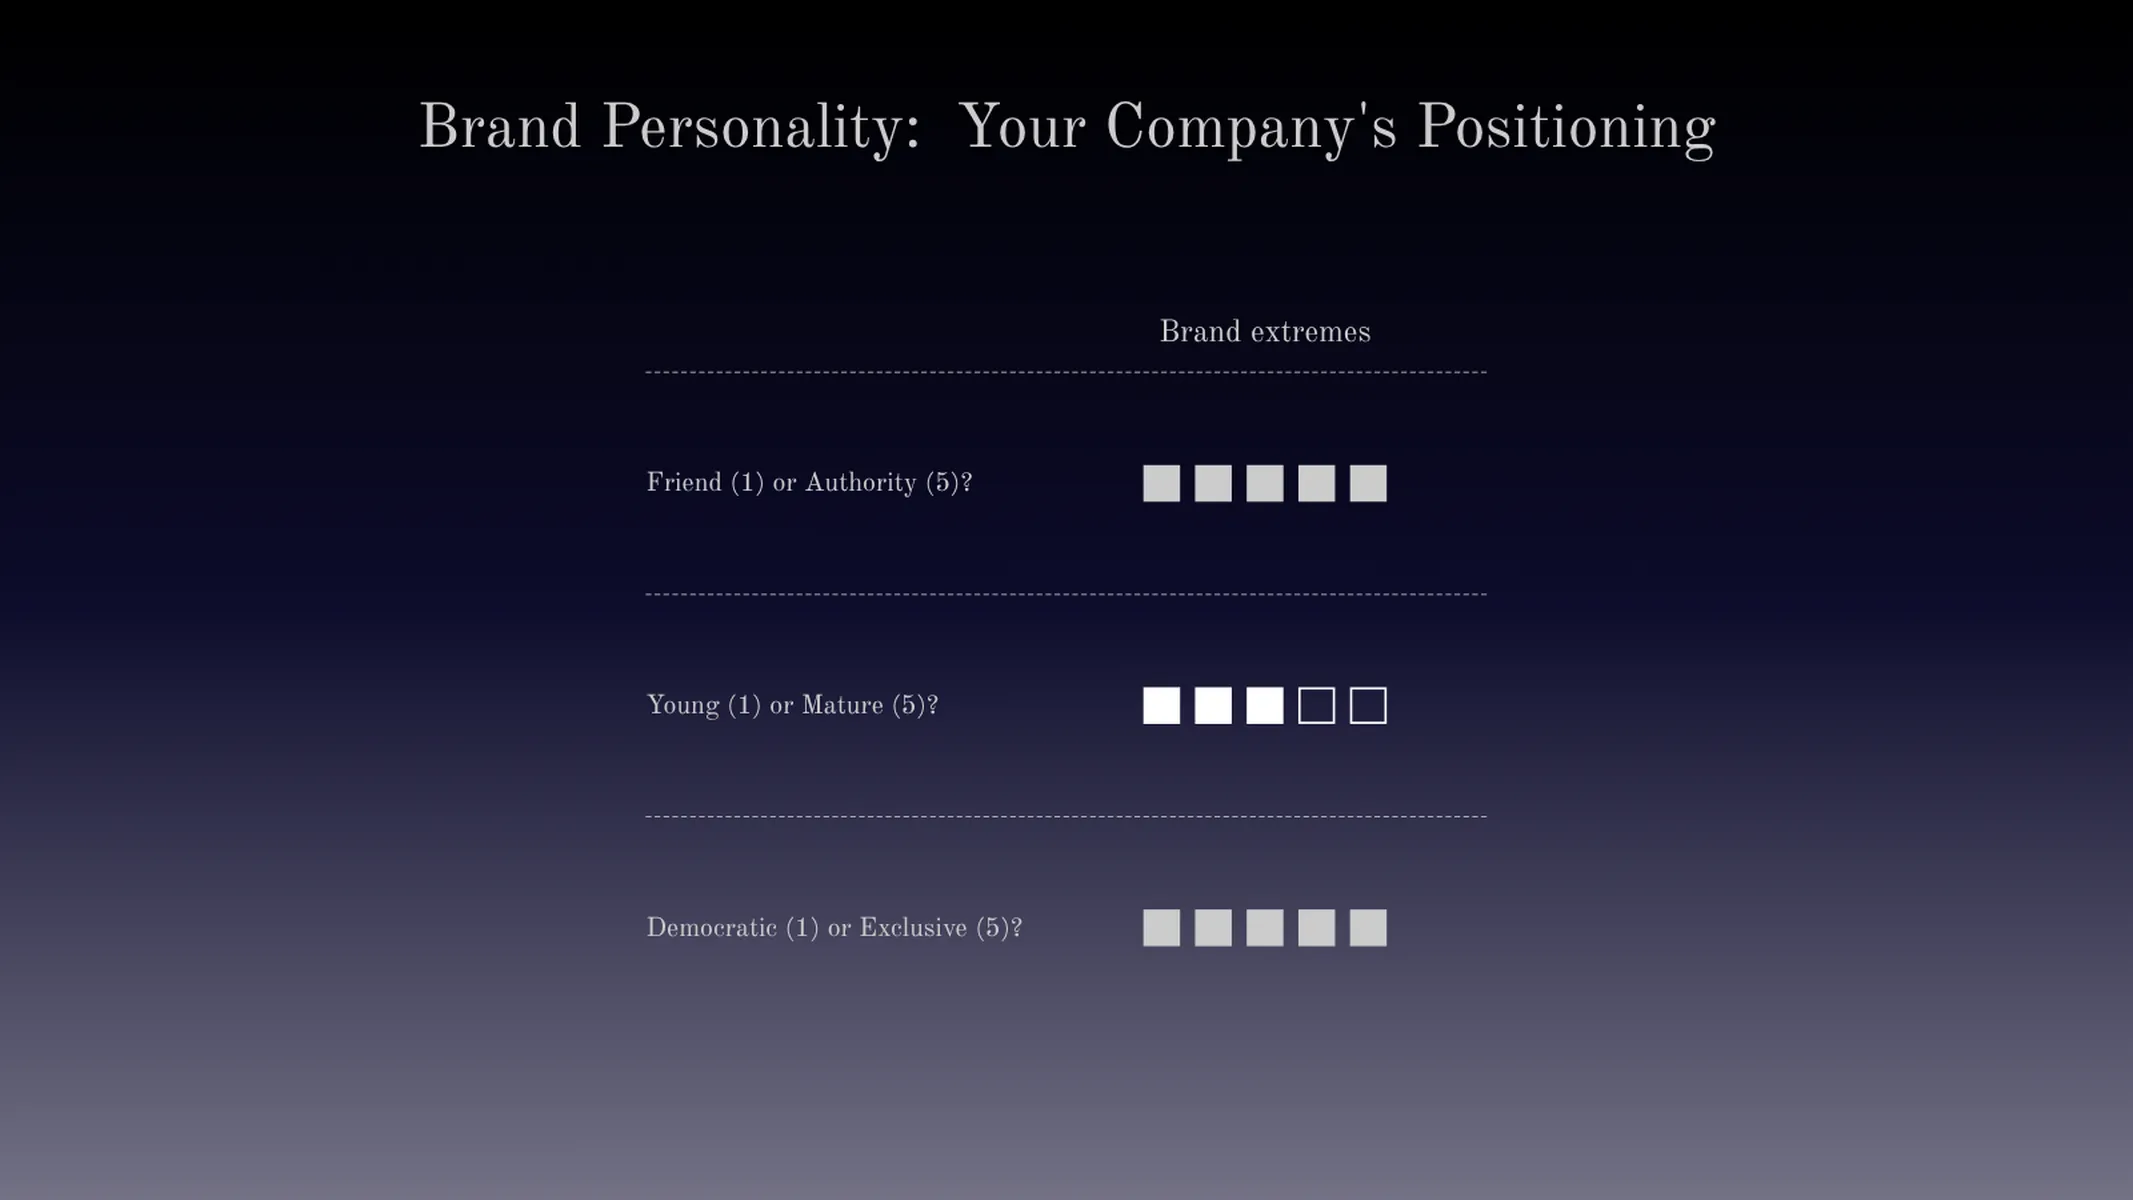
A comparison matrix is a great tool to visualize similarities and differences between products and services, or even between more complex and abstract concepts like strategies and ideas.
The matrix helps to organize and classify the elements in which you are comparing. The features and characteristics of each element are evaluated according to a set of criteria/standards, enabling the easy recognition of their pros and cons in order to facilitate the decision making process.
How to make a comparison matrix with Vizzlo?
Quickly create a great-looking and clear side-by-side comparison online!
- Choose your favorite rating style and preferred rating scale, on the tab “APPEARANCE” of the sidebar.
- Click on any element to start editing it.
- Alternatively, use its respective cards in the sidebar as a support to change values and colors; or click on the button “EDIT DATA IN SPREADSHEET” to copy and paste your data. com
- Explore the other customization possibilities of the “APPEARANCE” tab to choose or customize a theme.
Comparison matrix maker: key features
- Custom rating style
- Adjustable rating scale
- Custom colors and fonts
- Optional grid
Comparison Matrix: What's new?
Comparison Matrix Alternatives
Enhance your productivity
Create a Comparison Matrix directly in the tools you love

Create a Comparison Matrix in PowerPoint with
Vizzlo's add-in

Loved by professionals around the world


Visualizations your audience won’t forget
Convey abstract concepts and data with professionally designed
charts and graphics you can easily edit and customize.