Chart Vizzard
Vizzlo's AI-based chart generatorCreate your Feedback Loop in seconds
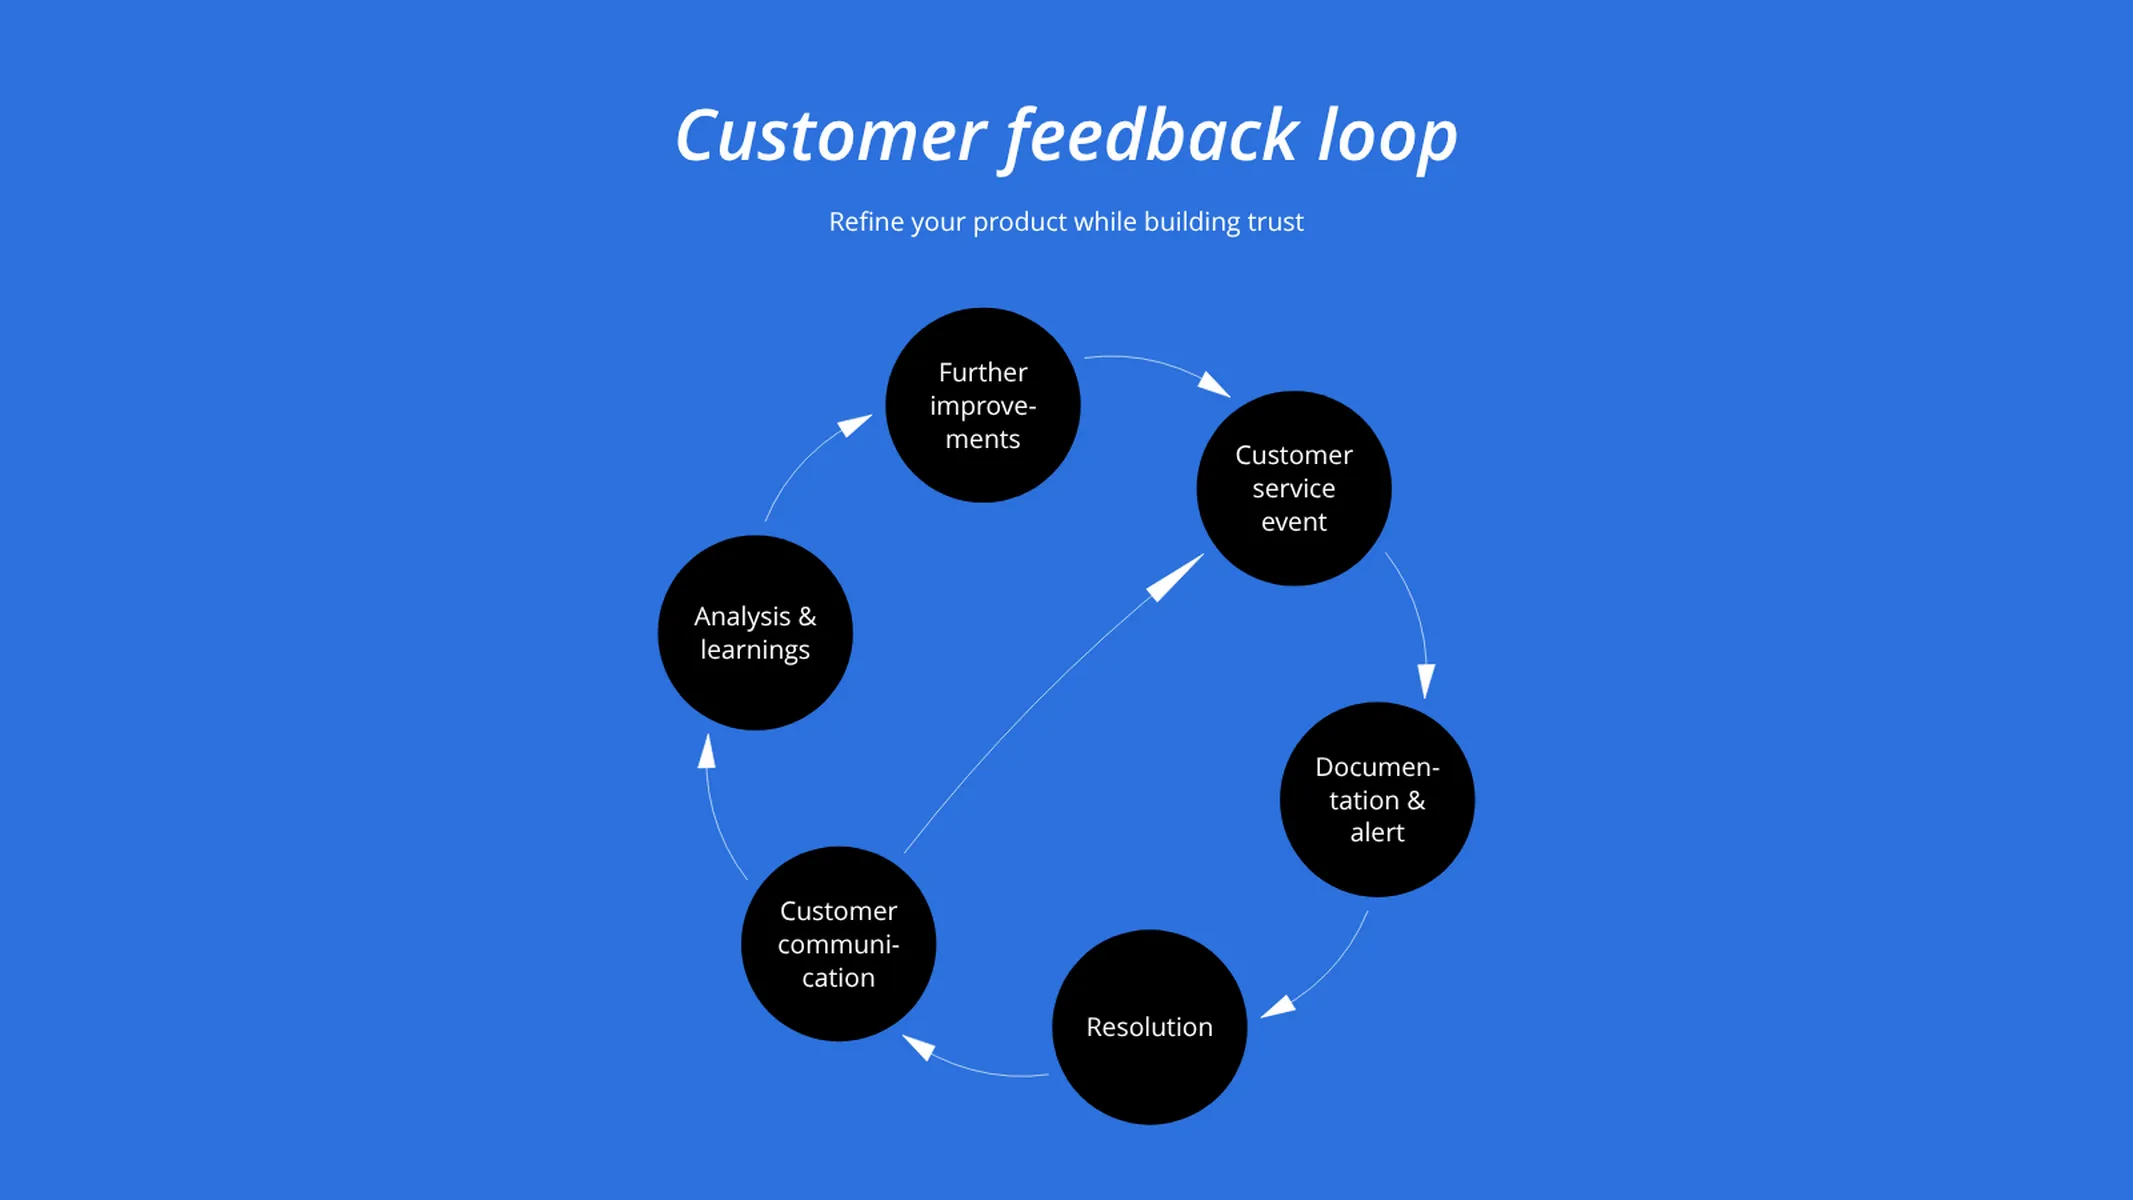
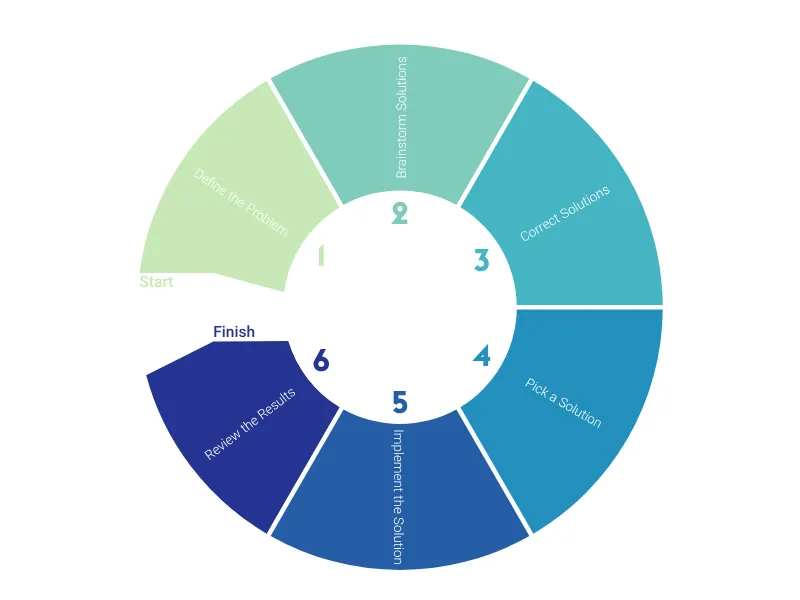
A circular diagram to visualize project and feedback processes.
Create your chart in 3 simple steps
- Create new Feedback Loop
- Add your data
- Export or share
Why Vizzlo?
- Create professional charts in seconds
- Fully customizable, no design skills needed
- Create directly in PowerPoint & Google Slides
What is a feedback loop?
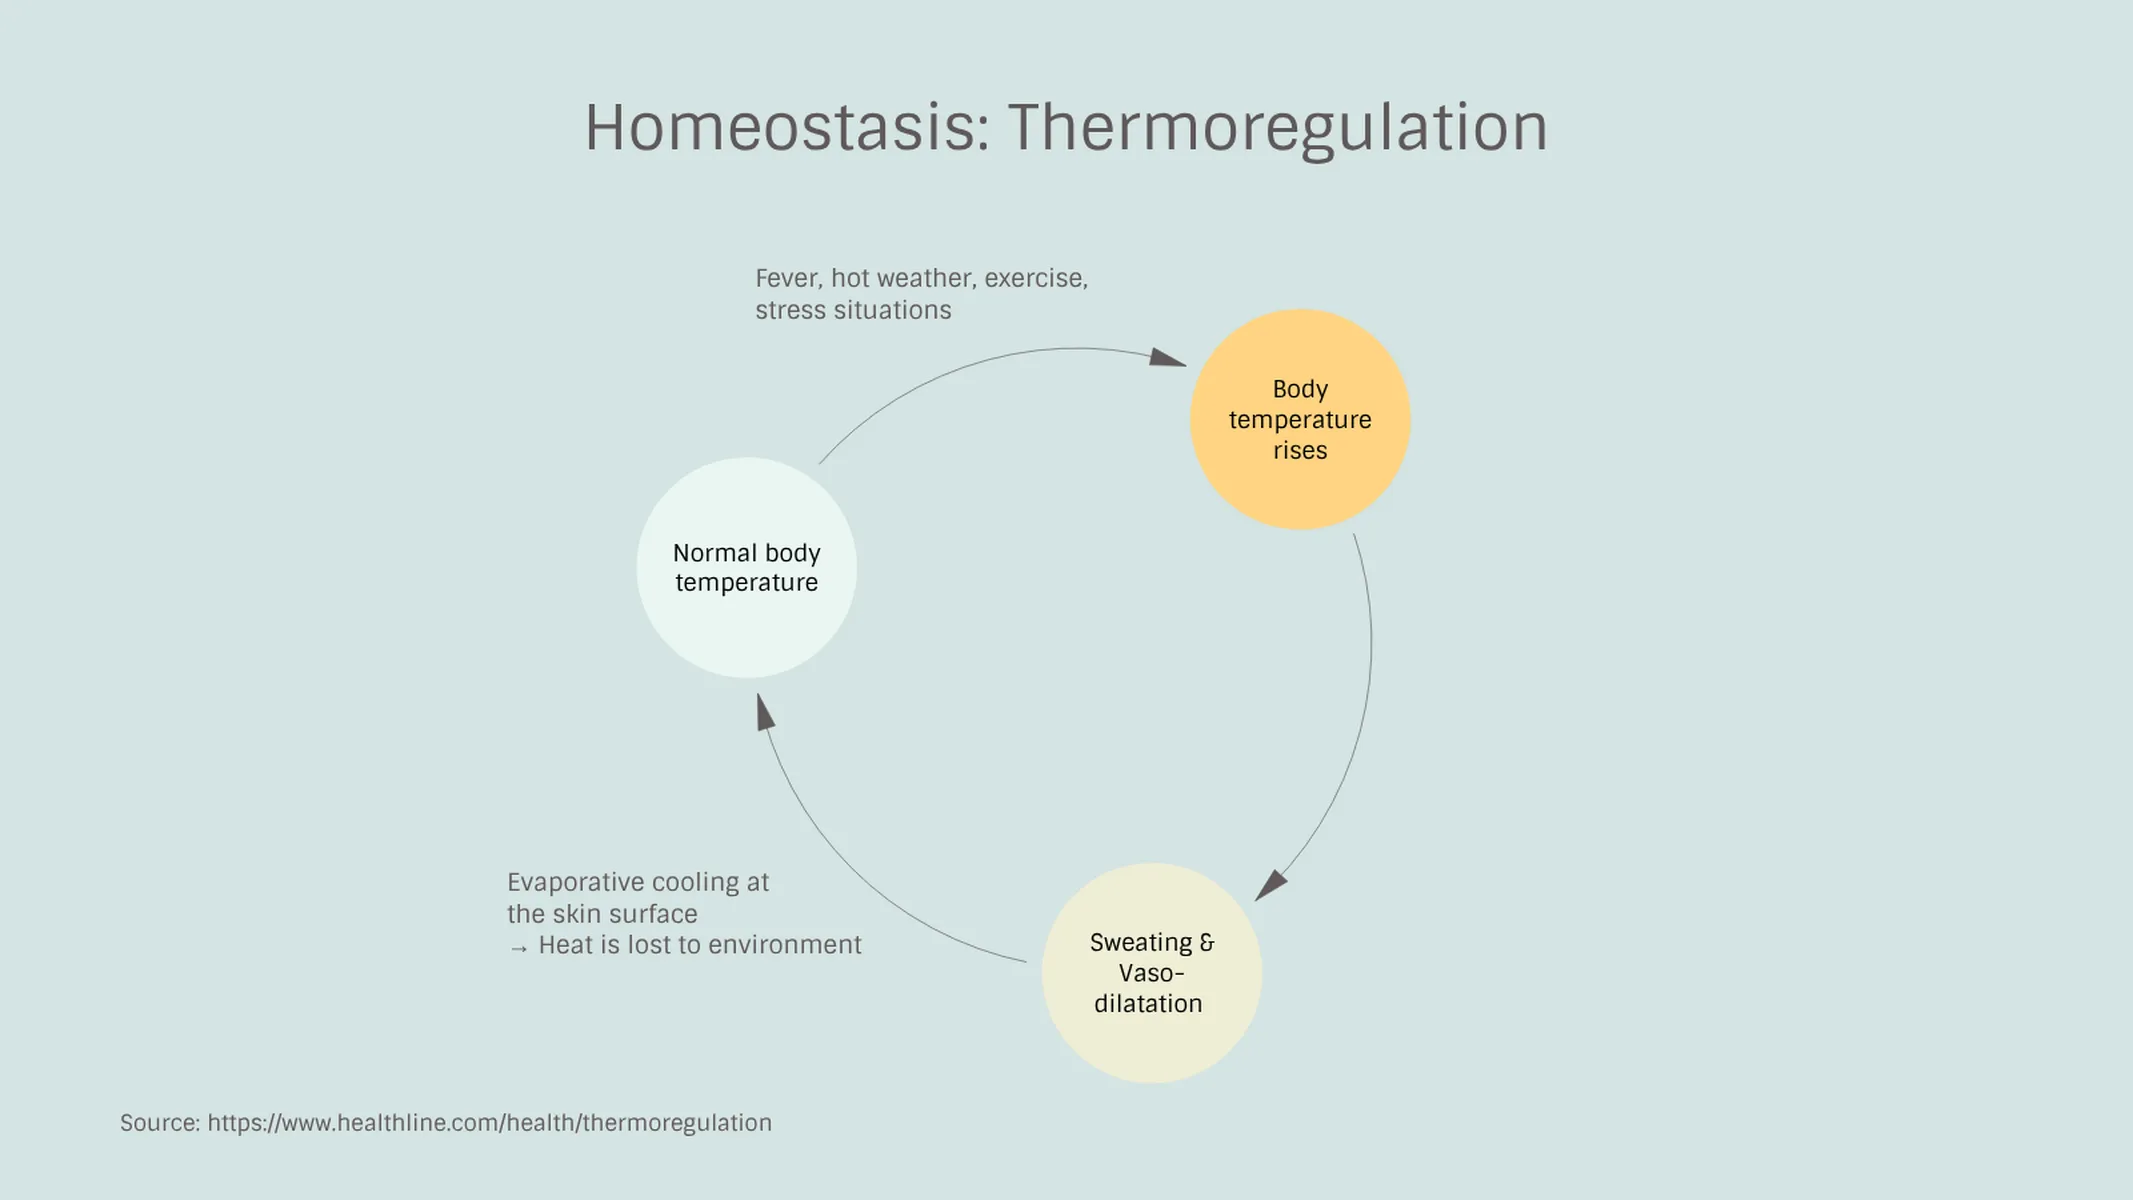
A feedback loop is a circular process, in which part of its output serves as input for the recurring cycle. It’s often used to systematize and visualize processes in a myriad of areas, including biology, education, and business.
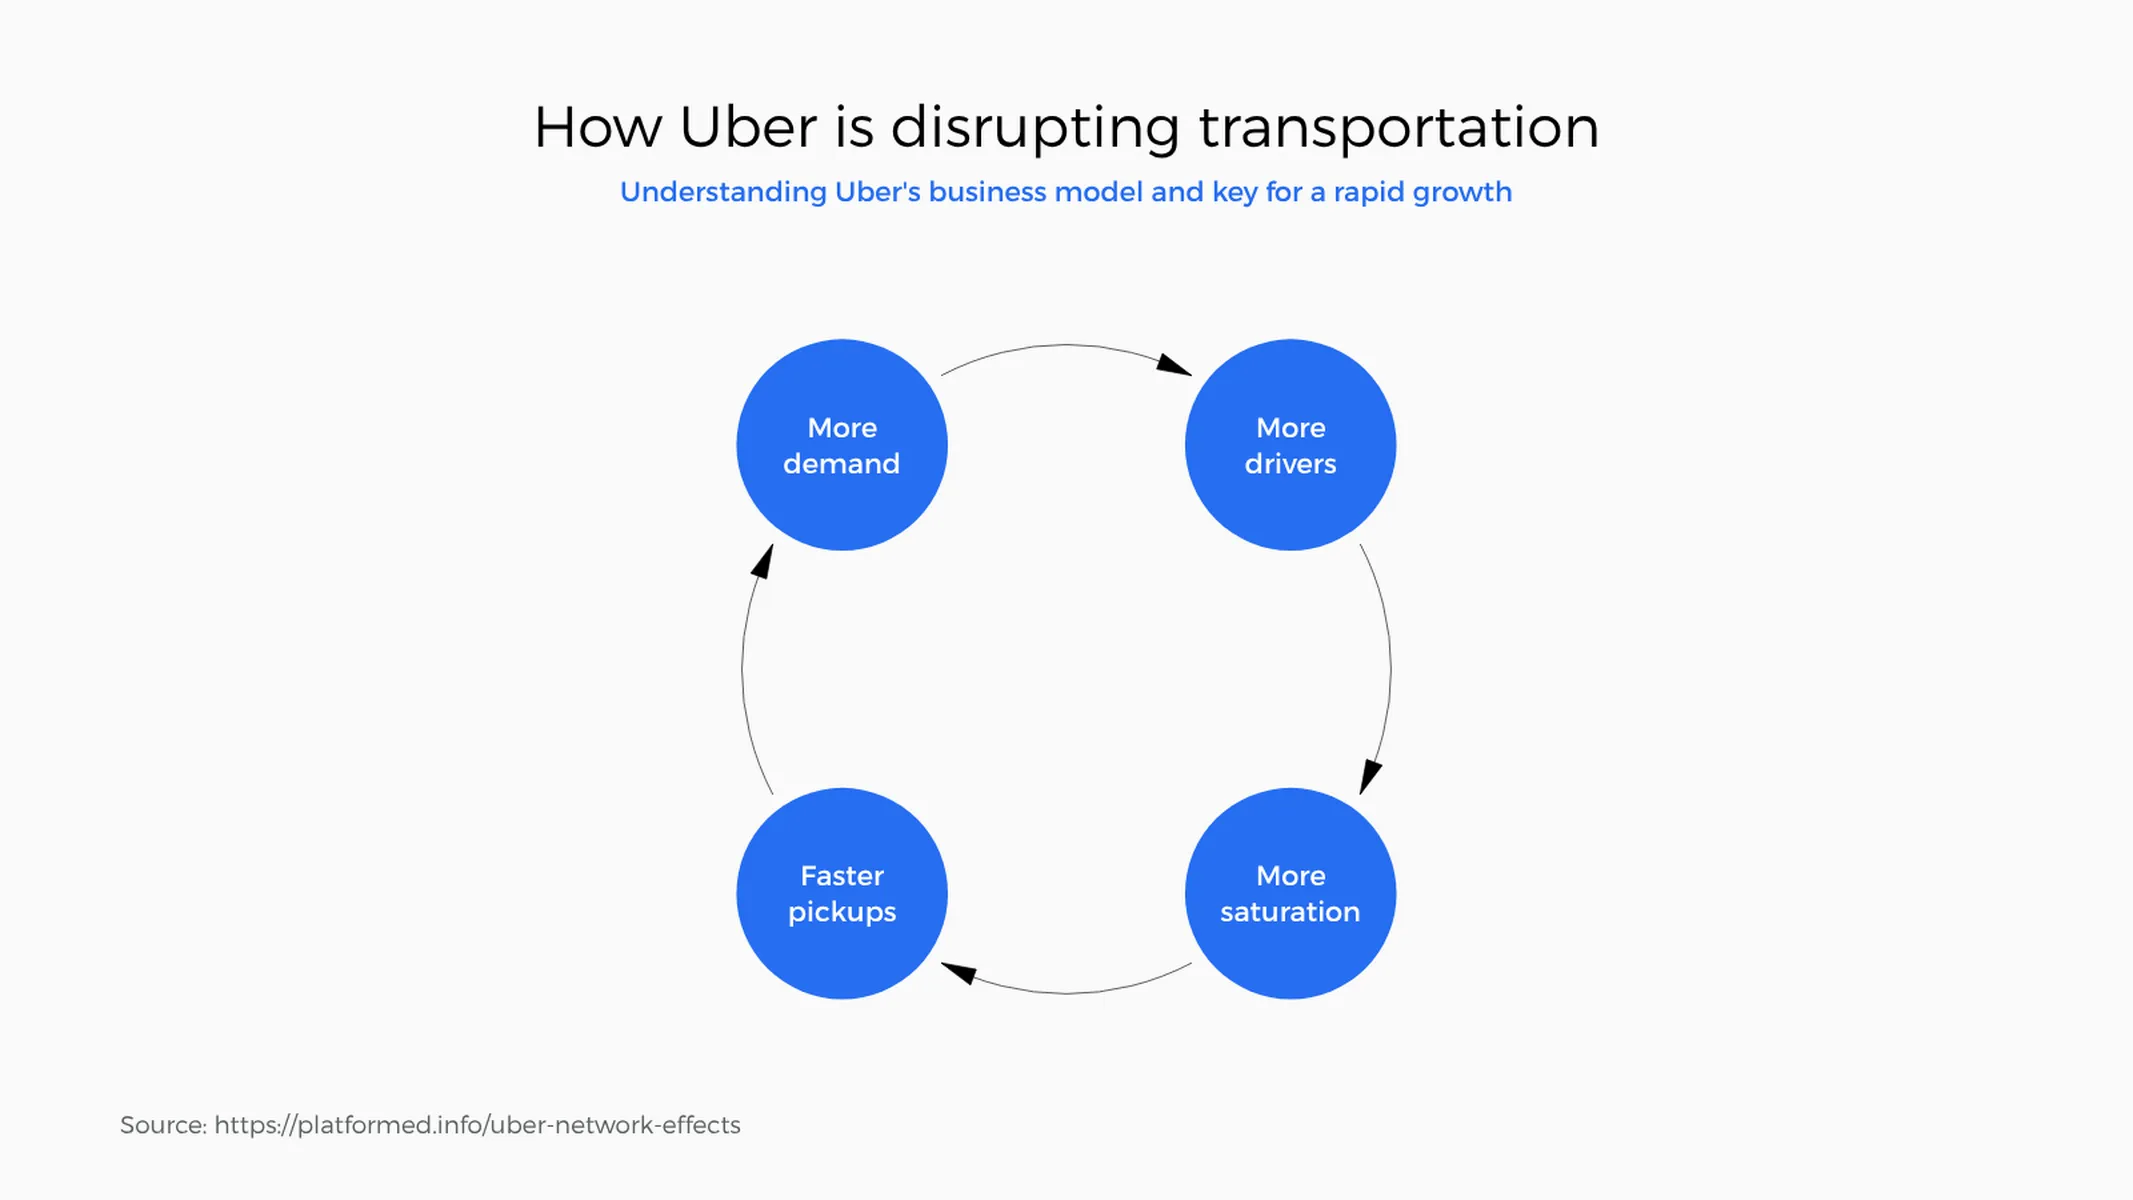
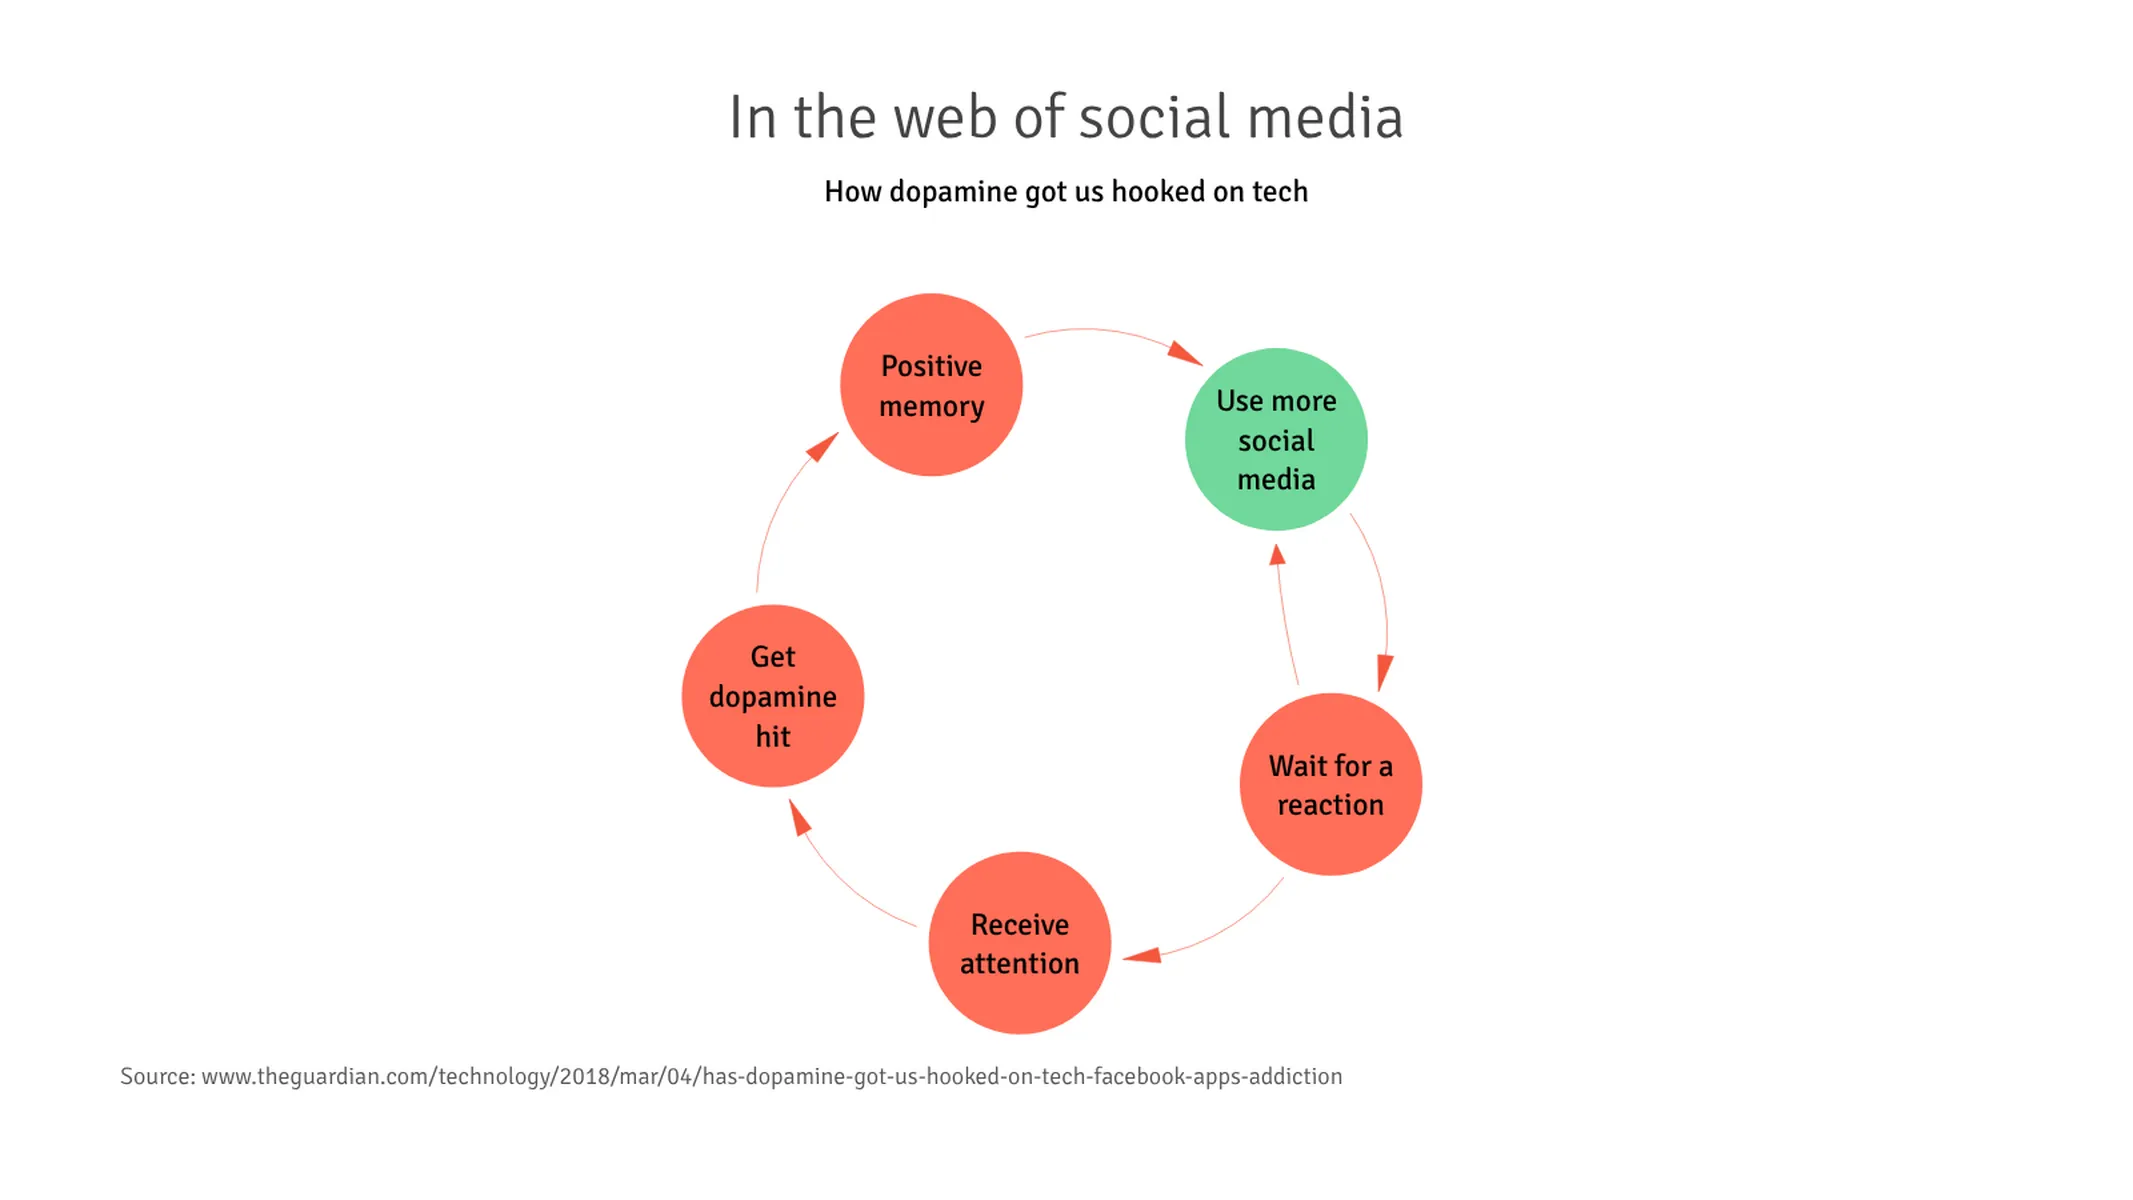
A feedback loop can be defined as positive or negative, depending on whether the outcomes of the process amplify the system, leading to an increase for the next cycle, or reduce it, leading to a decrease.
The concept of feedback, especially in education and business—be it in customer care, or employee/student feedback—is a synonym for an ongoing learning process and a key mechanism for performance improvement. However, regardless of the area, the logic behind it does not change: a circular causality/a self-closing chain of cause-and-effect.
Vizzlo’s feedback loop diagram helps you to visualize this chain, namely the outputs that along with a process, are routed back as inputs. This visualization is crucial to communicate phases, and understand circular processes, as well as to facilitate decision making.
How to make a feedback loop with Vizzlo?
Vizzlo’s feedback loop is straightforward to create: simply enter your phases!
- Click on the phases to edit them
- Use the active cards to set colors and choose if the selected phase should already feedback the cycle
- Use the ”+” handles to add new phases to your diagram
- Drag and drop the circles to reorder them
- Explore all themes, and customize fonts and colors in the “APPEARANCE” tab.
Feedback loop maker: key features
- Custom fonts and colors
- Up to eight phases
Feedback Loop: What's new?
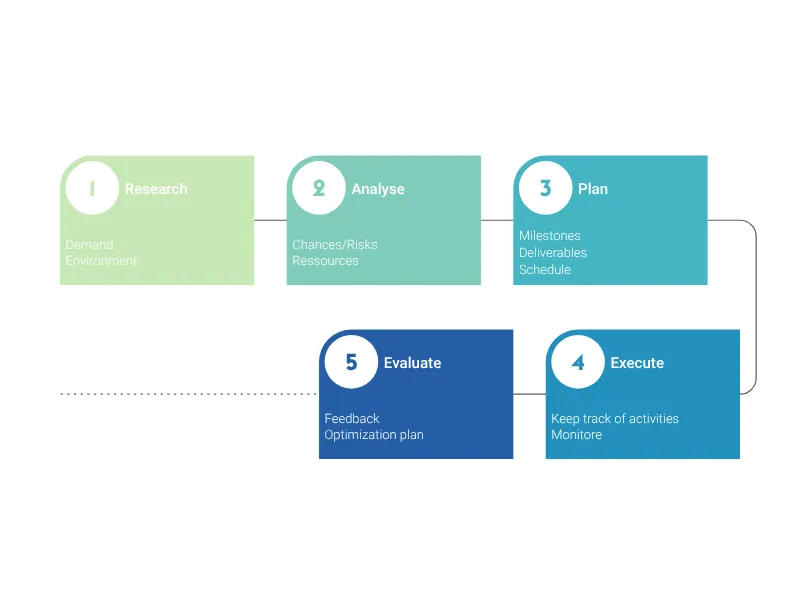
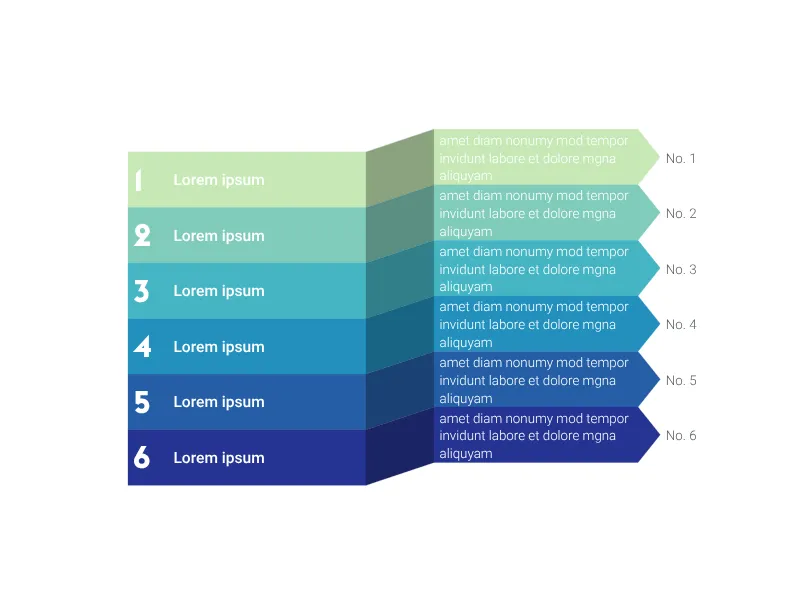
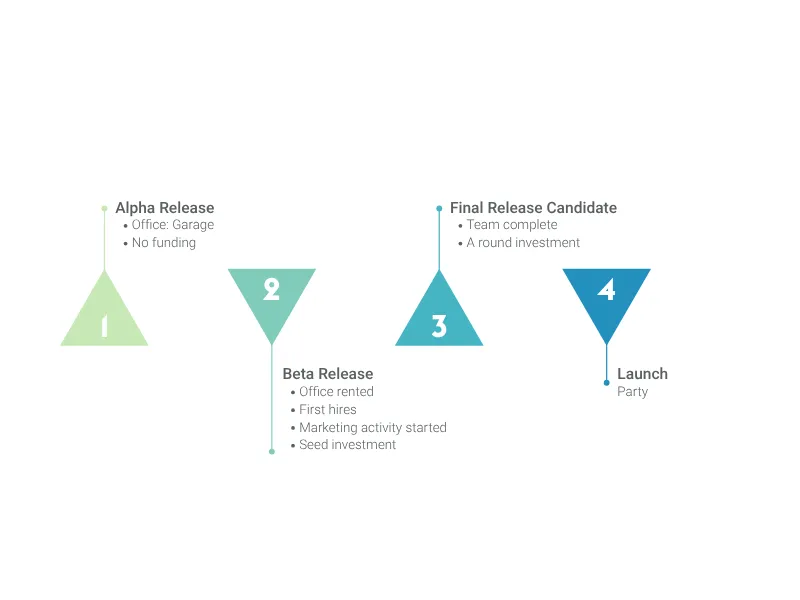
Feedback Loop Alternatives
Enhance your productivity
Create a Feedback Loop directly in the tools you love

Create a Feedback Loop in PowerPoint with
Vizzlo's add-in

Loved by professionals around the world


Visualizations your audience won’t forget
Convey abstract concepts and data with professionally designed
charts and graphics you can easily edit and customize.