Chart Vizzard
Vizzlo's AI-based chart generatorProject Phase Chart
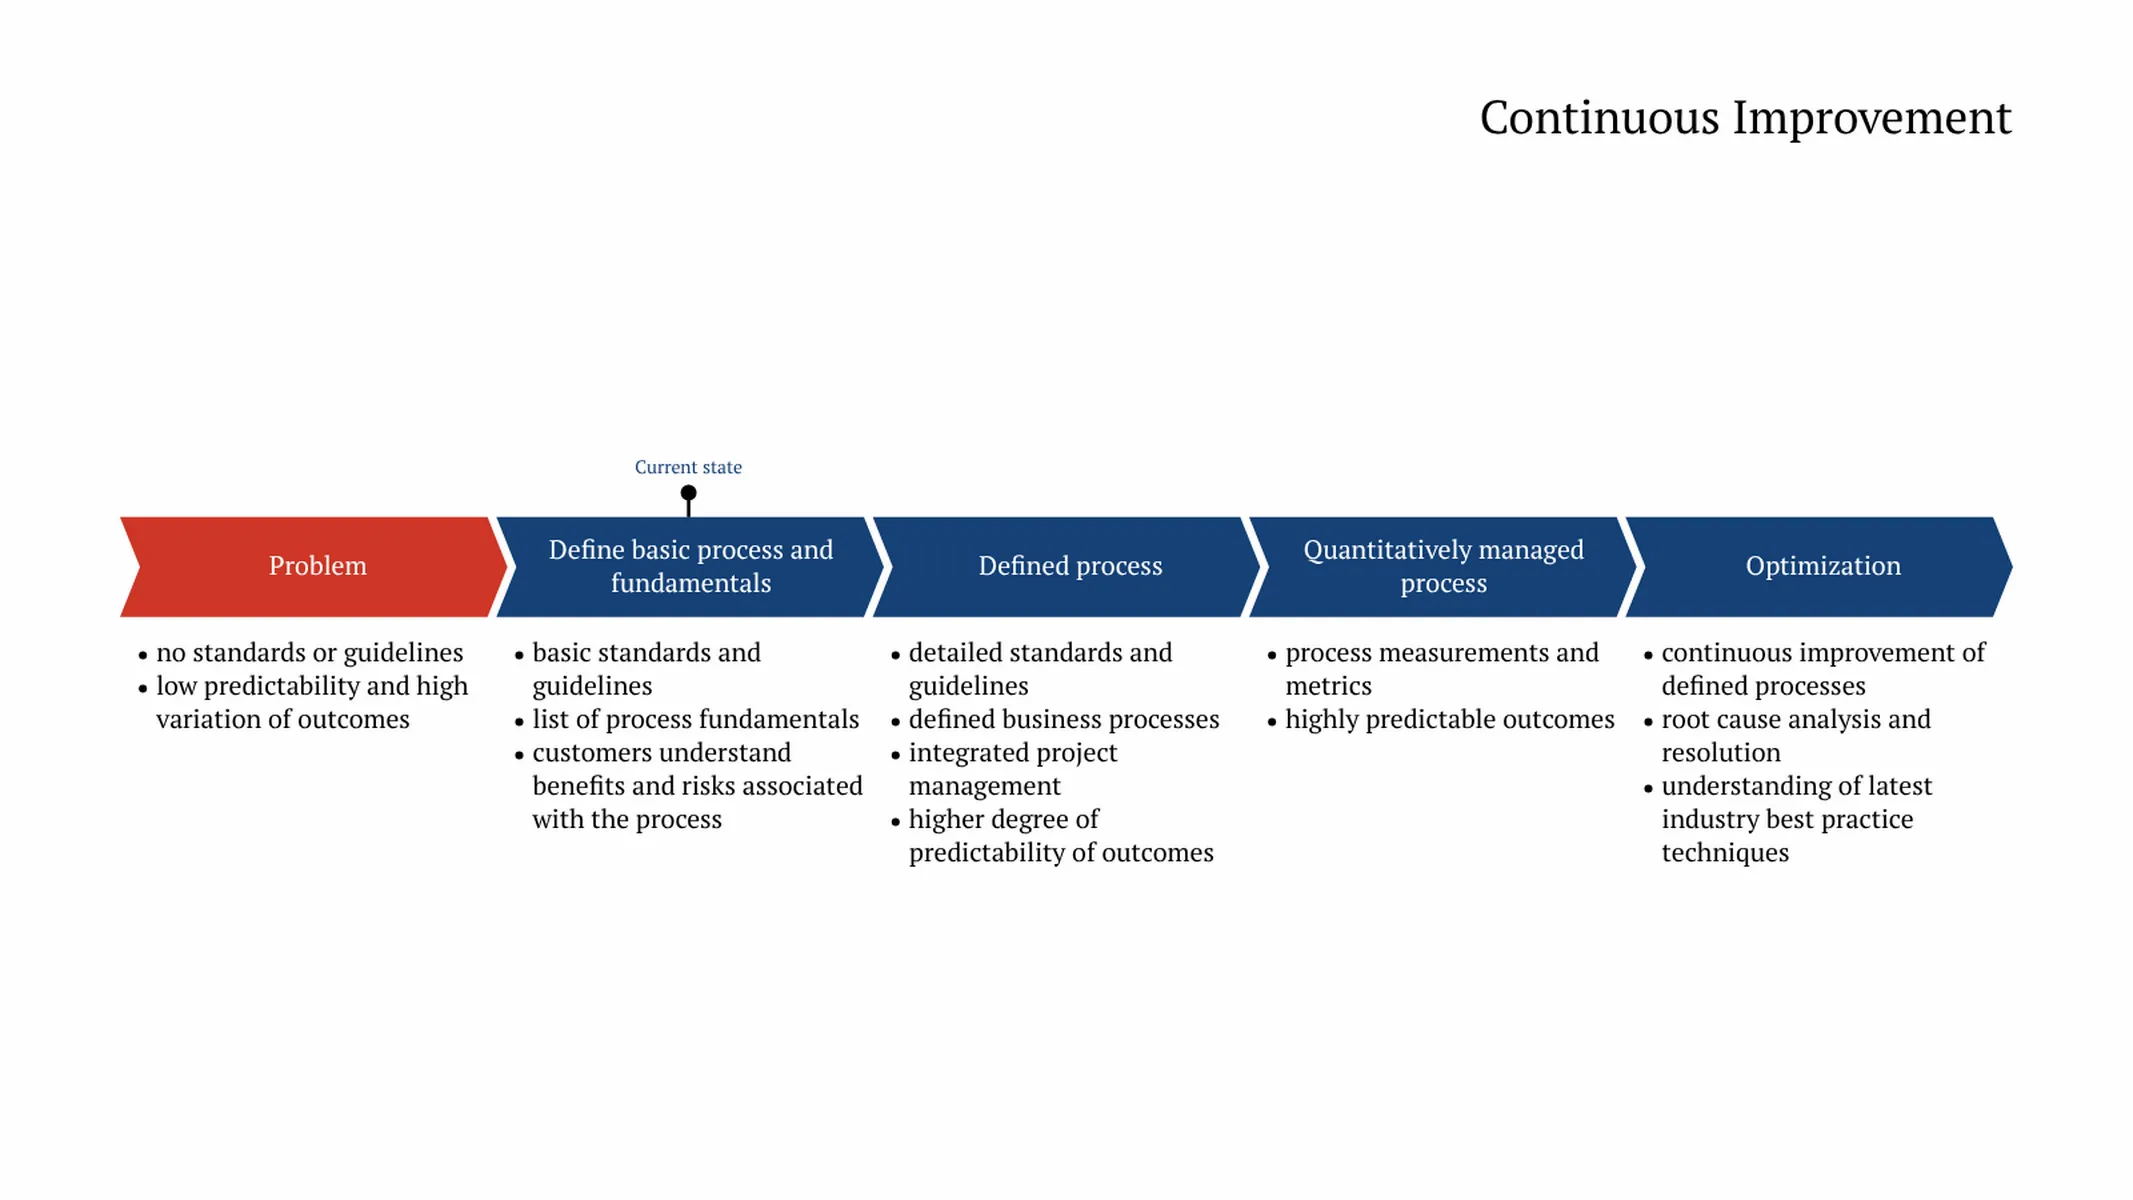
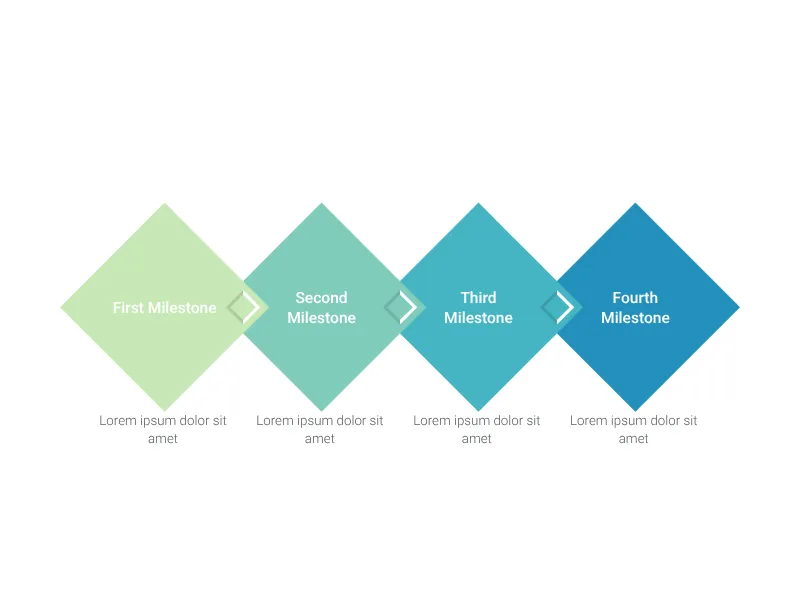
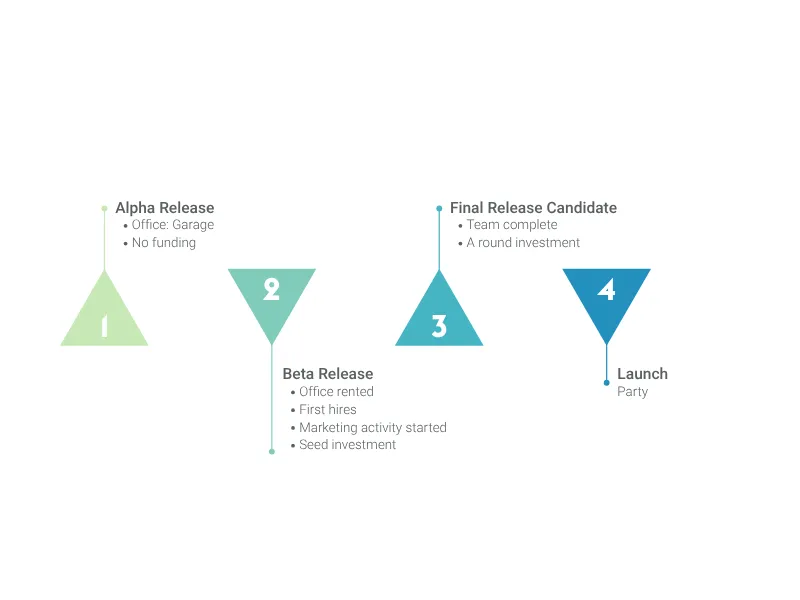
A chevron chart to visualize the whole life cycle of your project, detailing its phases and processes/activities.
What is a project phase chart?
A project phase chart (also known as process chart) is a detailed chevron list to visualize sequential project phases or process flows.
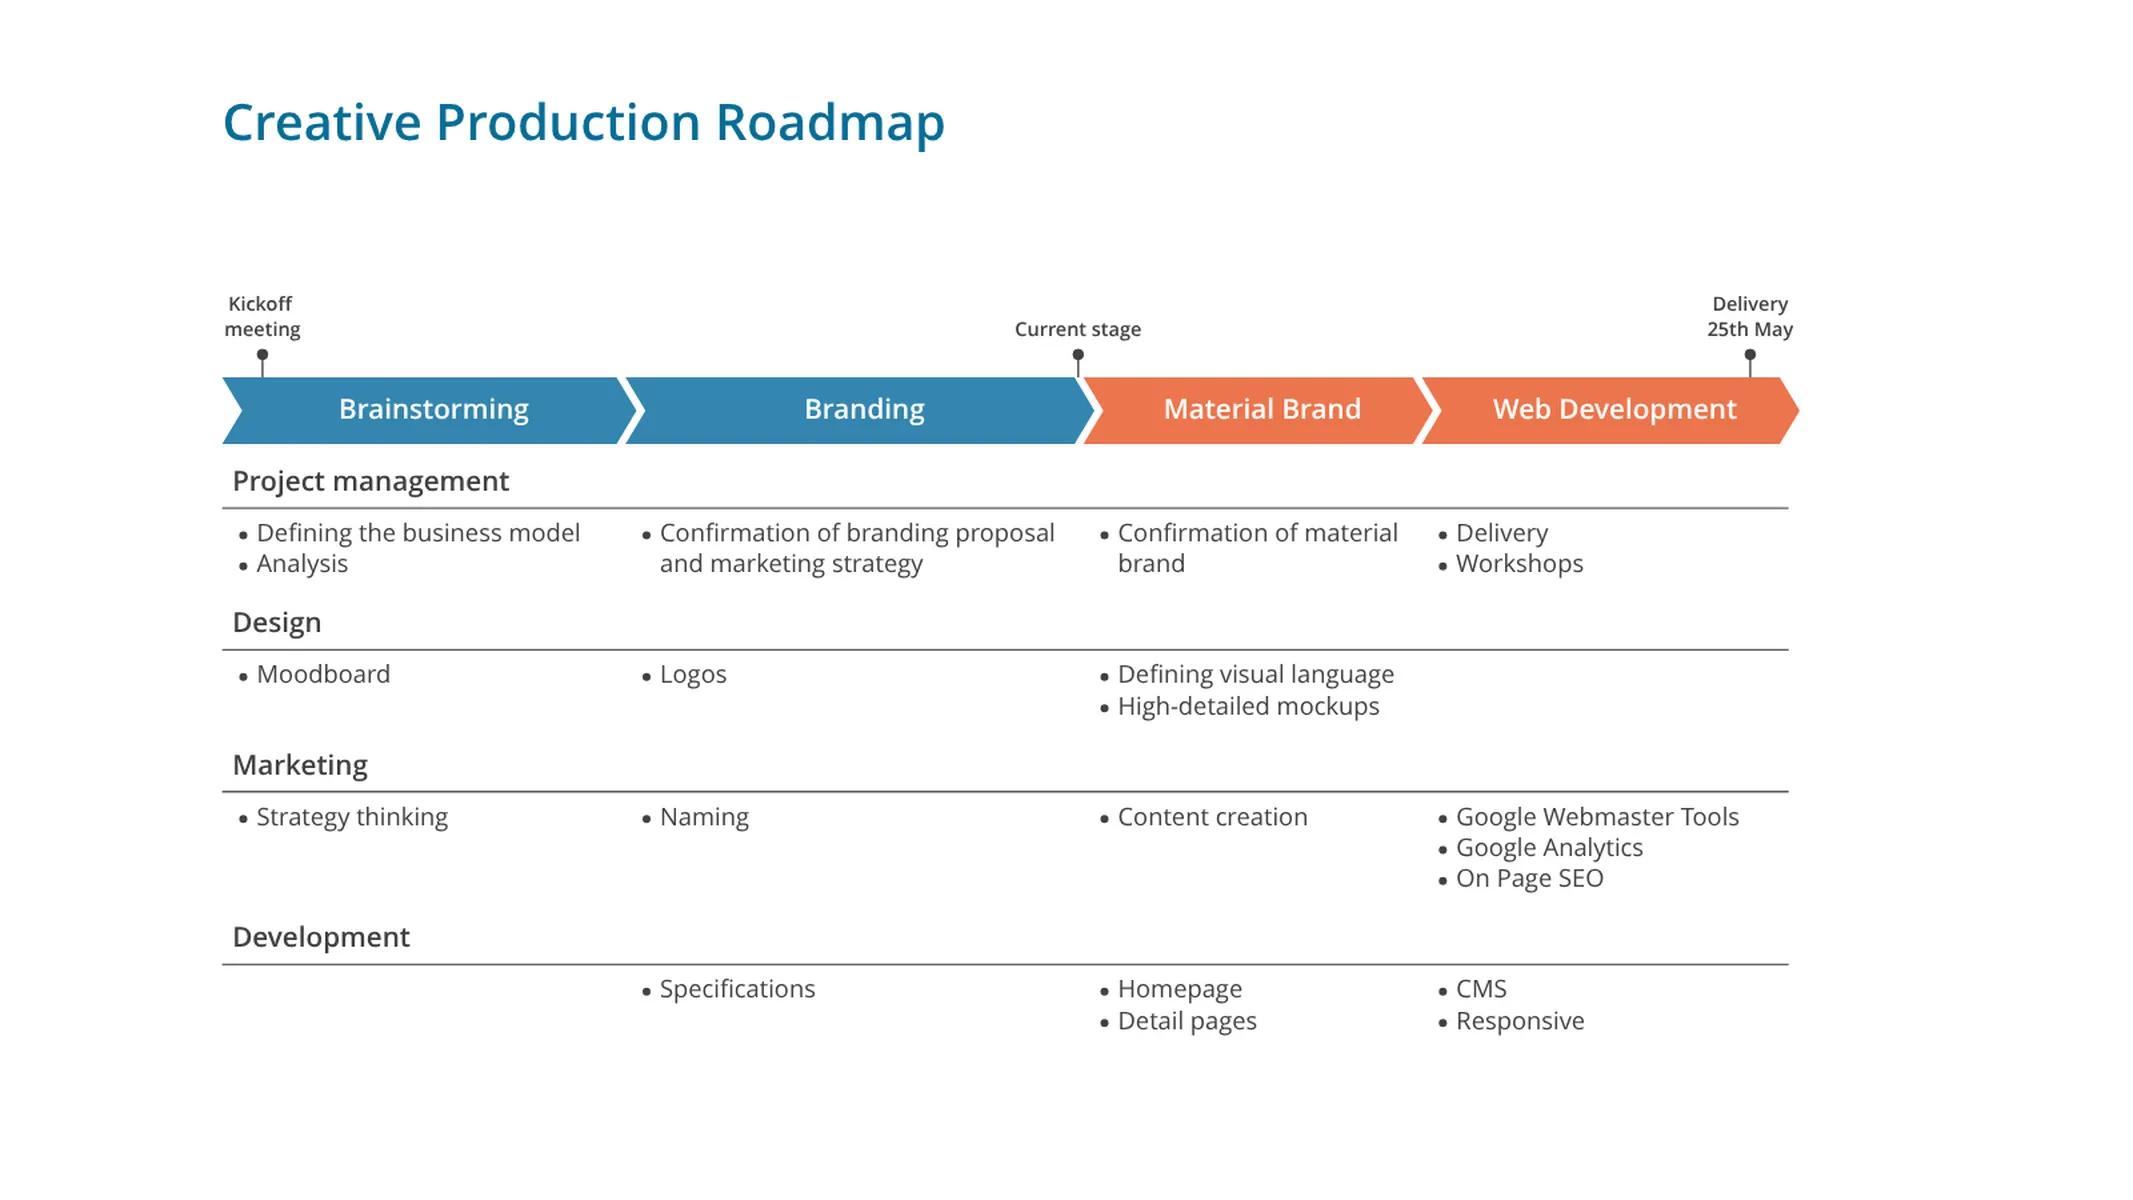
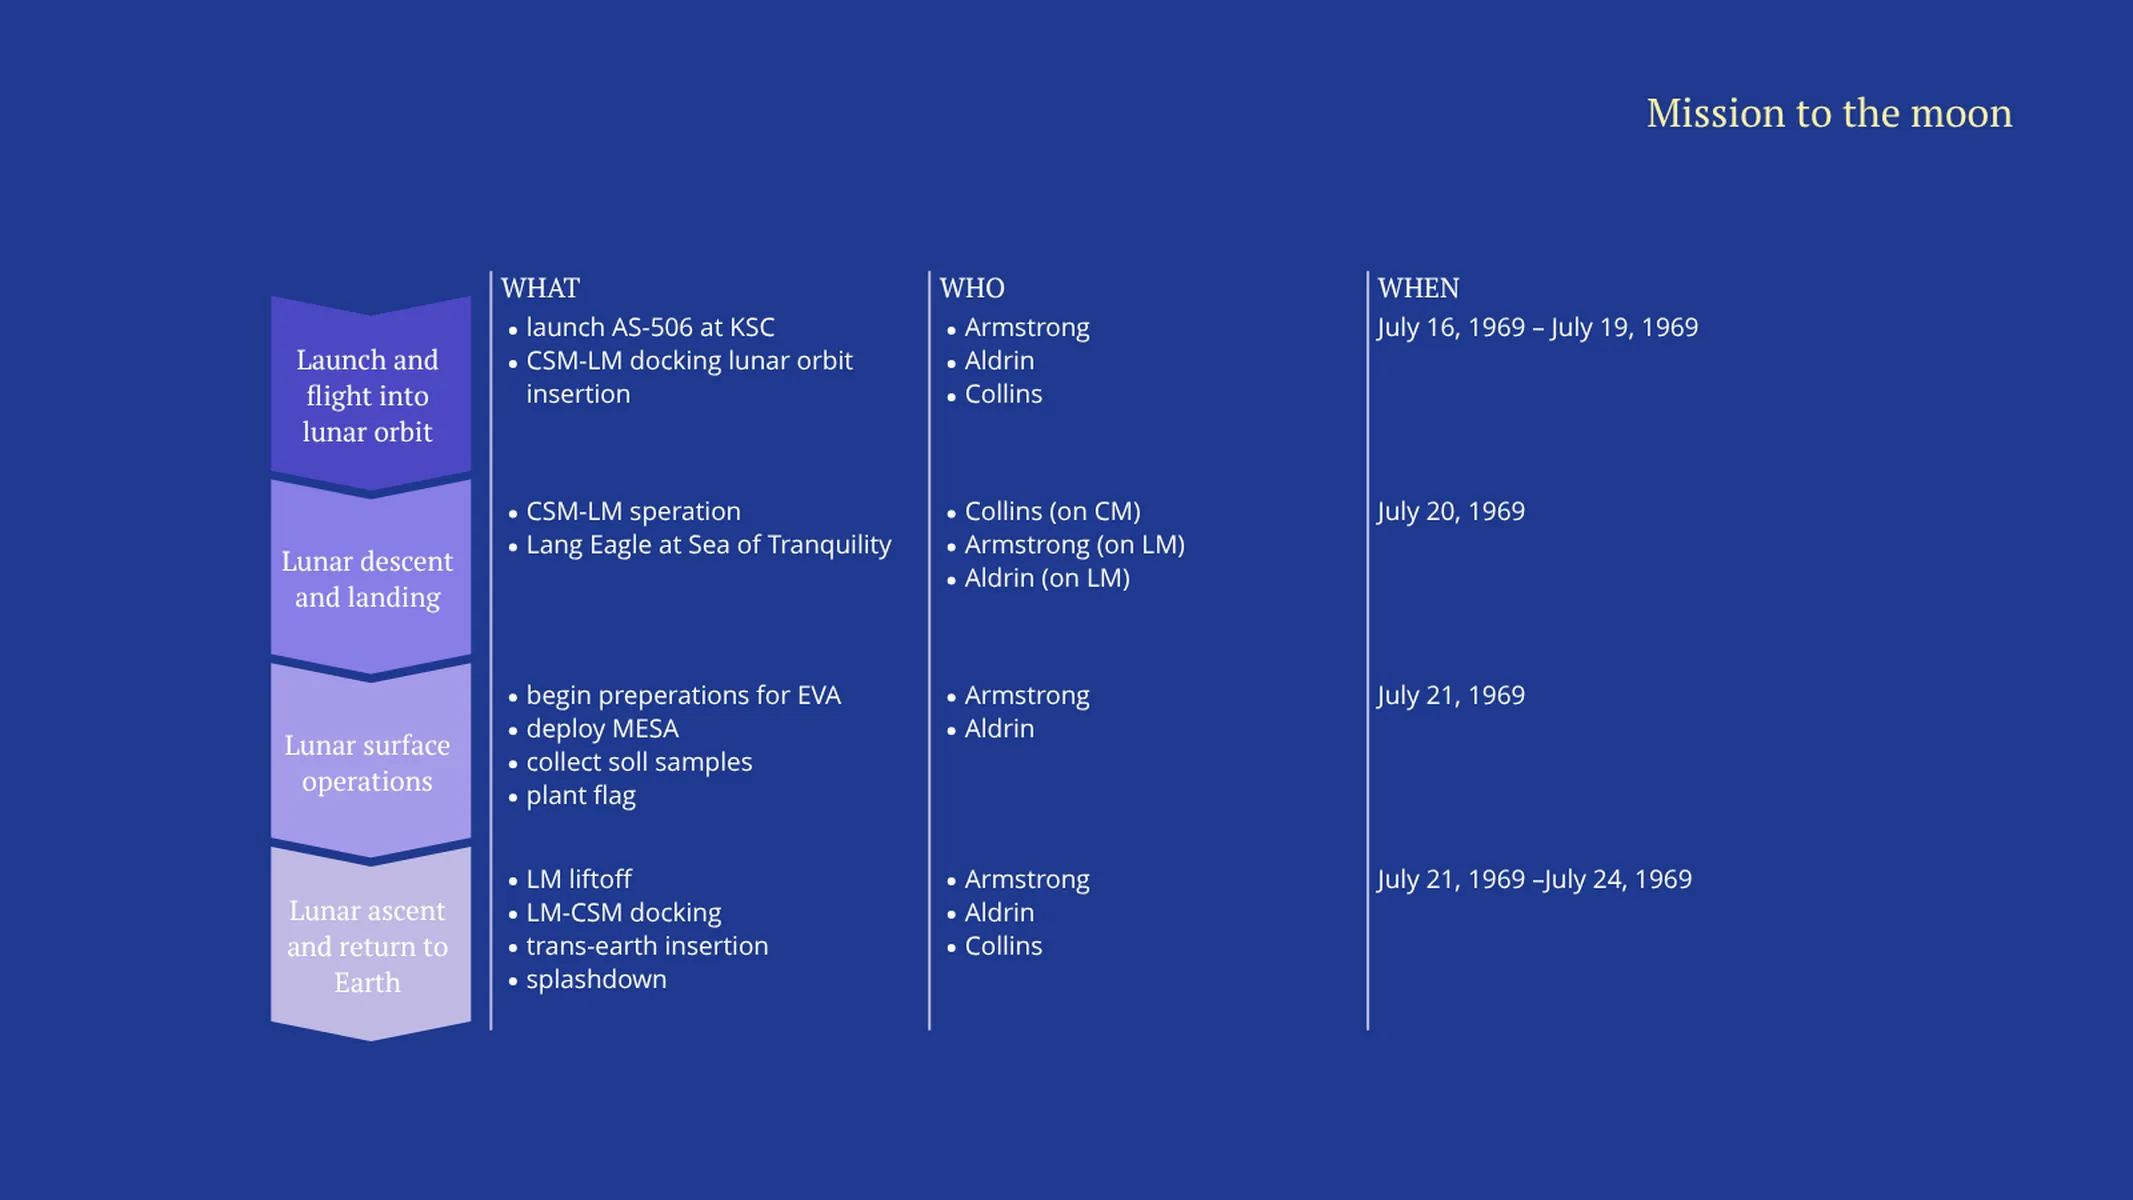
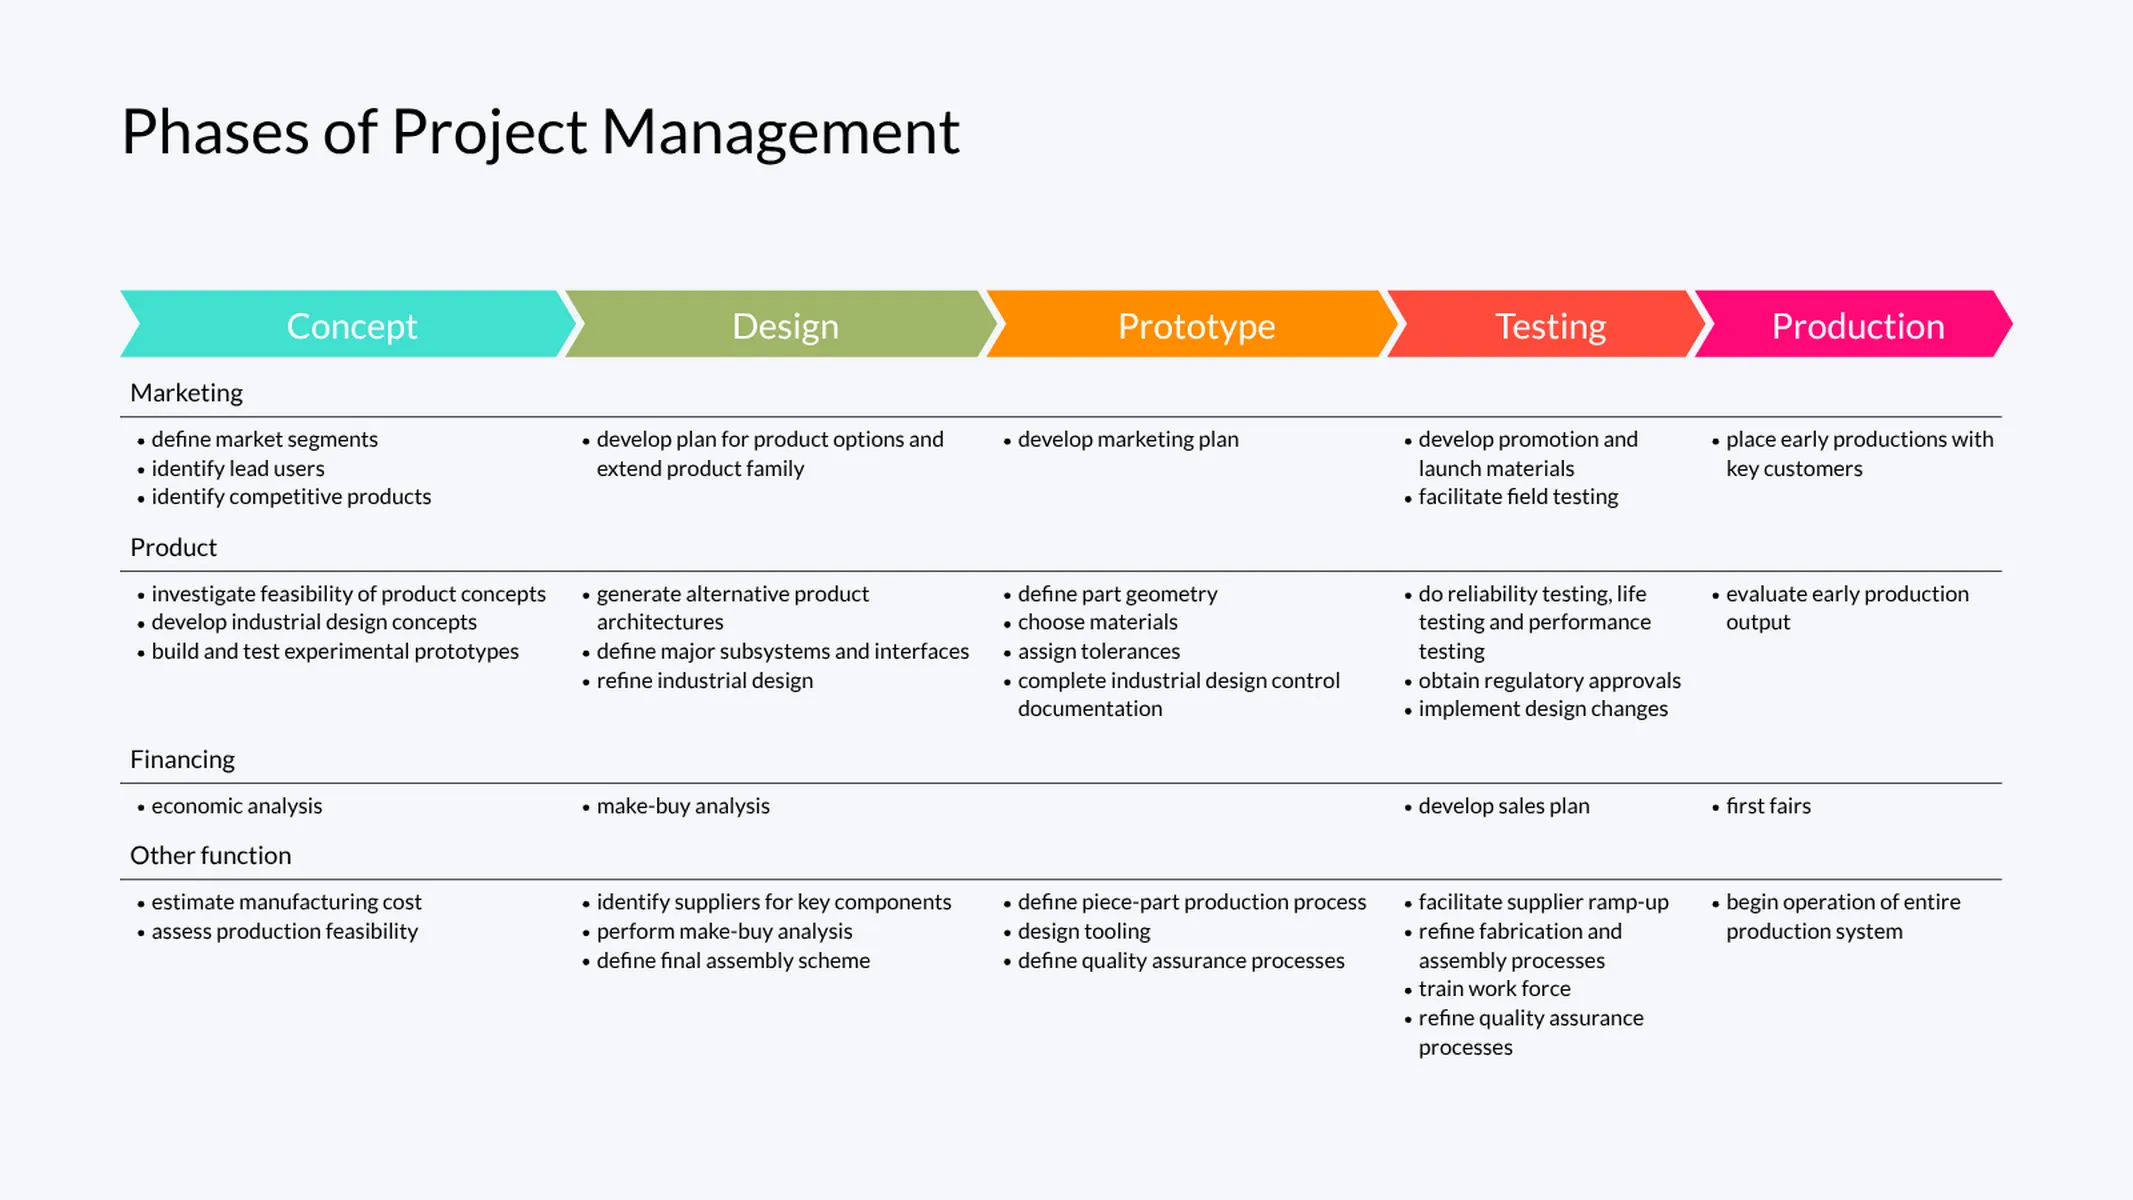
Visually dividing projects or complex processes into phases and defining activities and deliverables for each of them will help your team to meet all requirements at the end. The flexible structure of this plugin allows you to segment the phases into groups of processes or activities (stages) and to visualize the whole project life cycle. You can either organize the chevrons vertically or horizontally and describe your phases’ many stages.
How to make a project phase chart with Vizzlo?
- Click on any element to directly enter your data. Or, if you prefere, use Vizzlo’s spreadsheet to copy and paste or import your data.
- Right click above the chevrons to add milestones. Or use the button “EDIT MILESTONES” (tab DATA) to edit them or add new ones.
- Drag and drop milestones, phases, and stages to rearrange them.
- Use the cards in the sidebar as support to enter your data and choose custom colors, in case you need to highlight critical phases or grey out past phases.
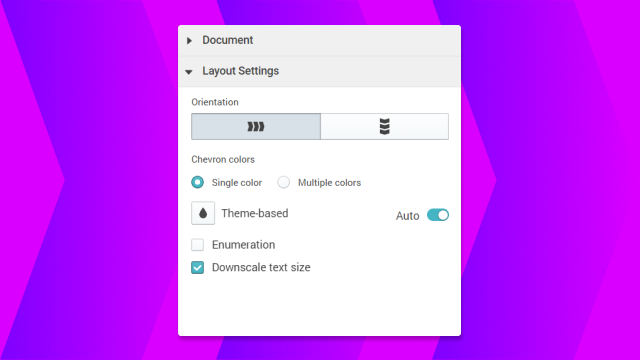
- Explore the layout settings option to choose the orientation of the chevrons and choose to enumerate your phases.
Project phase chart: key features
- Vertical and horizontal chevrons
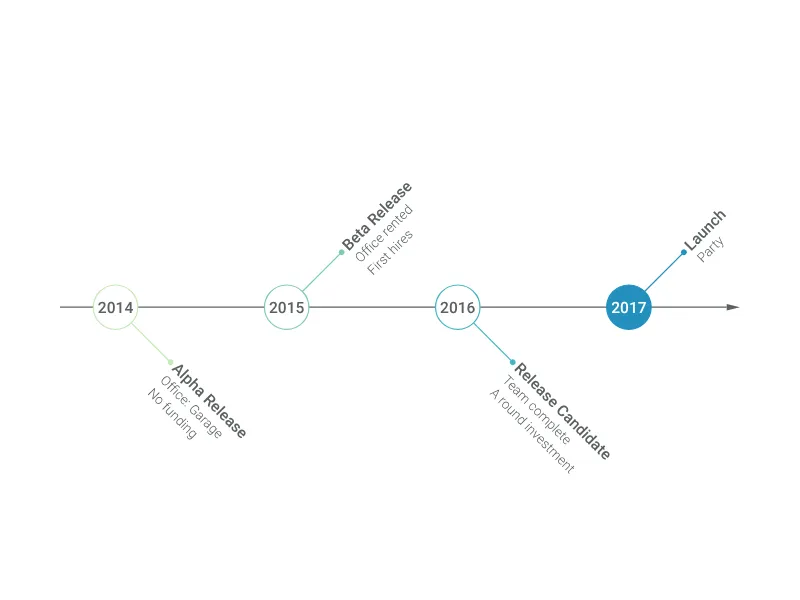
- Project milestones
- Custom colors
- Optional enumeration of phases
Pro tip: adjust font sizes and hyphenate manually to optimize the chart. Don’t forget: keep it concise and easy to read!
Project Phase Chart: What's new?
Fixed drag and drop for stages not working.
A bug that caused phases to lose content after drag & drop was fixed.
A fix that brings back the option to add a phase in the horizontal mode of this chart.
We have added the option to change the color of all chevron headers simultaneously. The UI also received a facelift.
Click on the column header and resize your columns as needed. Visualizing your project flow just became easier.
Click on the lock icon to undo your changes.
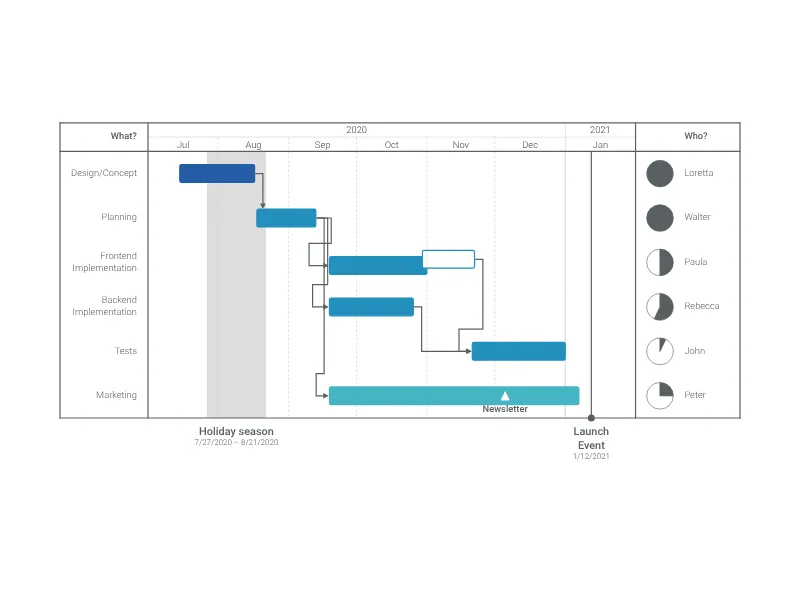
Project Phase Chart Alternatives
Enhance your productivity
Create a Project Phase Chart directly in the tools you love

Create a Project Phase Chart in PowerPoint with
Vizzlo's add-in

Loved by professionals around the world


Visualizations your audience won’t forget
Convey abstract concepts and data with professionally designed
charts and graphics you can easily edit and customize.