Chart Vizzard
Vizzlo's AI-based chart generatorCovid-19 Impact on Mountain Resorts in France

In the fight against the Covid-19 pandemic many businesses in the hotel sector suffered huge losses. State regulations often times forced hotels to close down when the incidence rose over a certain threshold. Due to the nature of this pandemic to put up higher incidence rates in the winter months and therefore harsher restrictions during this time, the mountain tourism sector got hit the hardest.
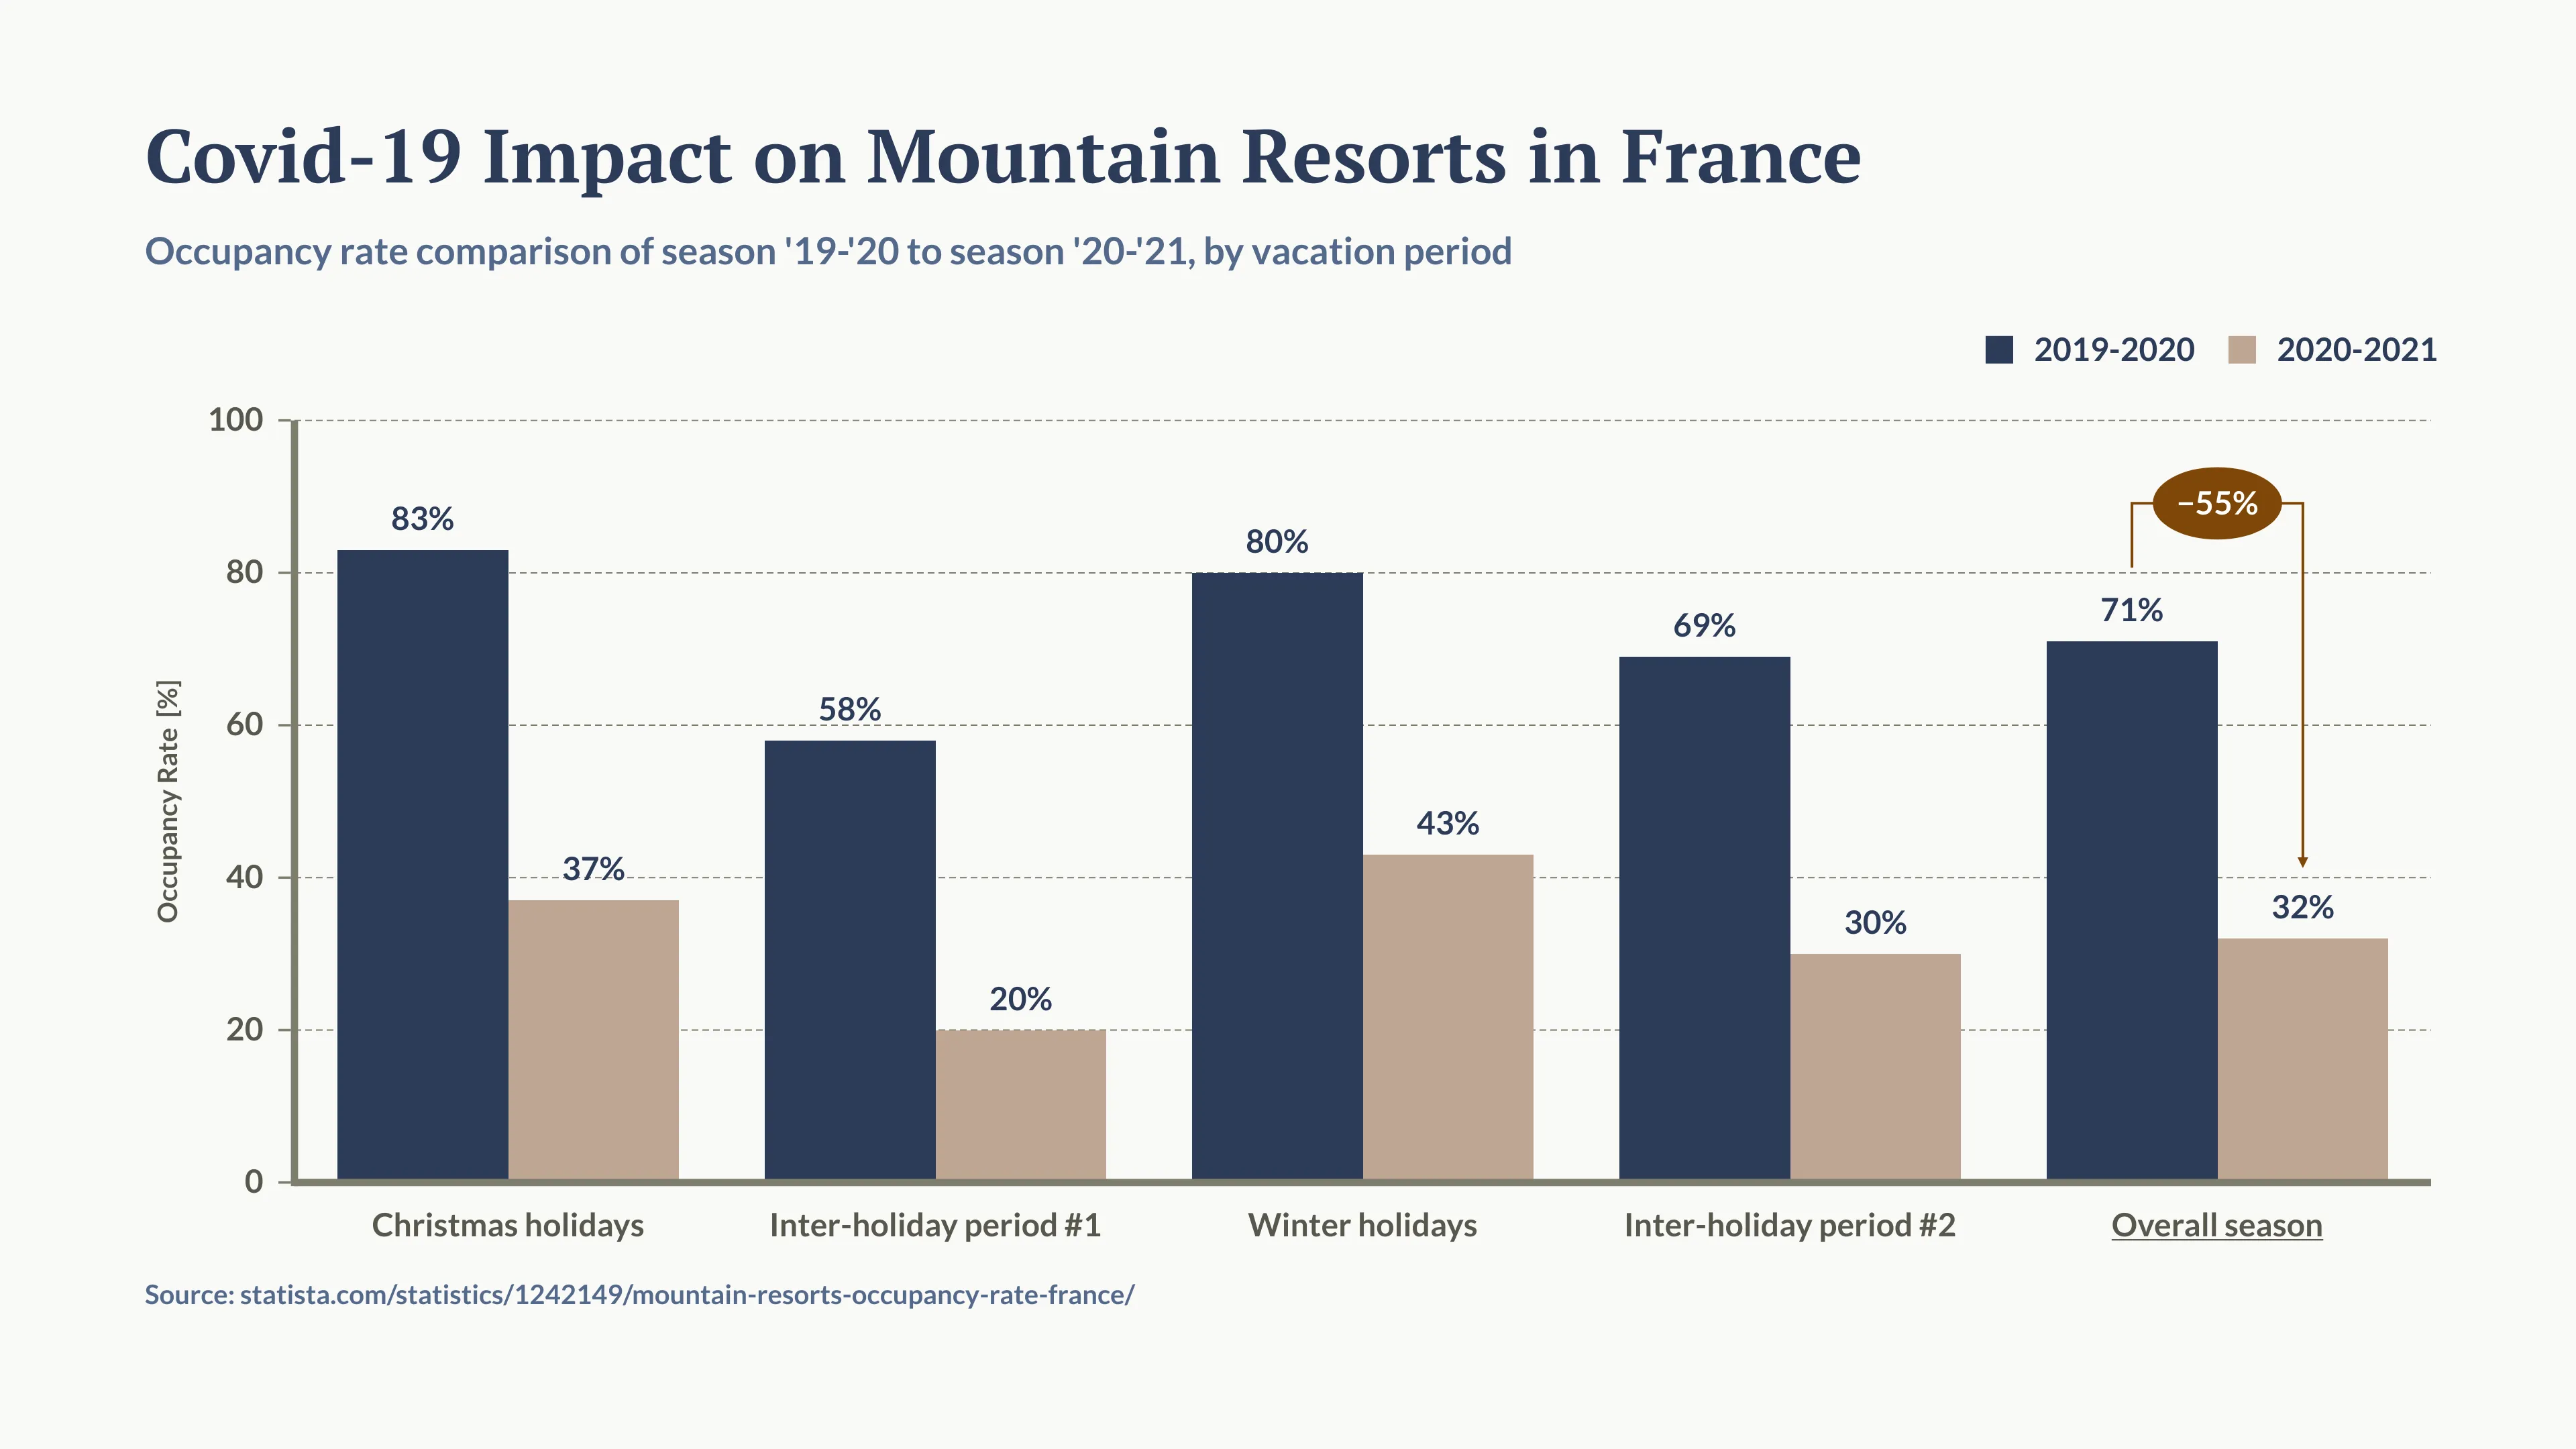
This chart illustrates the devastating impact the covid pandemic had on mountain resorts in France. The data compares the occupancy rate of season ‘19-‘20 to season ‘20-‘21. The highlighted value points out that these mountain resorts lost 55% of their occupancy rate in the first winter of the covid pandemic.
These low occupancy rates do not only hurt the hotel sector of mountain resorts. According to an article by Leon Davis at theconversation.com, restaurant owners in these areas state that they saw no income during the last winter season.

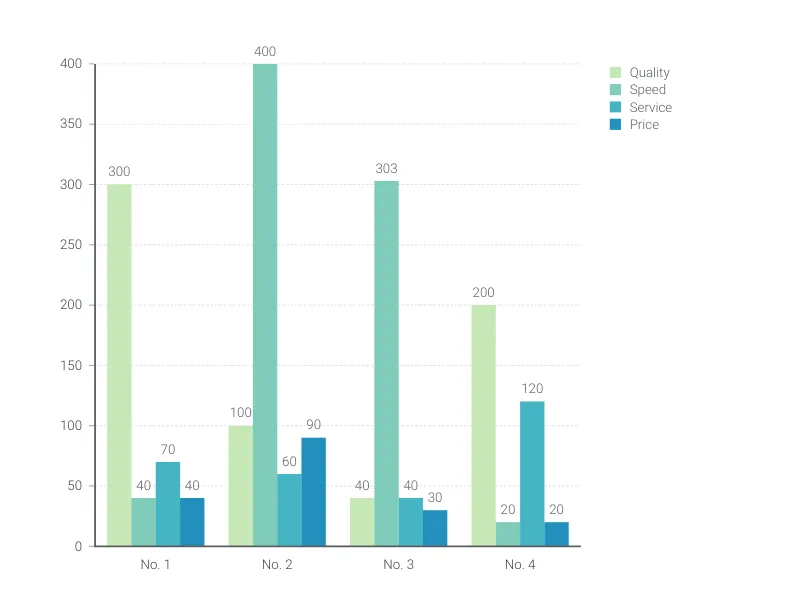
This is an example of Vizzlo's “Grouped Bar Chart”
Use a grouped bar chart to compare the same categories within different groups.