Chart Vizzard
Vizzlo's AI-based chart generator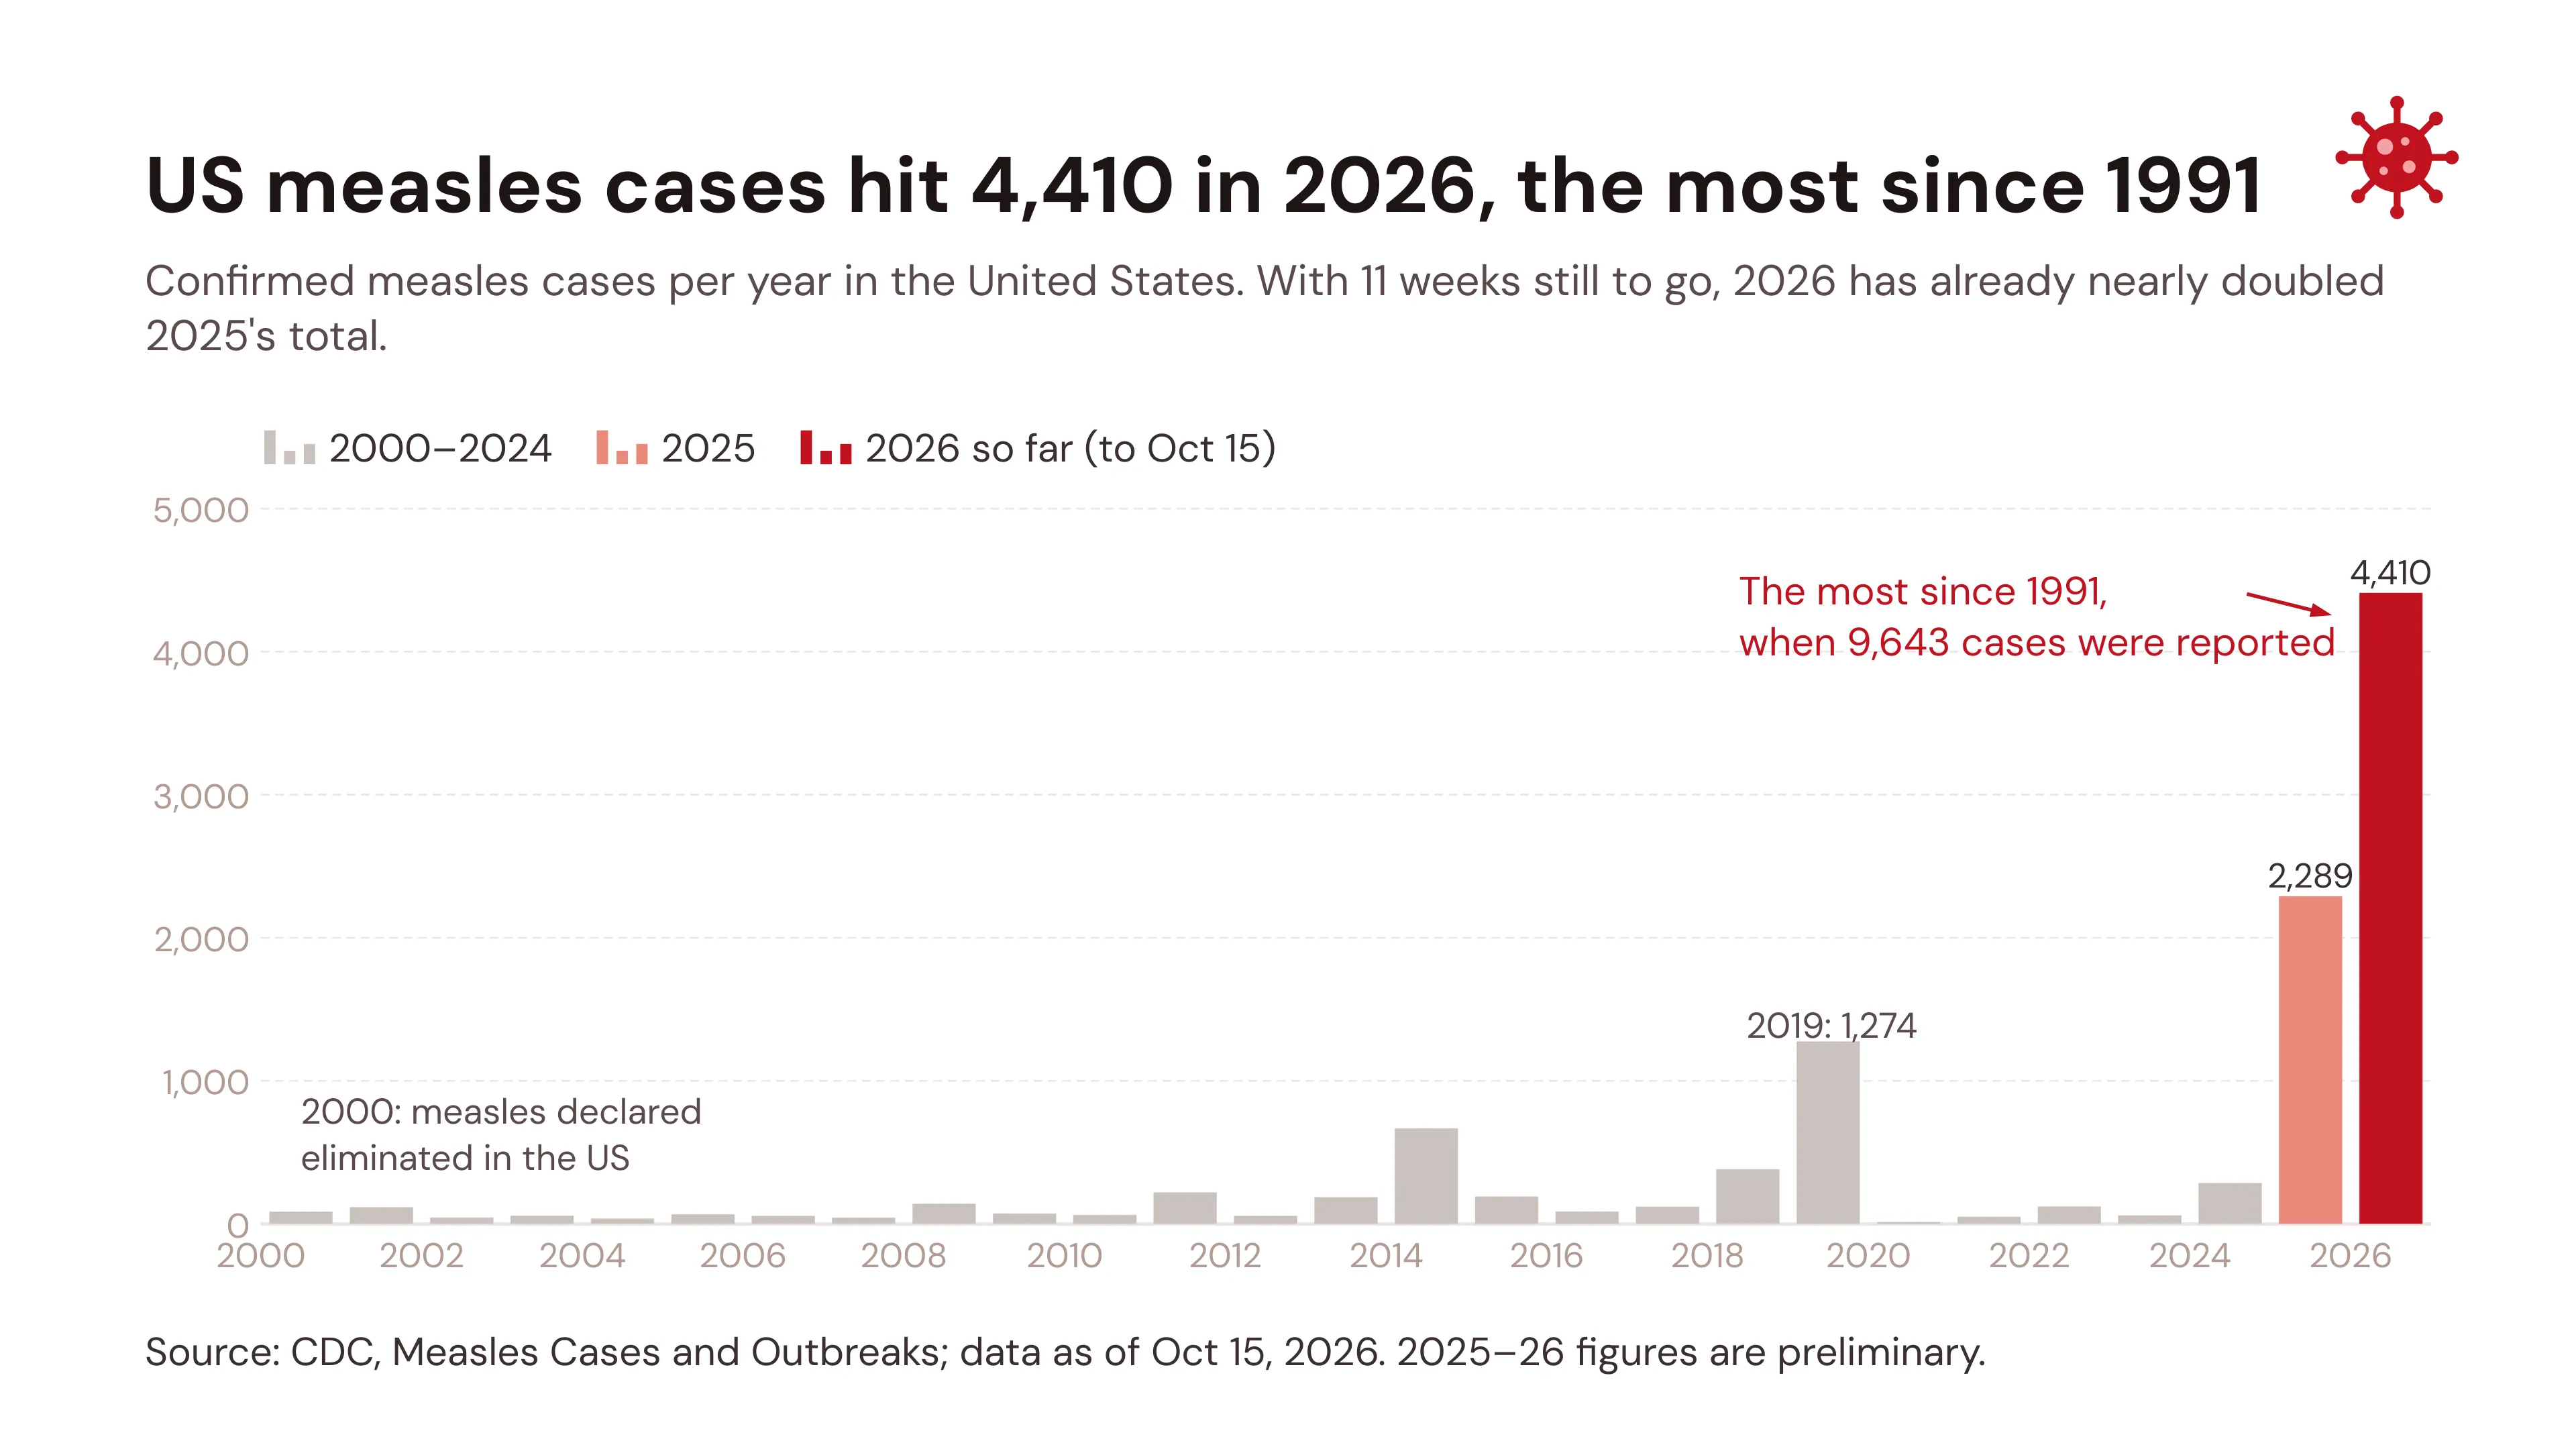
US measles cases hit 4,410 in 2026, the most since 1991
The United States has recorded 4,410 confirmed measles cases so far in 2026, according to the CDC’s weekly measles update published on October 16, 2026 (data as of October 15). That is 330 more than a week earlier (4,080), a weekly rise of 8.1%, as Contagion Live calculated. With about 11 weeks of the year left, the 2026 total is already 93% higher than all of 2025 (2,289 cases). It is the highest annual count since 1991, when CDC data show 9,643 cases, and far above anything seen since measles was declared eliminated in the US in 2000.
Outbreaks are driving the surge
Almost all of this year’s cases are tied to outbreaks: 96% (4,228 of 4,410) are outbreak-associated, and 42 new outbreaks have been reported in 2026, per Contagion Live’s summary of CDC data. Cases have been reported in 47 jurisdictions. Pennsylvania is now the epicentre, with more than 1,100 cases. On October 13 the CDC said it would send more support to the state through its Epi-Aid emergency programme, Reuters reported.
| Year | Confirmed cases | Note |
|---|---|---|
| 1991 | 9,643 | Last year with more cases than 2026 |
| 2000 | 85 | Measles declared eliminated in the US |
| 2014 | 667 | |
| 2019 | 1,274 | Previous post-elimination peak |
| 2024 | 285 | |
| 2025 | 2,289 | 45 jurisdictions, 48 outbreaks |
| 2026 (to Oct 15) | 4,410 | 47 jurisdictions, 42 new outbreaks |
| 2026 detail (as of Oct 15) | Value |
|---|---|
| Weekly increase | +330 cases (+8.1%) |
| Hospitalized | 451 (10% of cases) |
| Share of cases under age 20 | 59% (2,598) |
| Outbreak-associated cases | 96% (4,228) |
| Deaths (CDC national count) | 2 |
| Pennsylvania cases (state count, as of Oct 9) | 1,136 |
What it means
The scale of 2026’s spread puts the US’s measles elimination status in doubt. A country loses that status when a chain of transmission lasts more than 12 months. STAT reported in August that a Utah outbreak that began in June 2025 had already passed that mark, and that the US had reported cases every week since January 2025. A US verification committee reports to the Pan American Health Organization (PAHO), whose regional commission is expected to announce its decision in November. PAHO revoked Canada’s elimination status in November 2025.
The official death toll is also disputed. The CDC counts 2 measles deaths nationwide in 2026. Pennsylvania officials had linked 5 deaths to the state’s outbreak as of October 9, per Reuters, and a coroner’s report on October 13 brought local reports to at least six, according to Contagion Live. Pennsylvania’s governor and HHS Secretary Robert F. Kennedy Jr. disagree over how such deaths should be counted. The CDC updates its count weekly, and with outbreaks still active the 2026 total will keep rising.
How to read the chart
- Each bar shows confirmed measles cases in the US in one calendar year, from 2000 to 2026.
- Grey bars are 2000–2024. The coral bar is 2025’s full-year total (2,289). The red bar is 2026 to date (4,410 as of October 15), so it covers only part of the year.
- Numbers above the 2025 and 2026 bars are their totals. The 2019 label marks the previous peak after elimination (1,274).
- The red callout gives the last year with more cases (1991: 9,643). That year is left off the chart because it would squash the rest of the scale.
- The note at the far left marks 2000, the year measles was declared eliminated in the US.
Sources
- Measles Cases and Outbreaks: US Centers for Disease Control and Prevention (CDC), updated October 16, 2026 (data as of October 15, 2026)
- Yearly measles cases, 1985–present (chart data): CDC, accessed October 18, 2026
- Measles Update: October 16, 2026: Contagion Live, October 16, 2026
- US measles cases reach 35-year record: Contagion Live, July 24, 2026
- CDC to deploy additional support to Pennsylvania to probe measles outbreak: Reuters (republished by WHTC), October 13, 2026
- US measles elimination status under review: STAT, August 6, 2026
Notes
- Preliminary data: the CDC says 2025 and 2026 case counts are preliminary and may change. The counts include only confirmed cases reported by jurisdictions. Probable cases are excluded.
- Partial year: 2026 runs only to October 15, so the comparison with earlier full years understates where 2026 will end.
- Data vintage: when accessed, the CDC’s yearly chart-data file still listed 2026 at 4,080 (the previous week’s figure). The chart uses 4,410 from the CDC page updated October 16.
- Hospitalizations and age breakdown come from Contagion Live’s summary of CDC data, because the CDC page’s 2026 hospitalization table was blank when accessed.
- Deaths: the CDC national count (2) and state and local reports from Pennsylvania (5–6) differ. See above.
- Years before 2000 are left off the chart for scale. 1991 is cited in the callout only.
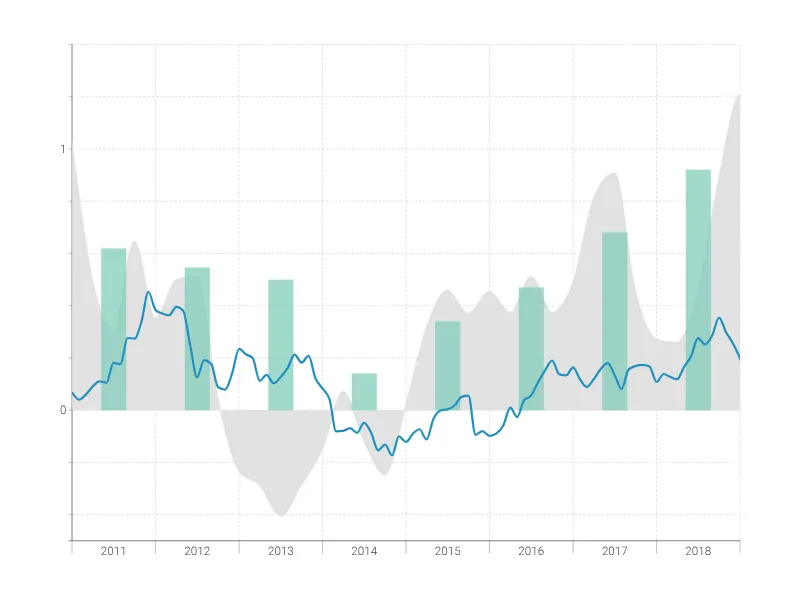
This is an example of Vizzlo's “Time Series Graph”
Complex time series graph to visualize detailed financial data.
Finance & Economics Bar & Column charts Line & Area charts Time-based charts