Chart Vizzard
Vizzlo's AI-based chart generatorGearwheels Chart
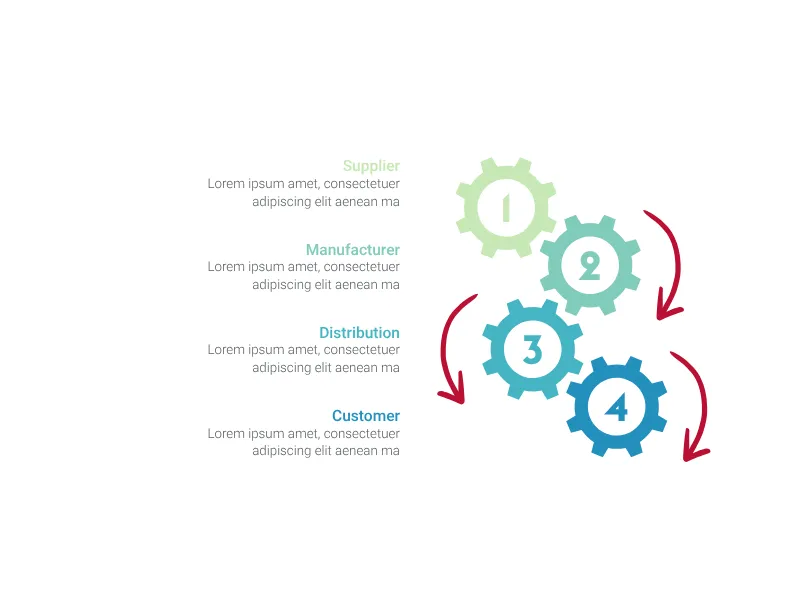
This gearwheel chart perfectly fits your relationships in business processes.
What is a gearwheels chart?
The Gearwheels Chart uses interconnected mechanical gears to represent business processes, workflows, or system relationships. This metaphorical visualization is perfect for showing how different components work together in a coordinated system, emphasizing the interconnected nature of business operations.
Key Features
- Mechanical metaphor: Interlocking gears represent interconnected processes or systems
- Process visualization: Perfect for showing workflow dependencies and relationships
- Dual content areas: Each gear supports both a title and detailed content description
- Optional numbering: Toggle numerical labels for sequential processes
- Scalable design: Accommodates 2-6 gears for optimal visual balance
Best Use Cases
- Business process mapping: Show how different departments or functions work together
- Supply chain visualization: Represent interconnected stages from supplier to customer
- System architecture: Display how different components interact in technical systems
- Workflow documentation: Illustrate sequential or parallel process dependencies
- Team collaboration: Show how different teams contribute to overall operations
- Manufacturing processes: Represent production stages and their relationships
Configuration Options
Customize your gearwheels chart with simple but effective settings:
- Gear numbering: Choose whether to display numerical sequence labels on each gear
- Content capacity: Each gear accommodates both a concise title and detailed content description
Design Philosophy
The gearwheels metaphor effectively communicates several key concepts:
- Interdependence: Changes in one gear affect the entire system
- Coordination: All components must work in harmony for optimal function
- Sequential flow: Processes follow a logical order and timing
- Mechanical precision: Operations require careful coordination and timing
This visualization is particularly powerful for presentations where you need to emphasize that business success depends on all components working together smoothly, or when explaining complex processes that have multiple interconnected stages.
Gearwheels Chart: What's new?
Reworked as more interactive and to support custom page setups seamlessly.
Gearwheels Chart Alternatives
Enhance your productivity
Create a Gearwheels Chart directly in the tools you love

Create a Gearwheels Chart in PowerPoint with
Vizzlo's add-in

Loved by professionals around the world


Visualizations your audience won’t forget
Convey abstract concepts and data with professionally designed
charts and graphics you can easily edit and customize.