Chart Vizzard
Vizzlo's AI-based chart generatorIdea Chart
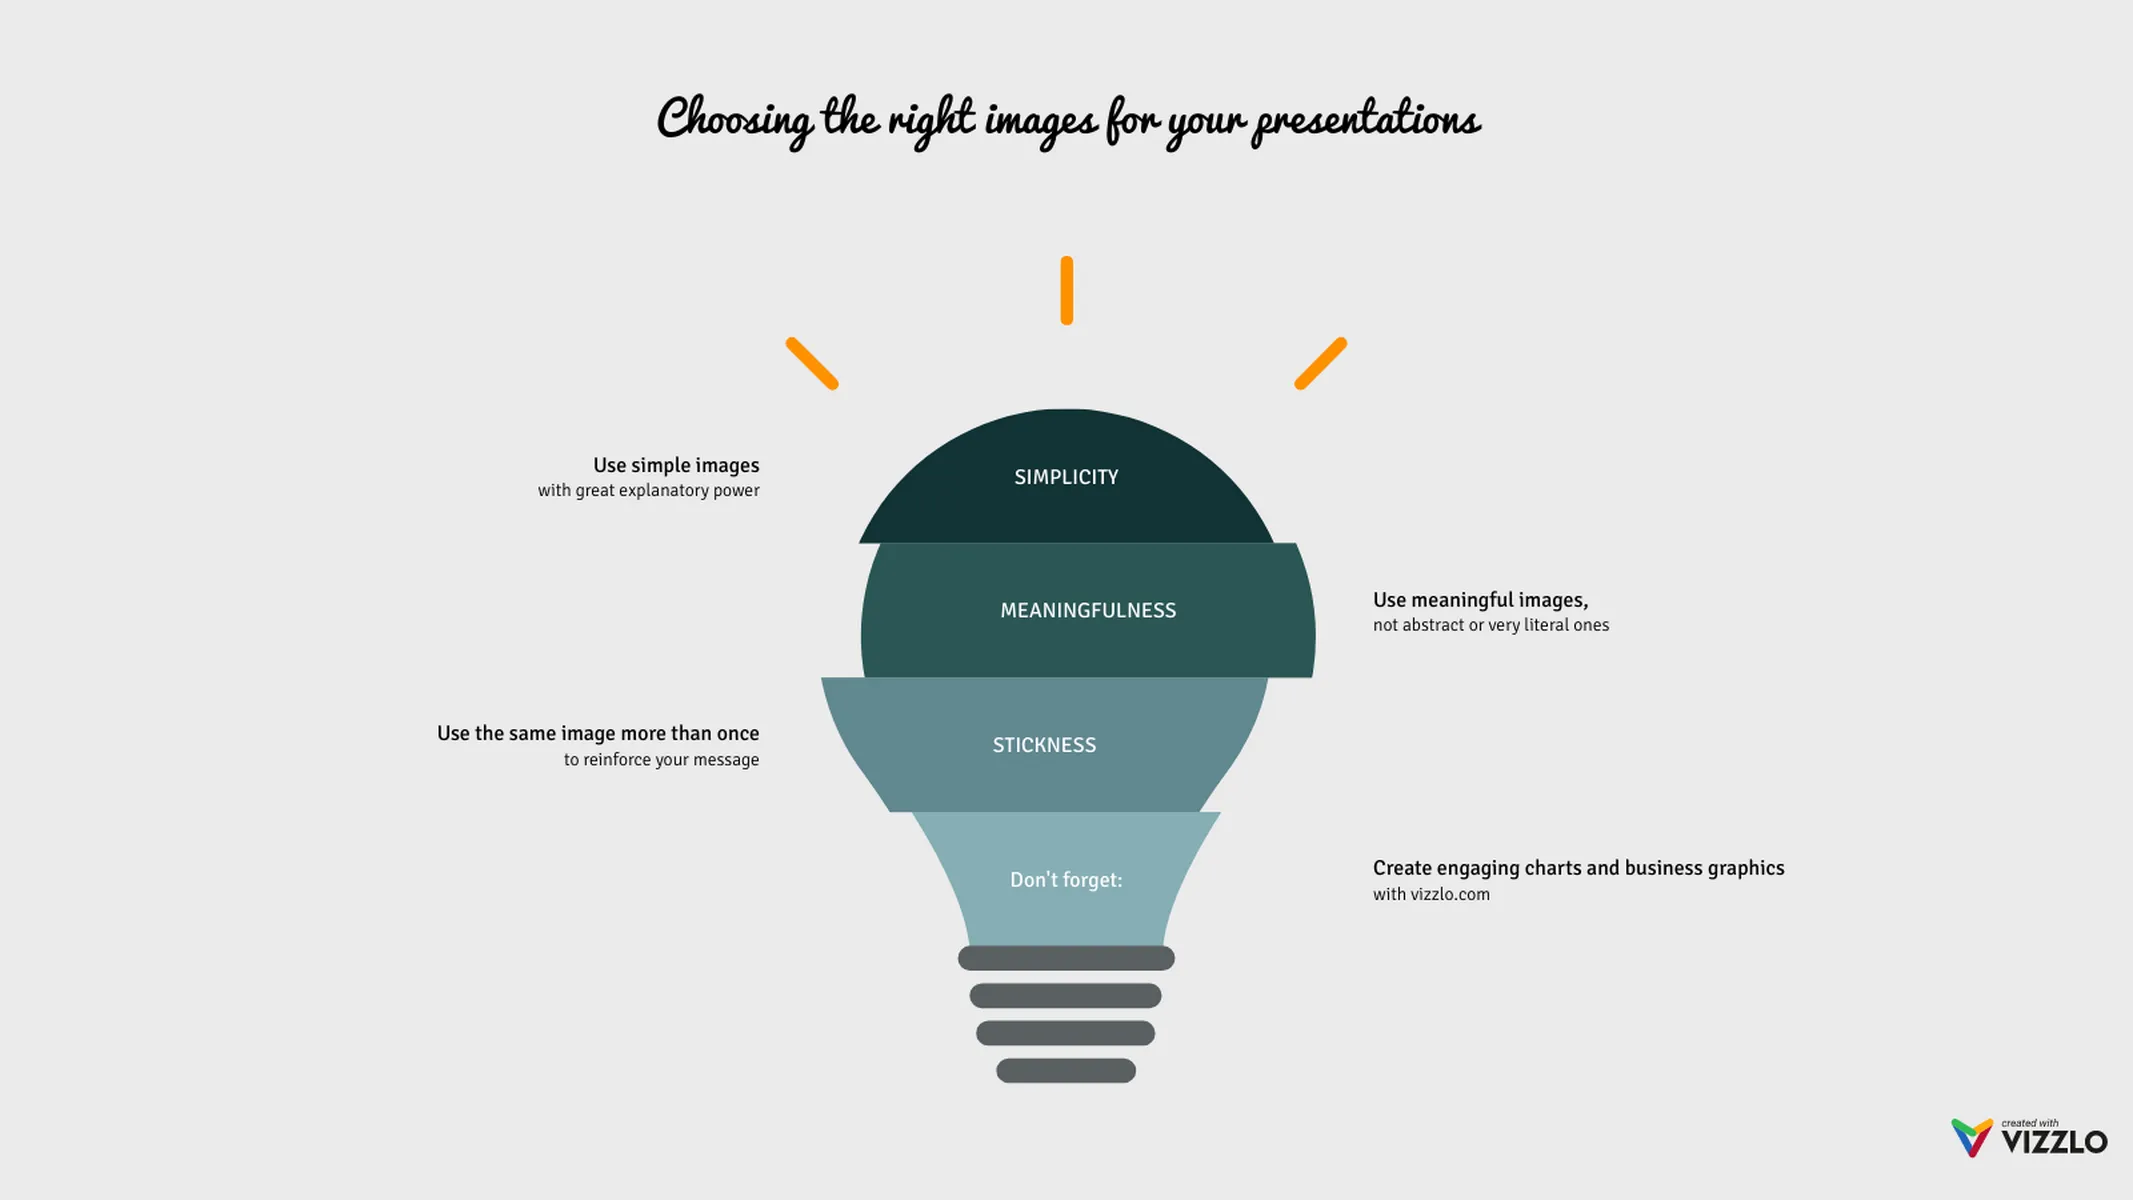
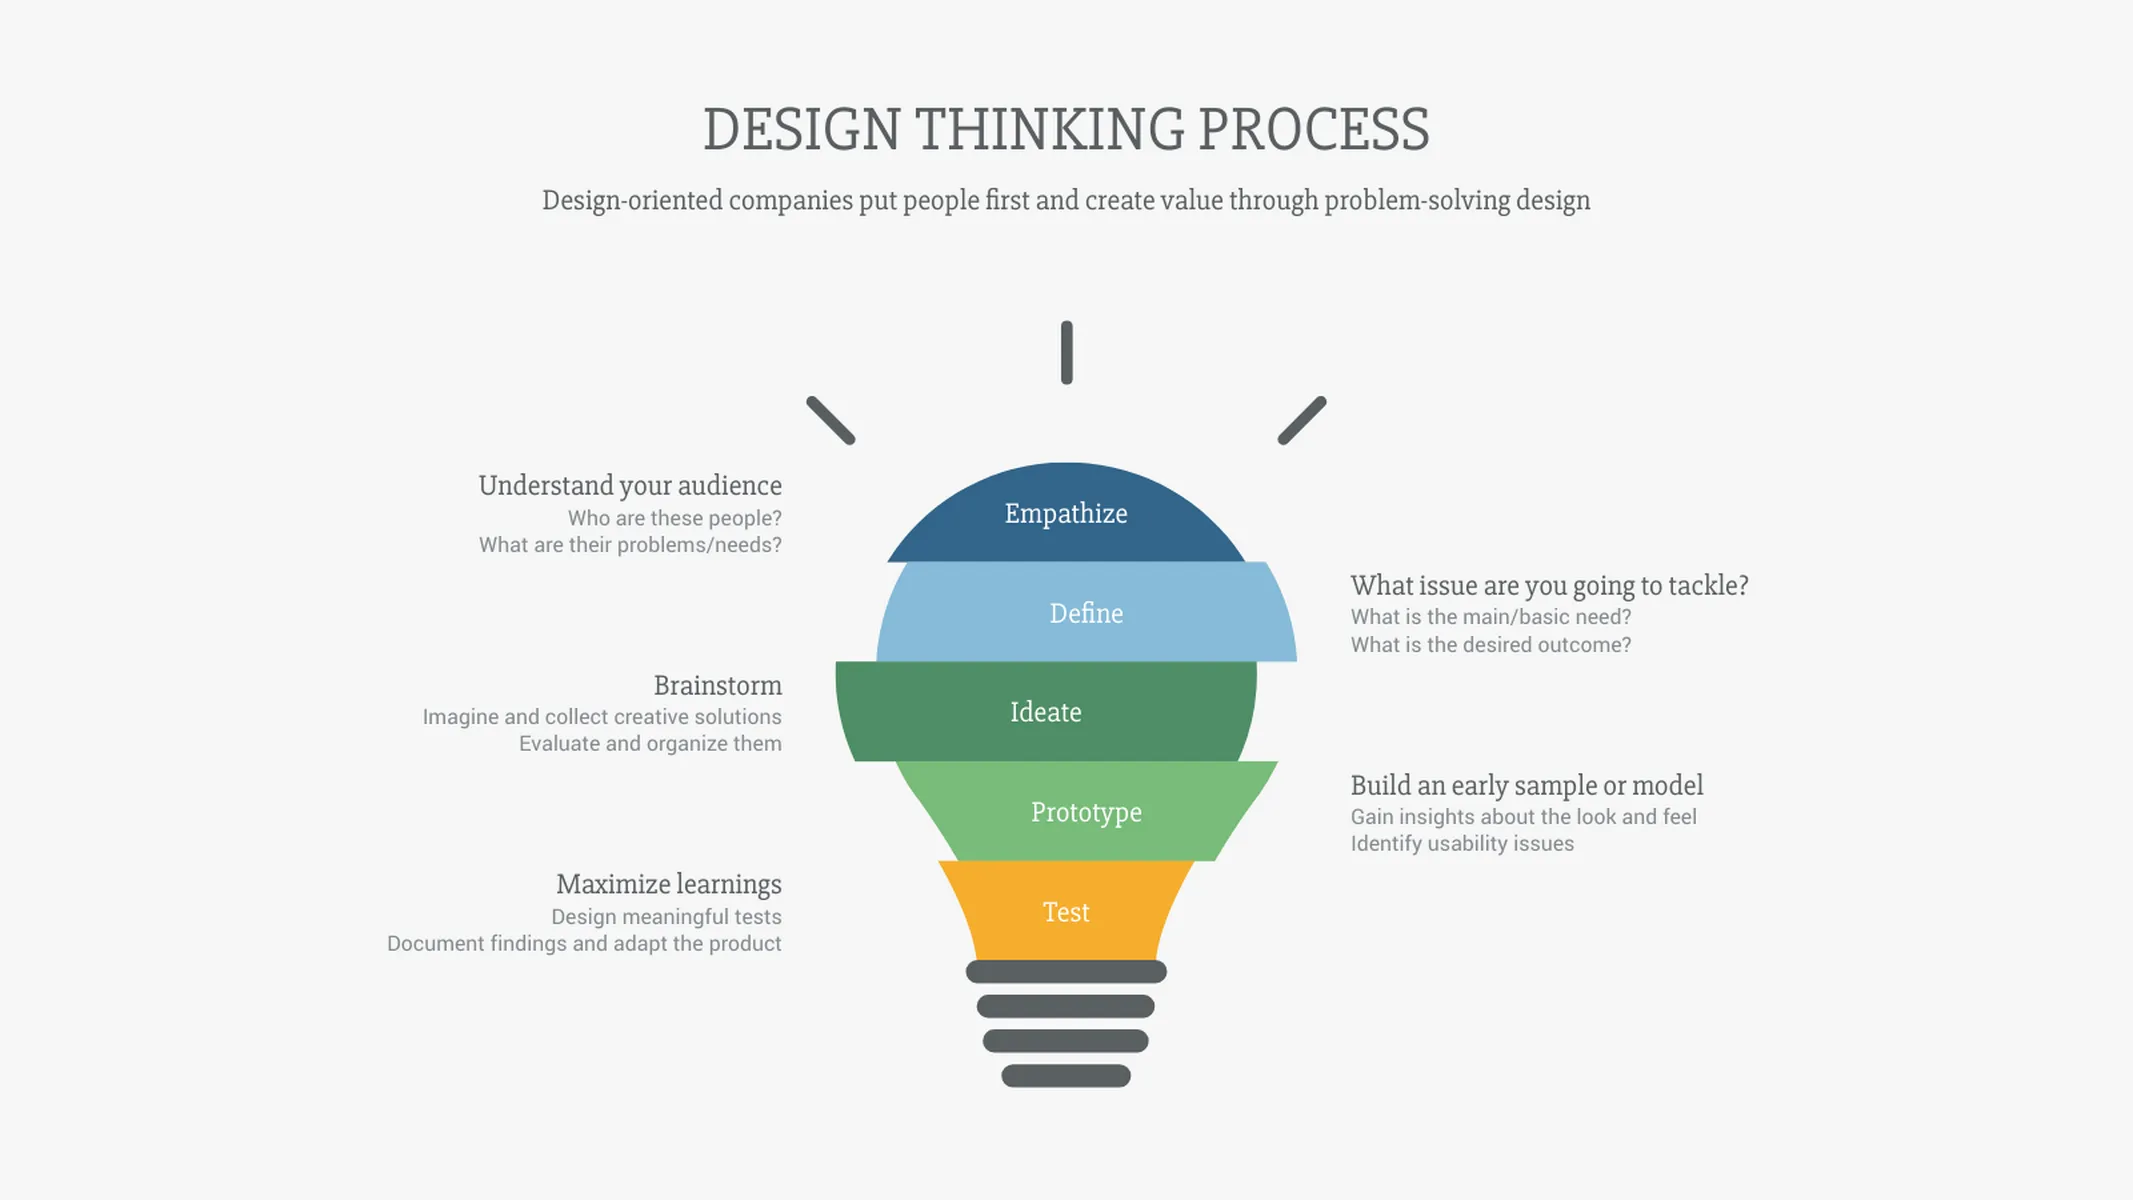
Visualize your ideas and core beliefs with this great staged light bulb graphic.
What is an idea chart?
An idea chart is Vizzlo’s variant of the light bulb slide template and is perfect for communicating ideas and creative processes.
A light bulb turning on has always been a visual metaphor for the moment of creative insights and having enlighting ideas.
The Vizzlo’s light bulb is sliced into segments, making it possible for you to present different ideas or processes in a compelling way.
How to create an idea chart with Vizzlo?
Create your chart in seconds and inspire your audience with a colorful light bulb slide! Follow these easy steps:
- Click on the segments to directly edit them: you can give each of them a title, a subtitle, and a small description.
- Use their active cards in the sidebar as support to enter your text and change colors.
- Use the ”+” handles to add new ideas.
- Explore the customization options of the tab “APPEARANCE” in the sidebar: choose your favorite theme or customize one.
Idea chart maker: key features
- Custom colors
- Custom fonts
- Up to six ideas
Idea Chart: What's new?
Idea Chart Alternatives
Enhance your productivity
Create a Idea Chart directly in the tools you love

Create a Idea Chart in PowerPoint with
Vizzlo's add-in
Loved by professionals around the world


Visualizations your audience won’t forget
Convey abstract concepts and data with professionally designed
charts and graphics you can easily edit and customize.
