Chart Vizzard
Vizzlo's AI-based chart generatorSignpost Chart
This signpost chart is great to visualize the different directions your project could go from here.
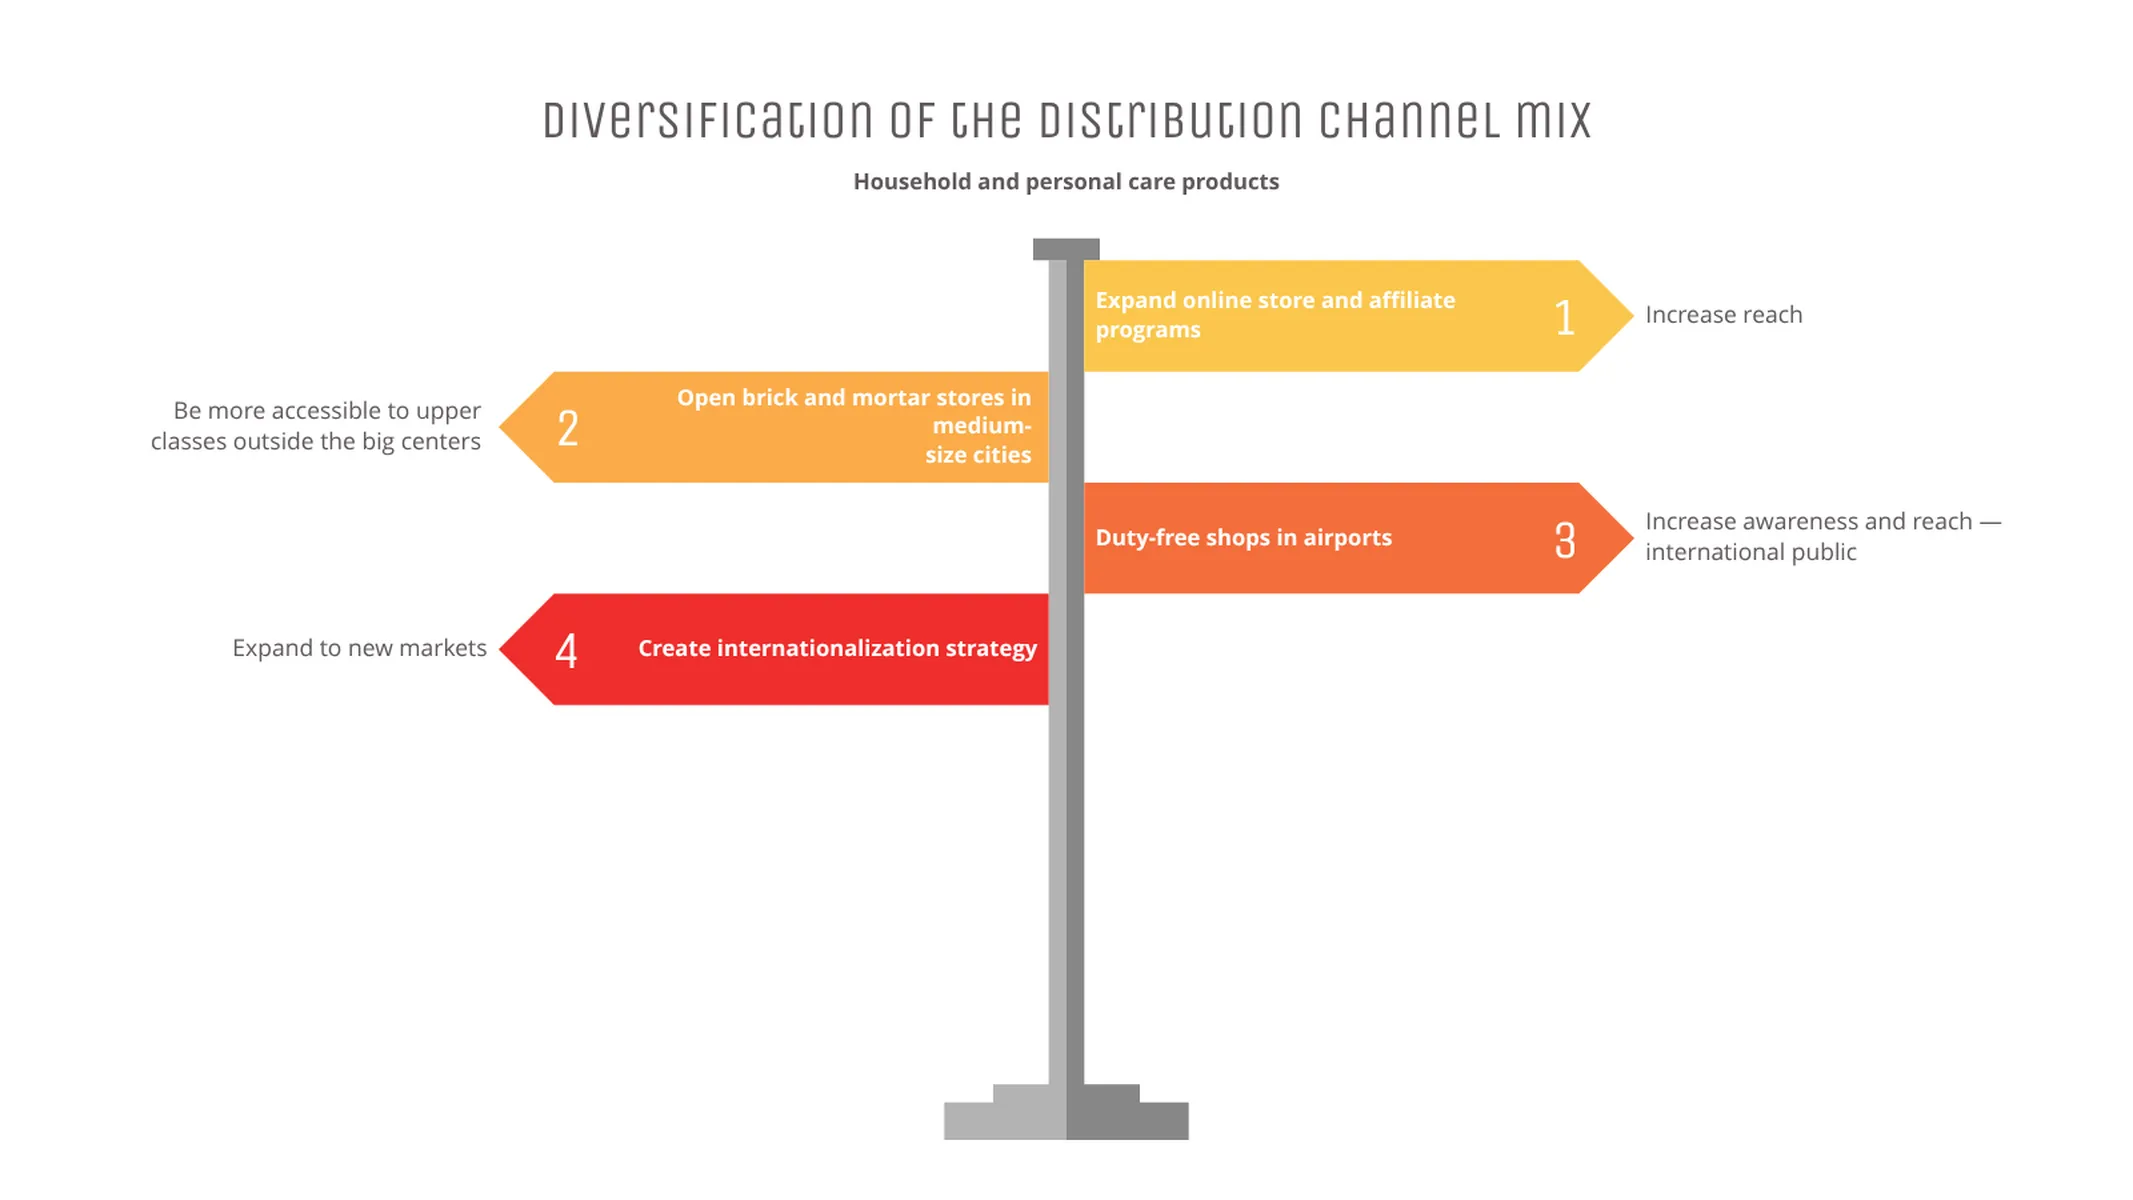


What is a signpost chart?
Similar to a signpost at a crossroads, this chart indicates different directions/paths that can be taken to reach a same or different objectives.
Once we define a goal, the next step is to determine the strategy, i.e., the path to take. Communicating both provides clarity and makes decision-making more efficient and effective.
How to make a signpost chart with Vizzlo?
Vizzlo’s Signpost chart is appealing and very easy to create. Follow these easy steps, present and impress!
- Click on the arrows and text elements to start editing them.
- Use the active cards in the sidebar as a support to enter your data, define custom colors and the directions of the arrows.
- Drag and drop the arrows to reorder and reposition them.
- Explore the options of the “APPEARANCE” tab to customize your chart.
Signpost chart maker: key features
- Custom colors
- Custom directions
- Optional enumeration and description
Signpost Chart: What's new?
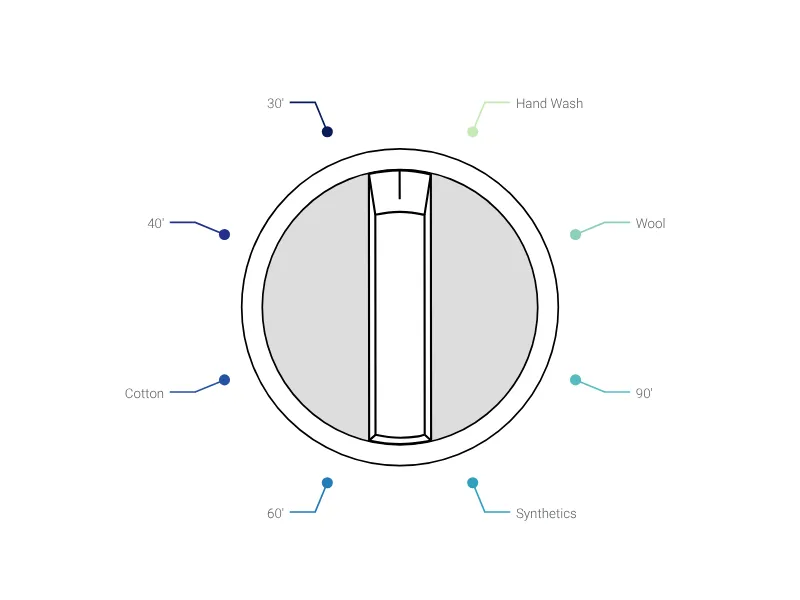
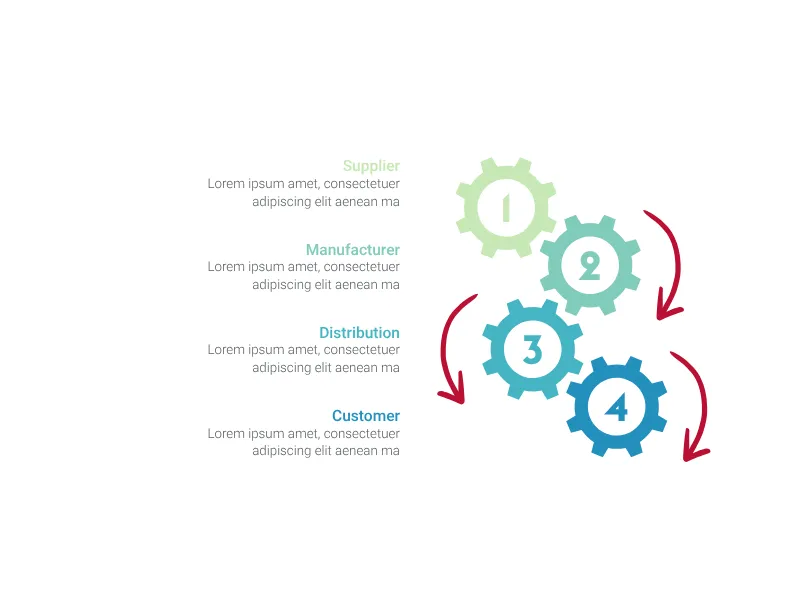
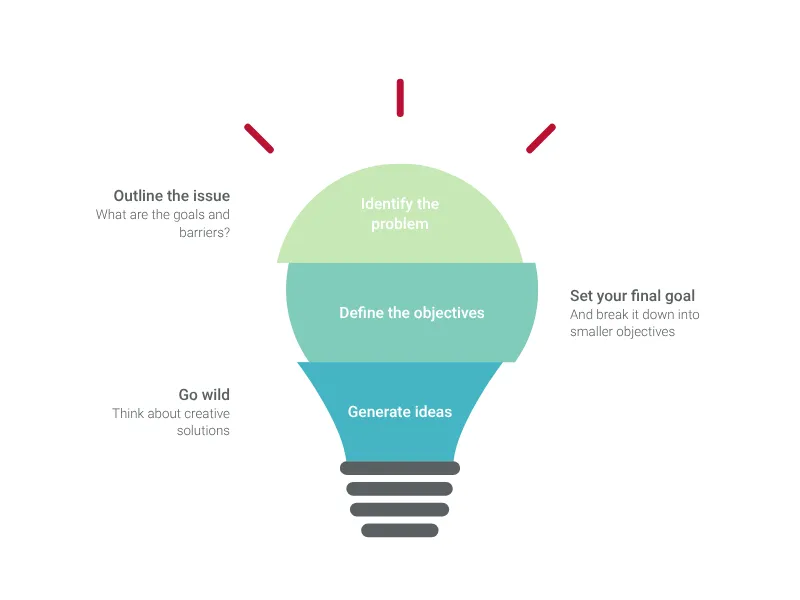
Signpost Chart Alternatives

Enhance your productivity
Create a Signpost Chart directly in the tools you love

Create a Signpost Chart in PowerPoint with
Vizzlo's add-in

Loved by professionals around the world


Visualizations your audience won’t forget
Convey abstract concepts and data with professionally designed
charts and graphics you can easily edit and customize.