Chart Vizzard
Vizzlo's AI-based chart generatorFeatures:
- Custom colors
- Custom brush width
What is Vizzlo Paint?
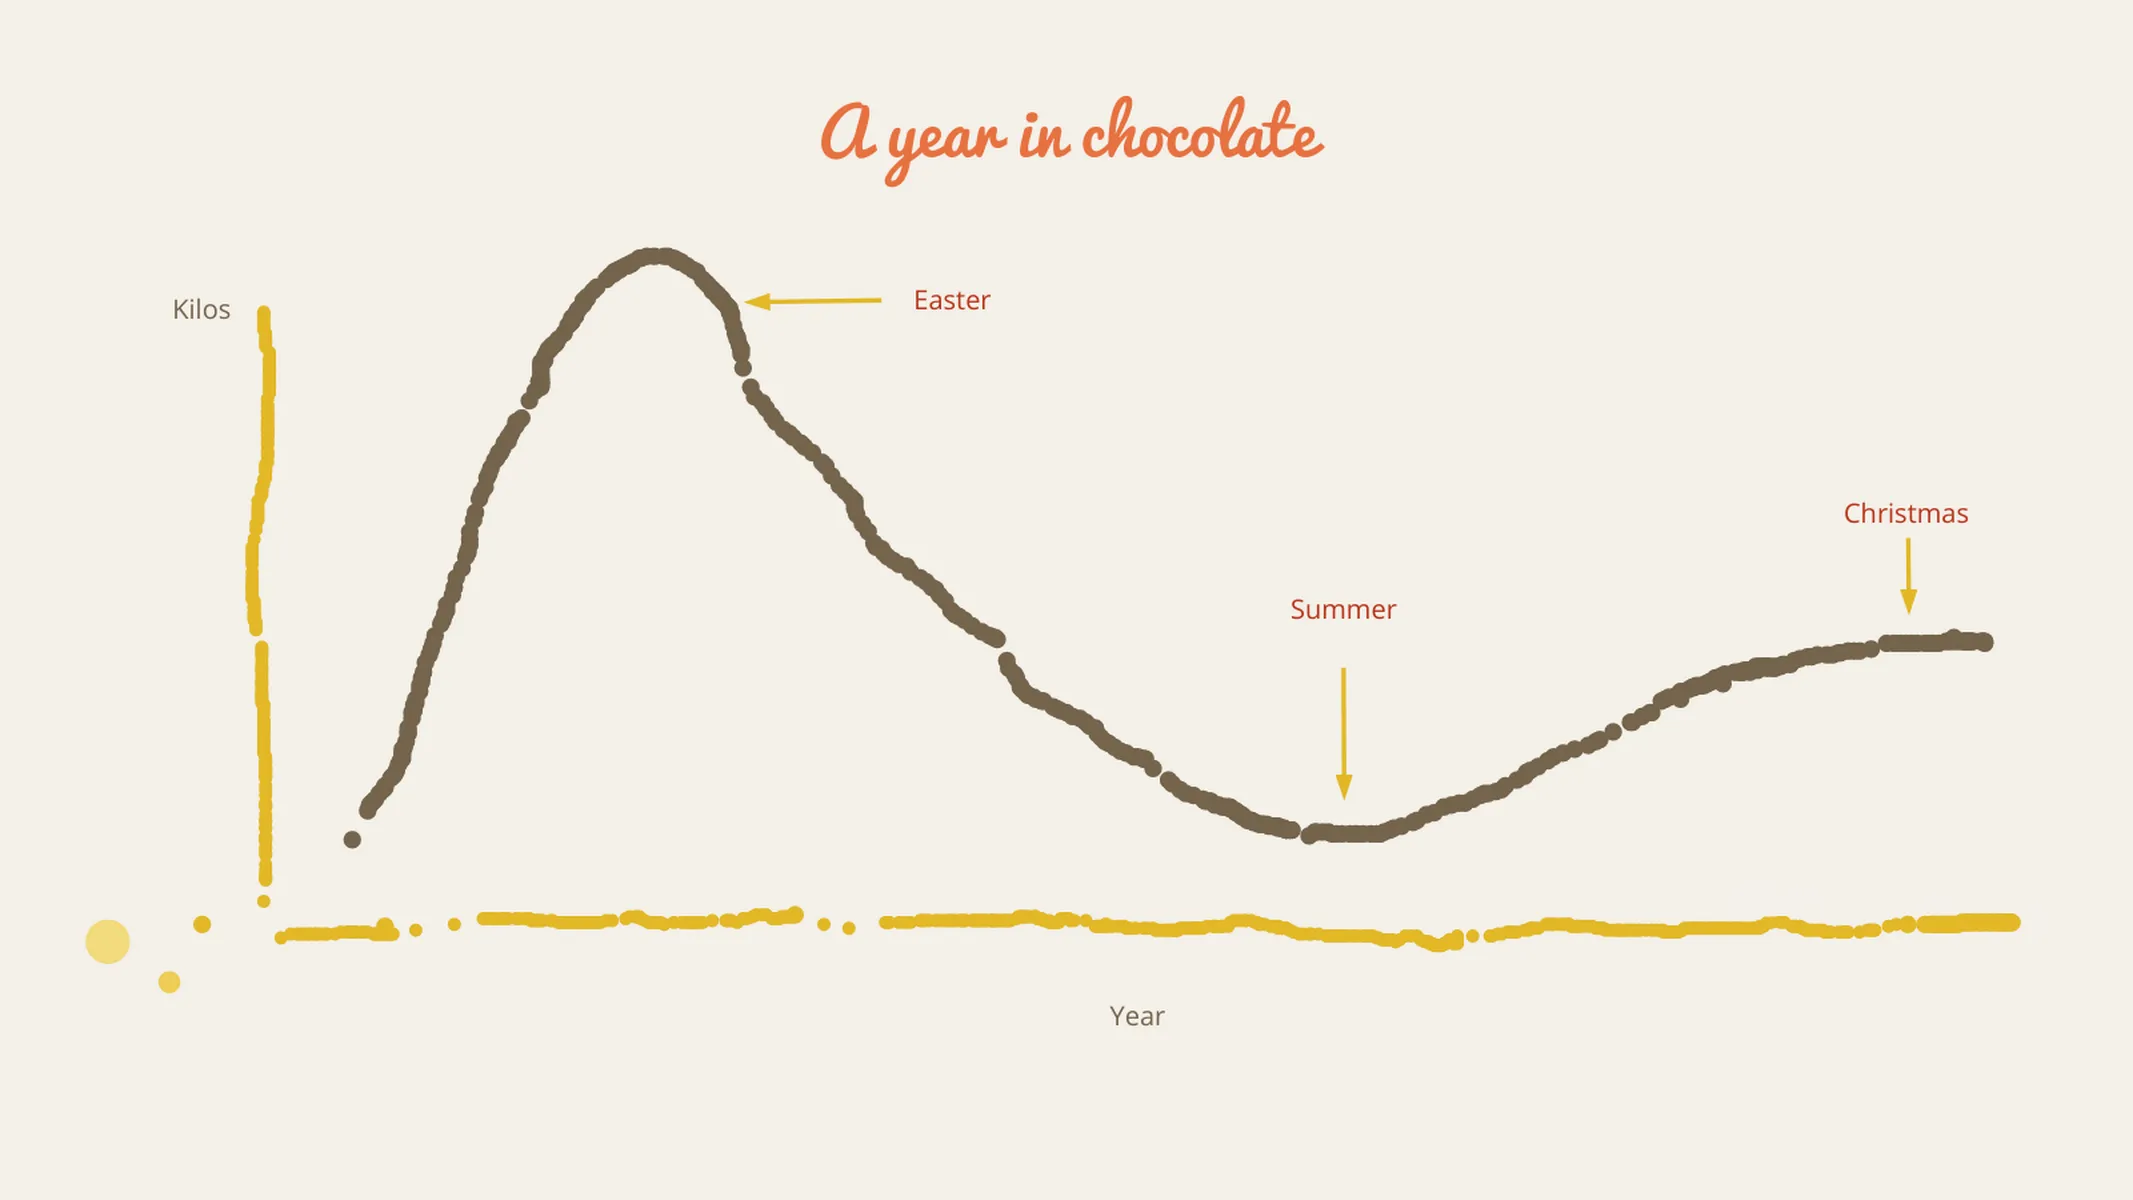
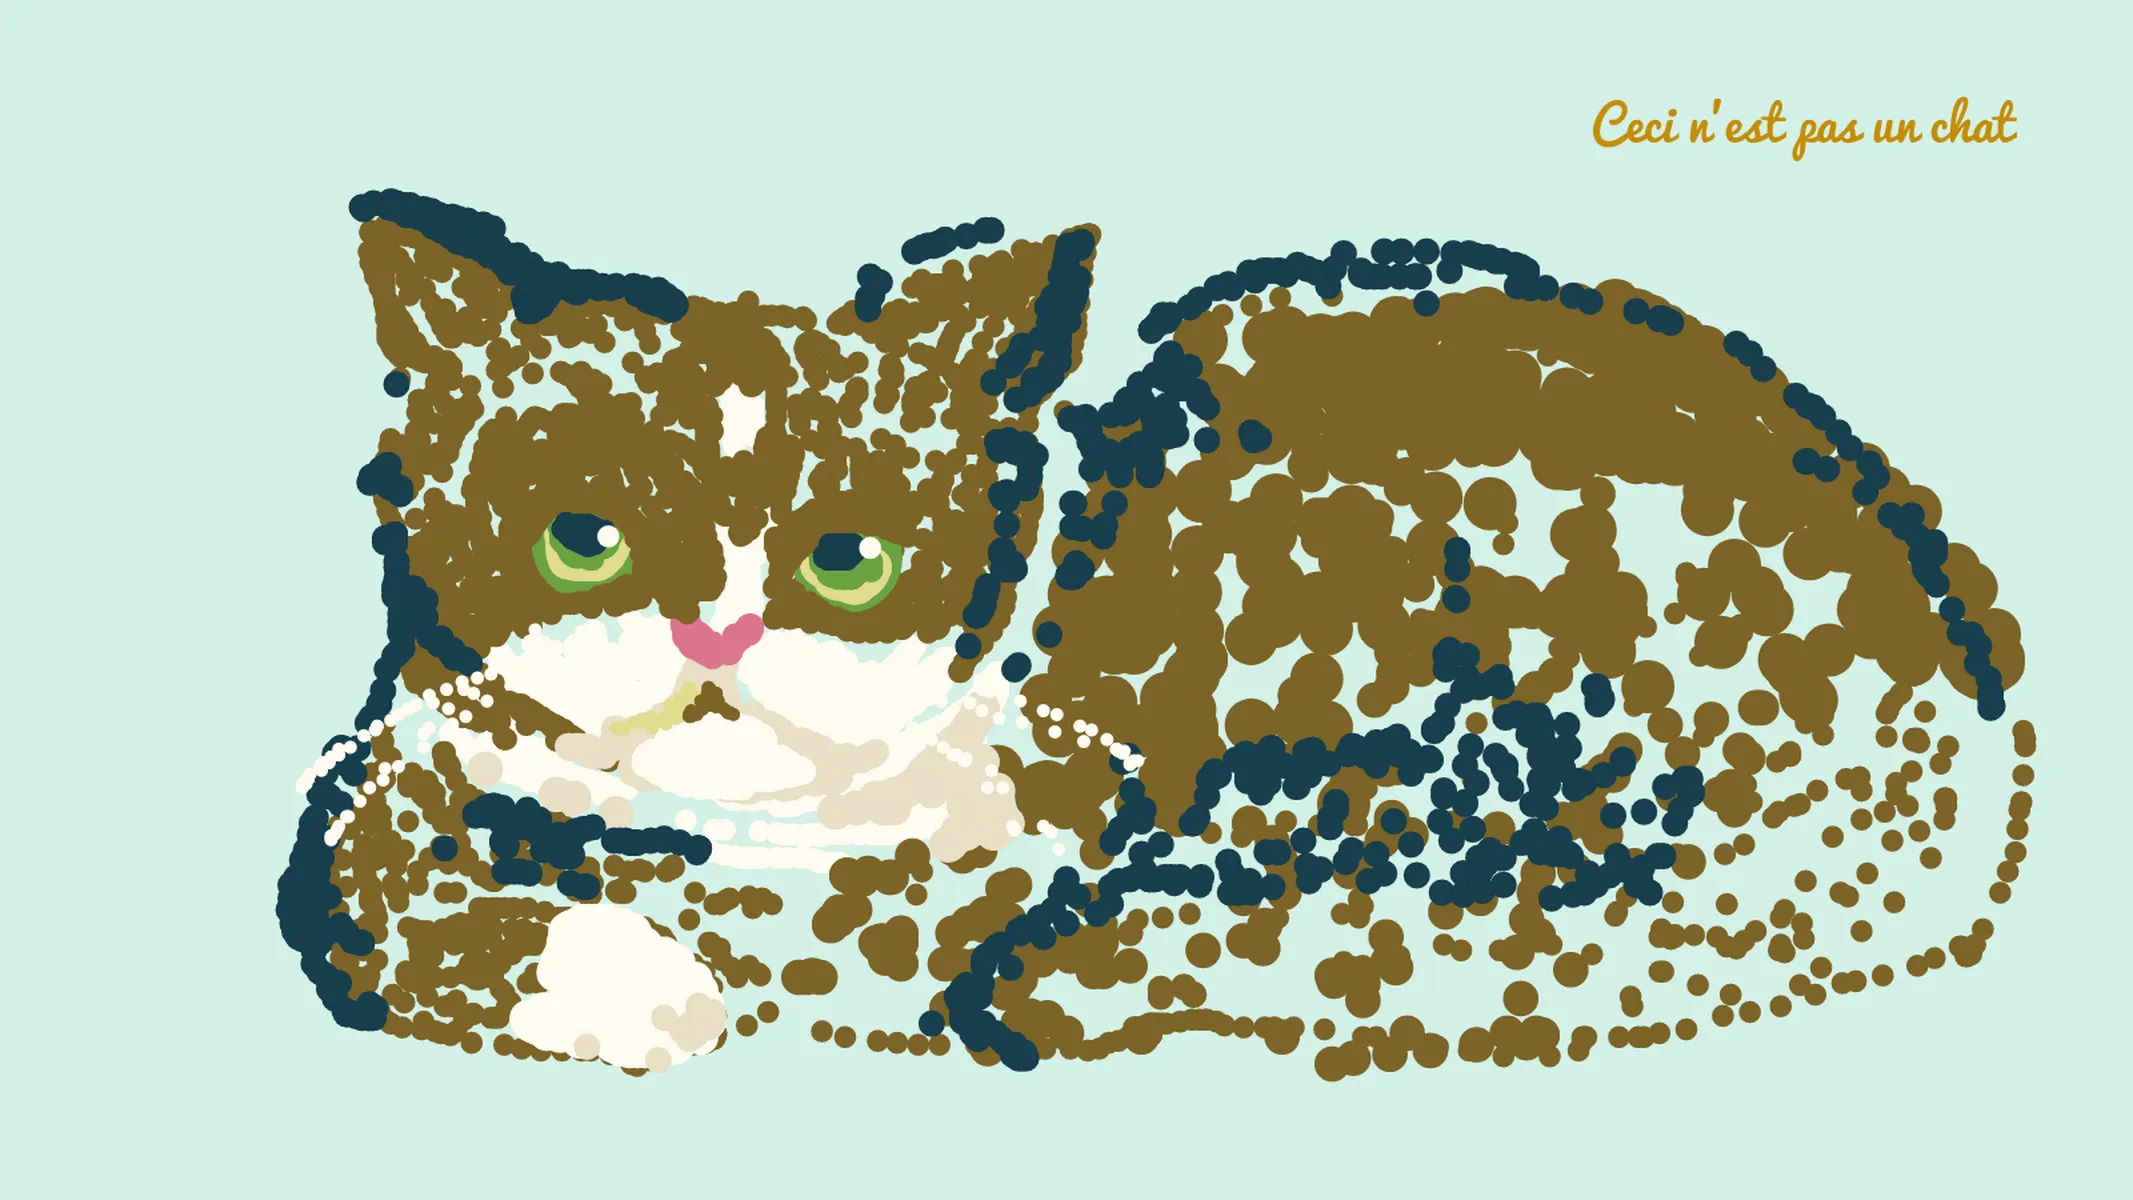
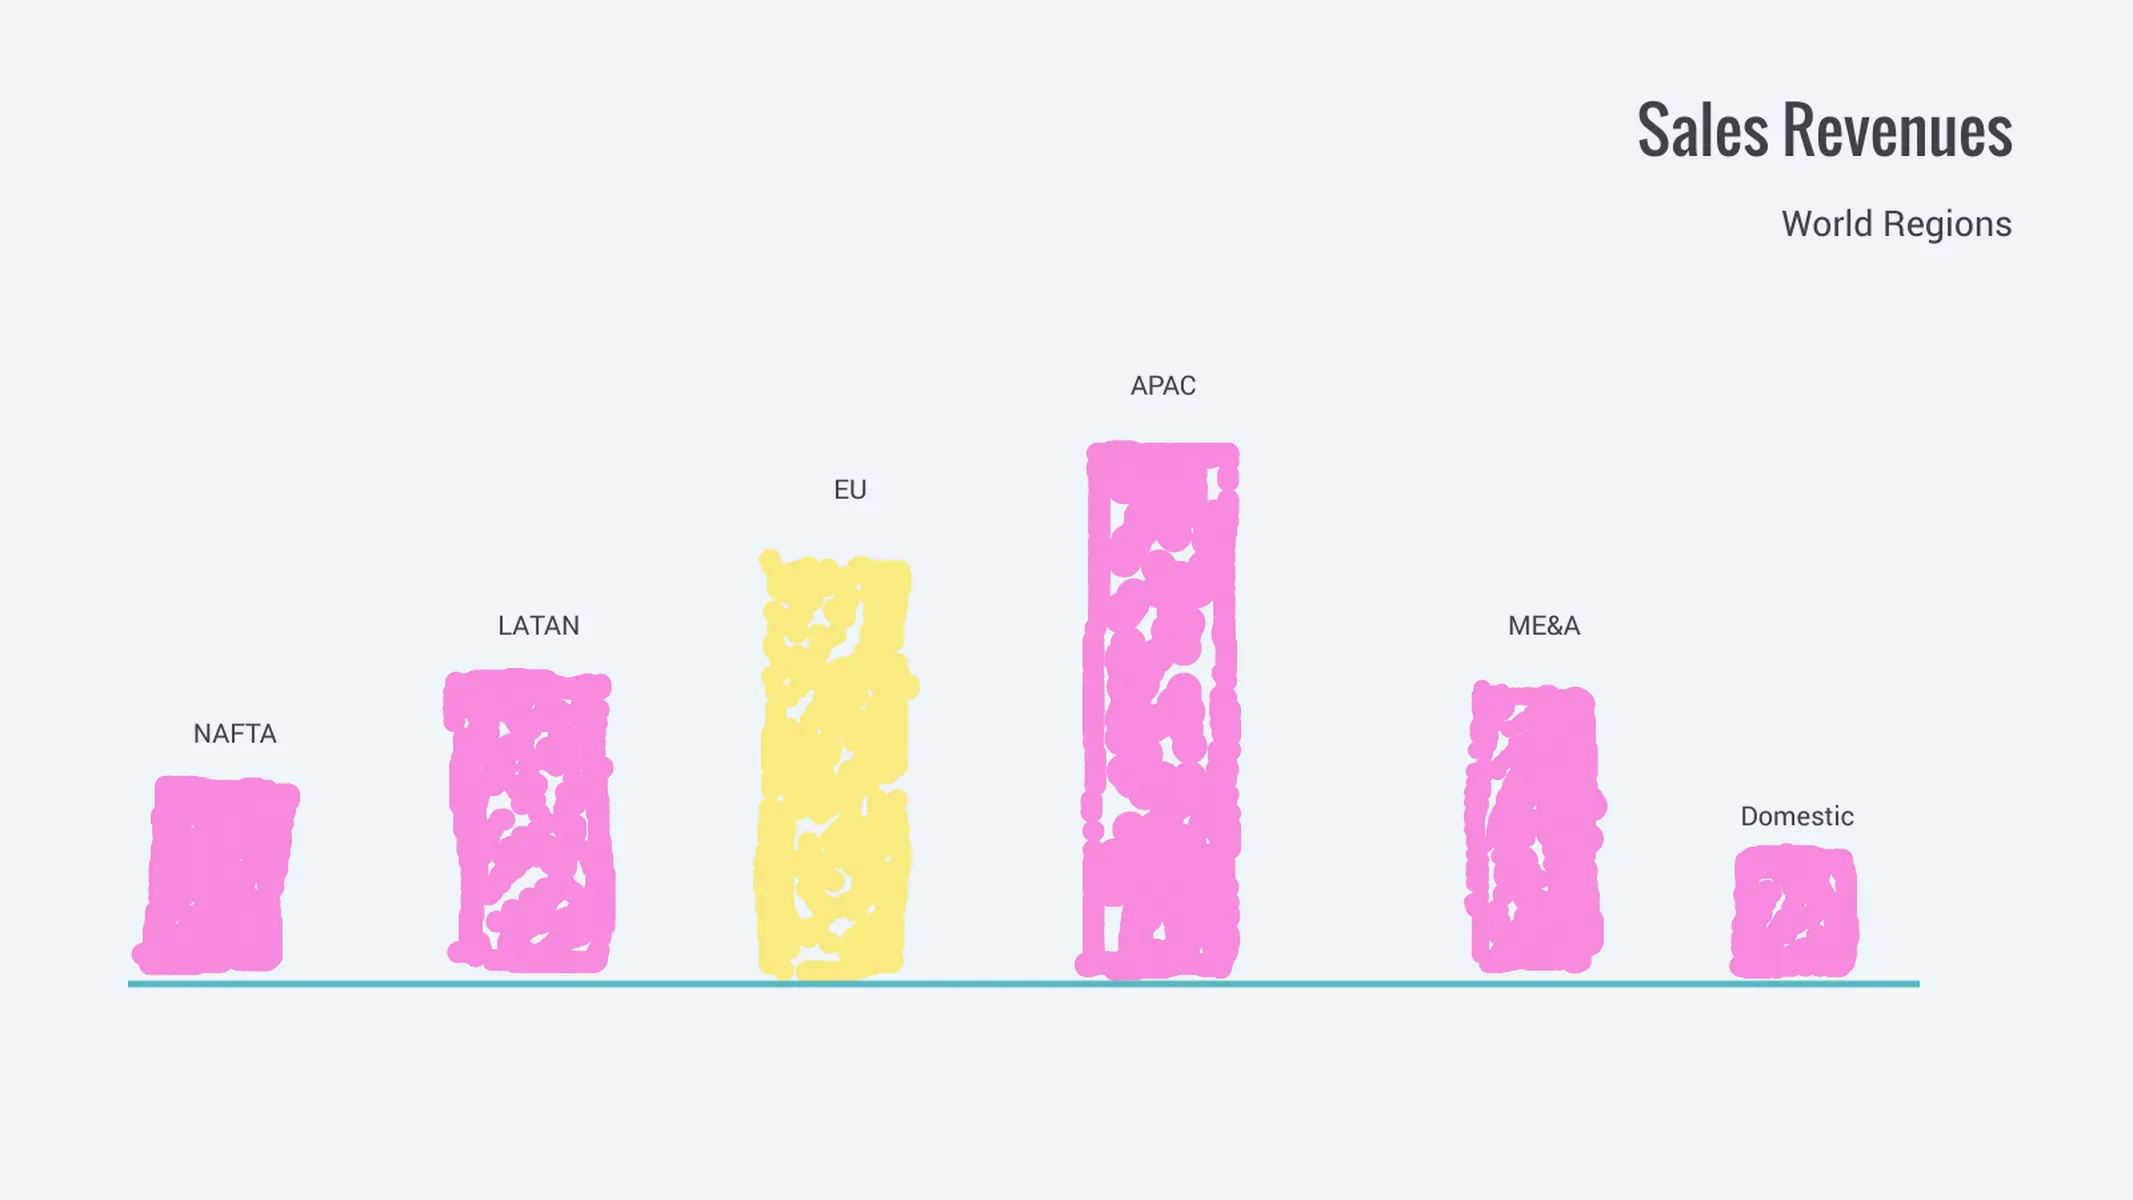
It’s a simple graphics editor and the ultimate visualization tool that allows you to elucidate any data or concept. You can draw anything—no designer skills needed!
You’ll love it for its simplicity and versatility: use it to draw bars, lines, circles, as well as to illustrate complex concepts freely. It’s the best and quickest solution to substitute those PowerPoint templates full of shapes and arrows.
Conceive your message professionally, create your visualizations with Vizzlo Paint: it’s easy as pie.
How to create a chart with Vizzlo Paint?
Create your data-driven or concept-driven visualization in Vizzlo Paint in seconds! Follow these easy steps:
- Choose the desired color from the color palette
- Choose the size of your brush by moving the slider sideways
- Click on the document and draw freely
Pro tip: use different colors and sizes to make more compelling visualizations.
Vizzlo Paint: What's new?
Vizzlo Paint Alternatives
Use Cases
Pictorial chartsEnhance your productivity
Create a Vizzlo Paint directly in the tools you love

Create a Vizzlo Paint in PowerPoint with
Vizzlo's add-in
Loved by professionals around the world


Visualizations your audience won’t forget
Convey abstract concepts and data with professionally designed
charts and graphics you can easily edit and customize.
