Chart Vizzard
Vizzlo's AI-based chart generatorMake Impressive Timelines
Our free chart maker helps you create beautiful project management timelines. Online, in PowerPoint, or Google Slides.
What is a timeline?
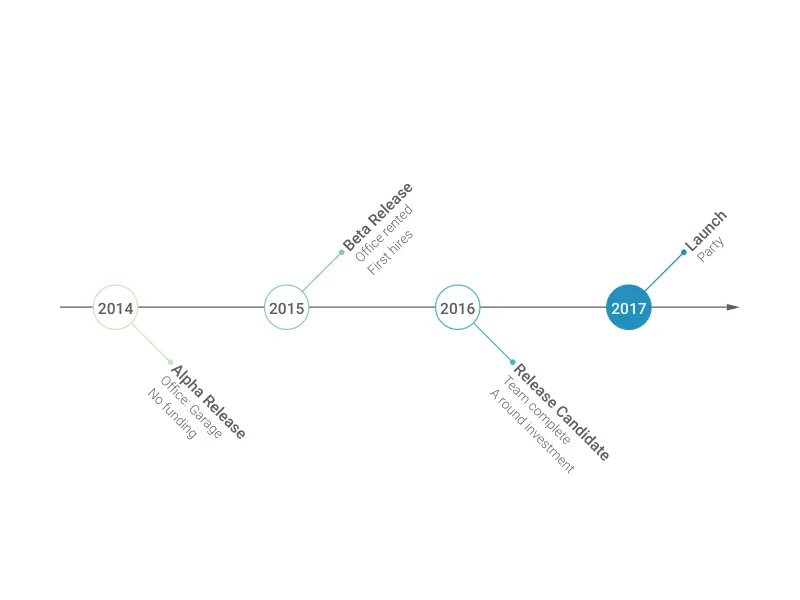
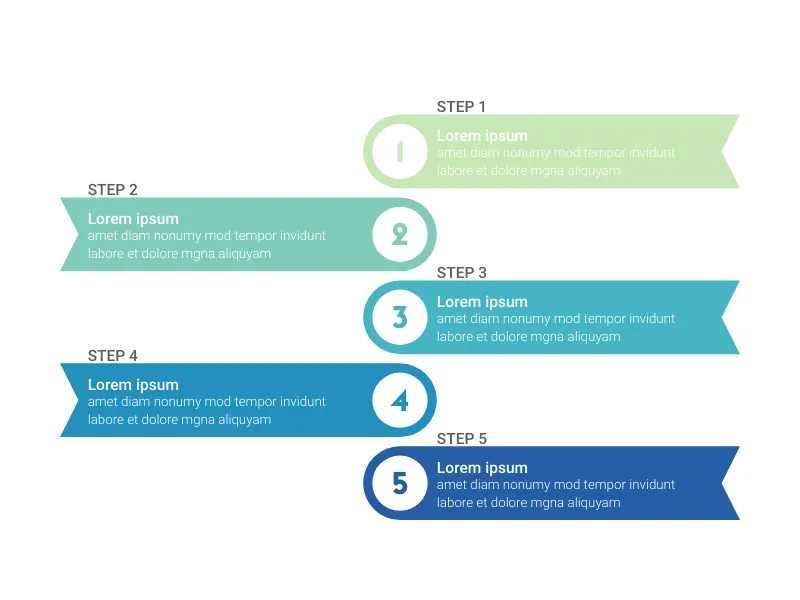
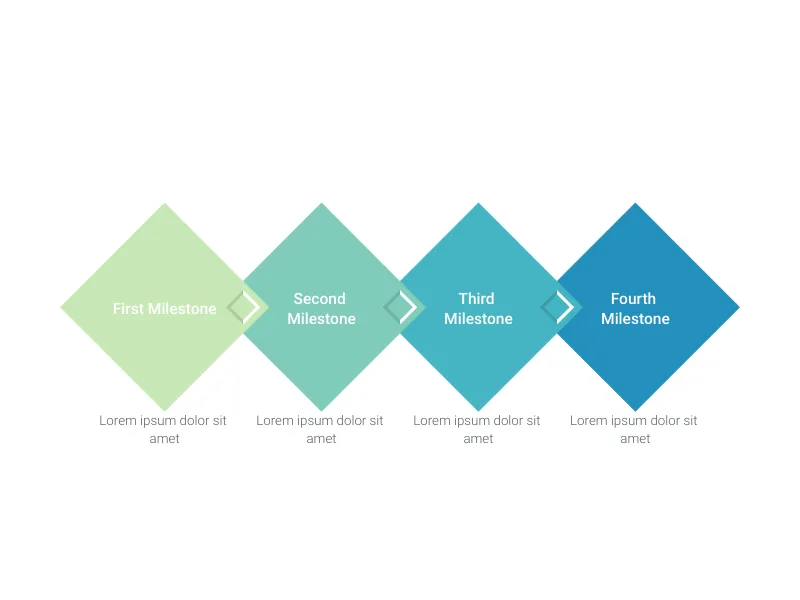
Being able to keep a realistic schedule for your projects is an essential skill that many seek for. A timeline helps to set clear directions and priorities, in which small actionable steps are visualized as milestones that lead to your main goal. Vizzlo’s Timeline helps you to break a complex project down into pieces. So that you have a list of all the necessary steps to be taken before the project is completed. Milestones are displayed in a chronological order to effectively visualize information over time. Timelines provide a great way for you and your team to stay up-to-date on everything that is happening.
Setting up a project timeline does not have to be difficult. Vizzlo makes it easy to create a compelling timeline and export it to your presentations and reports with ease. Whether you need it for project management purposes, to illustrate legal cases, or to outline historical events.
Best uses for the timeline
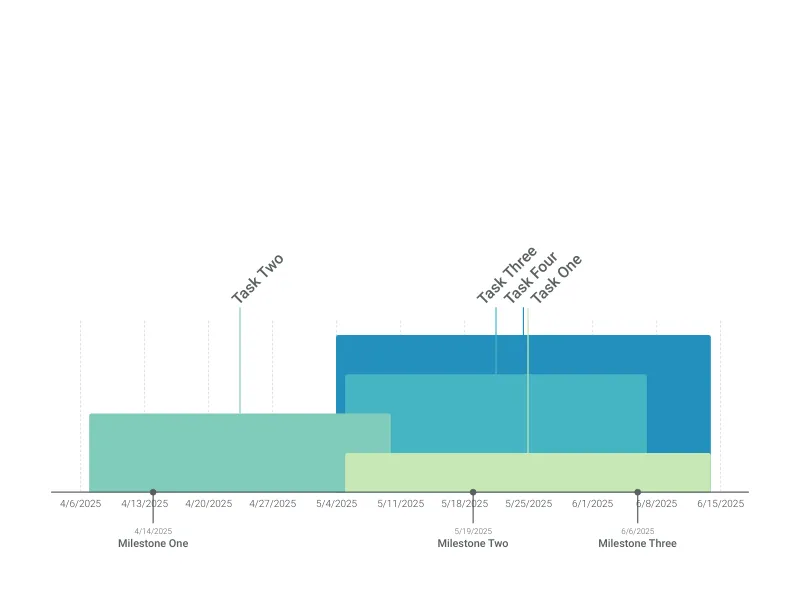
- Visualizing project schedules to help you and your team stay on track.
- Create a legal timeline to show the relation of different facts to one another. How does a witness statement match up with security footage?
- Help teachers and students create timelines for assignments.
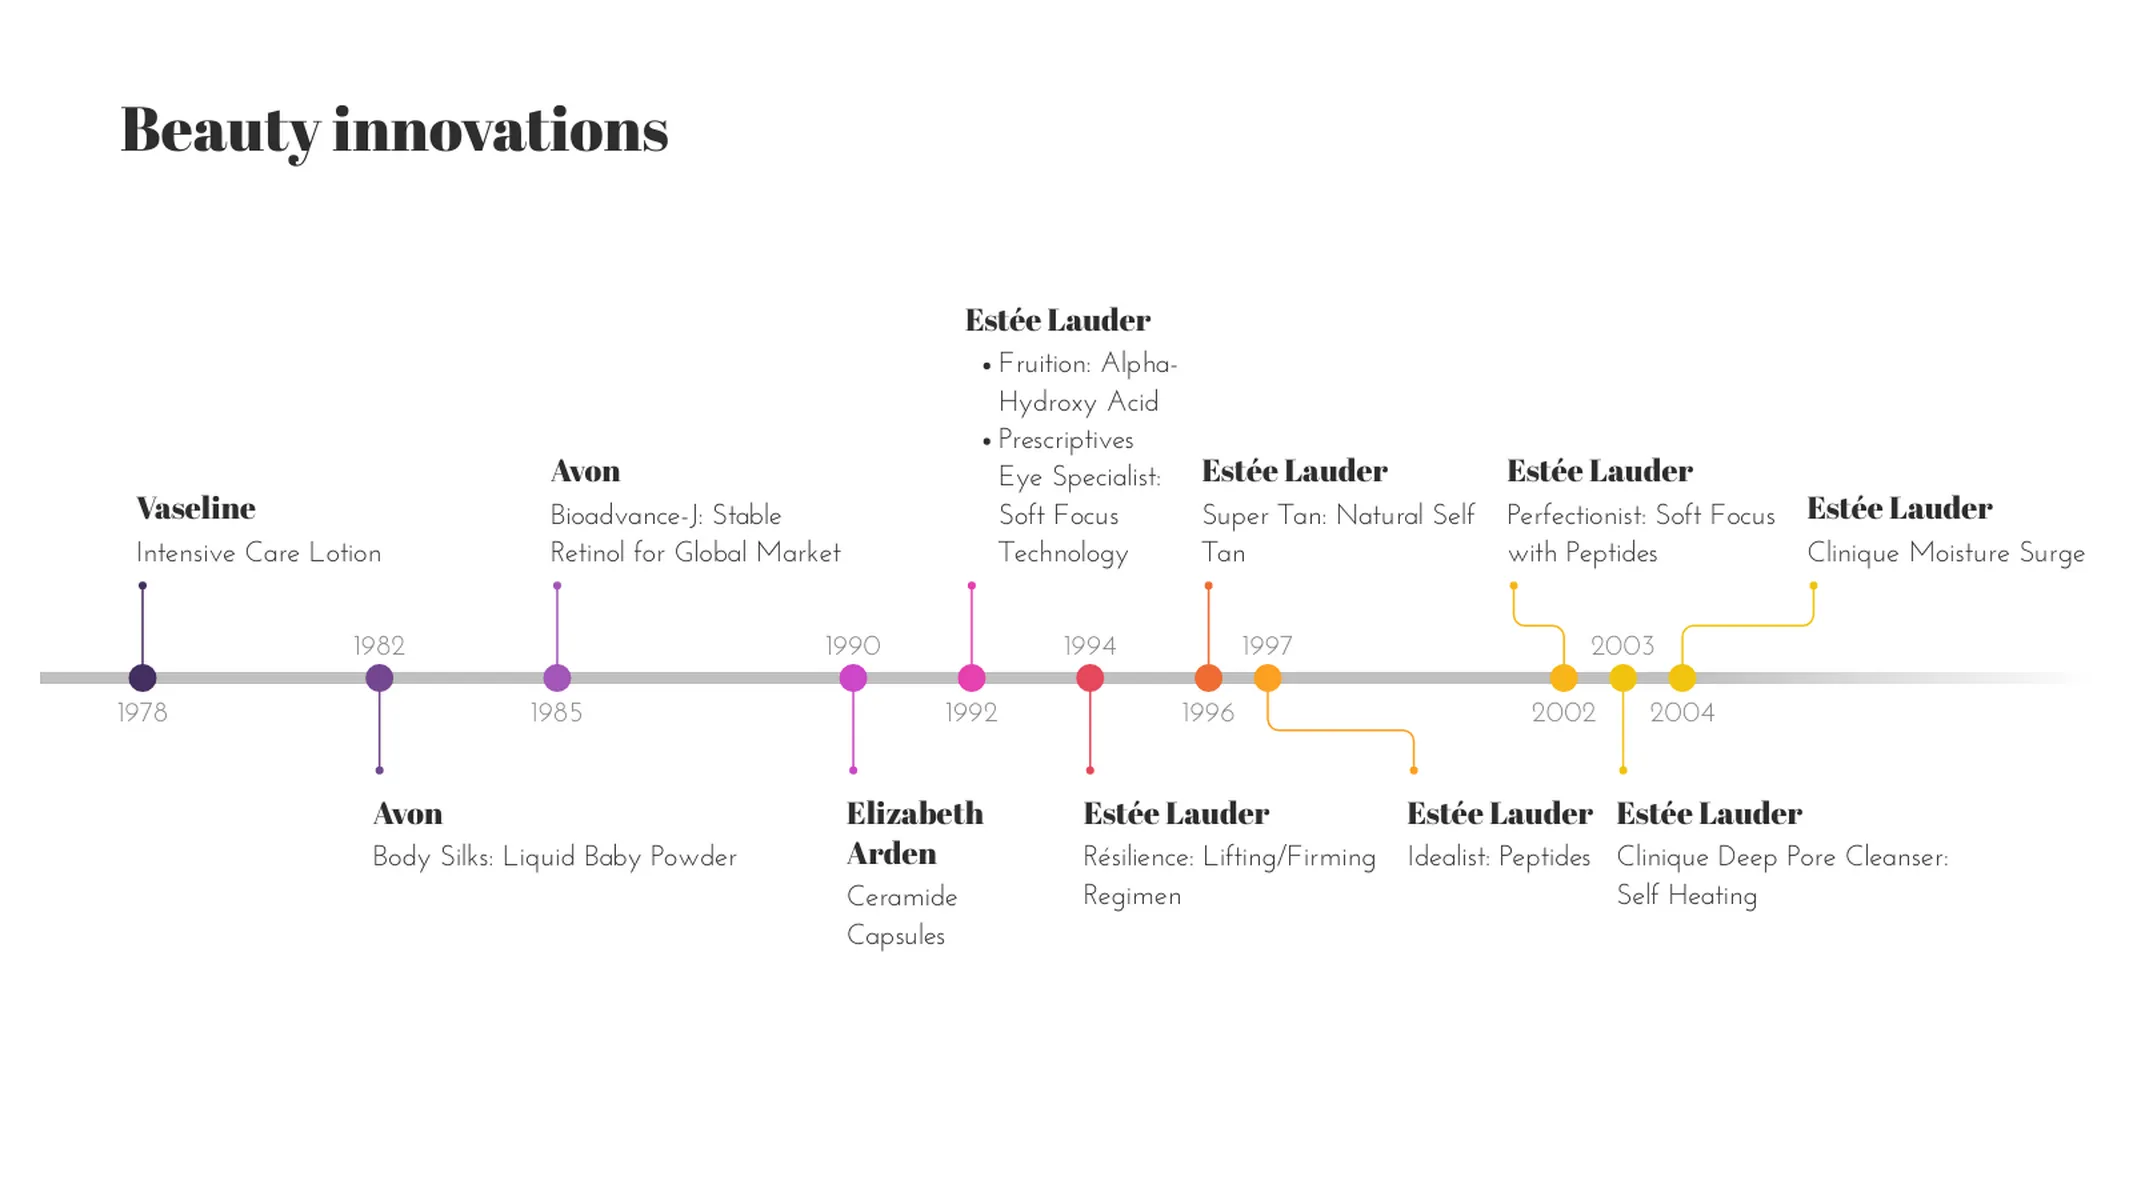
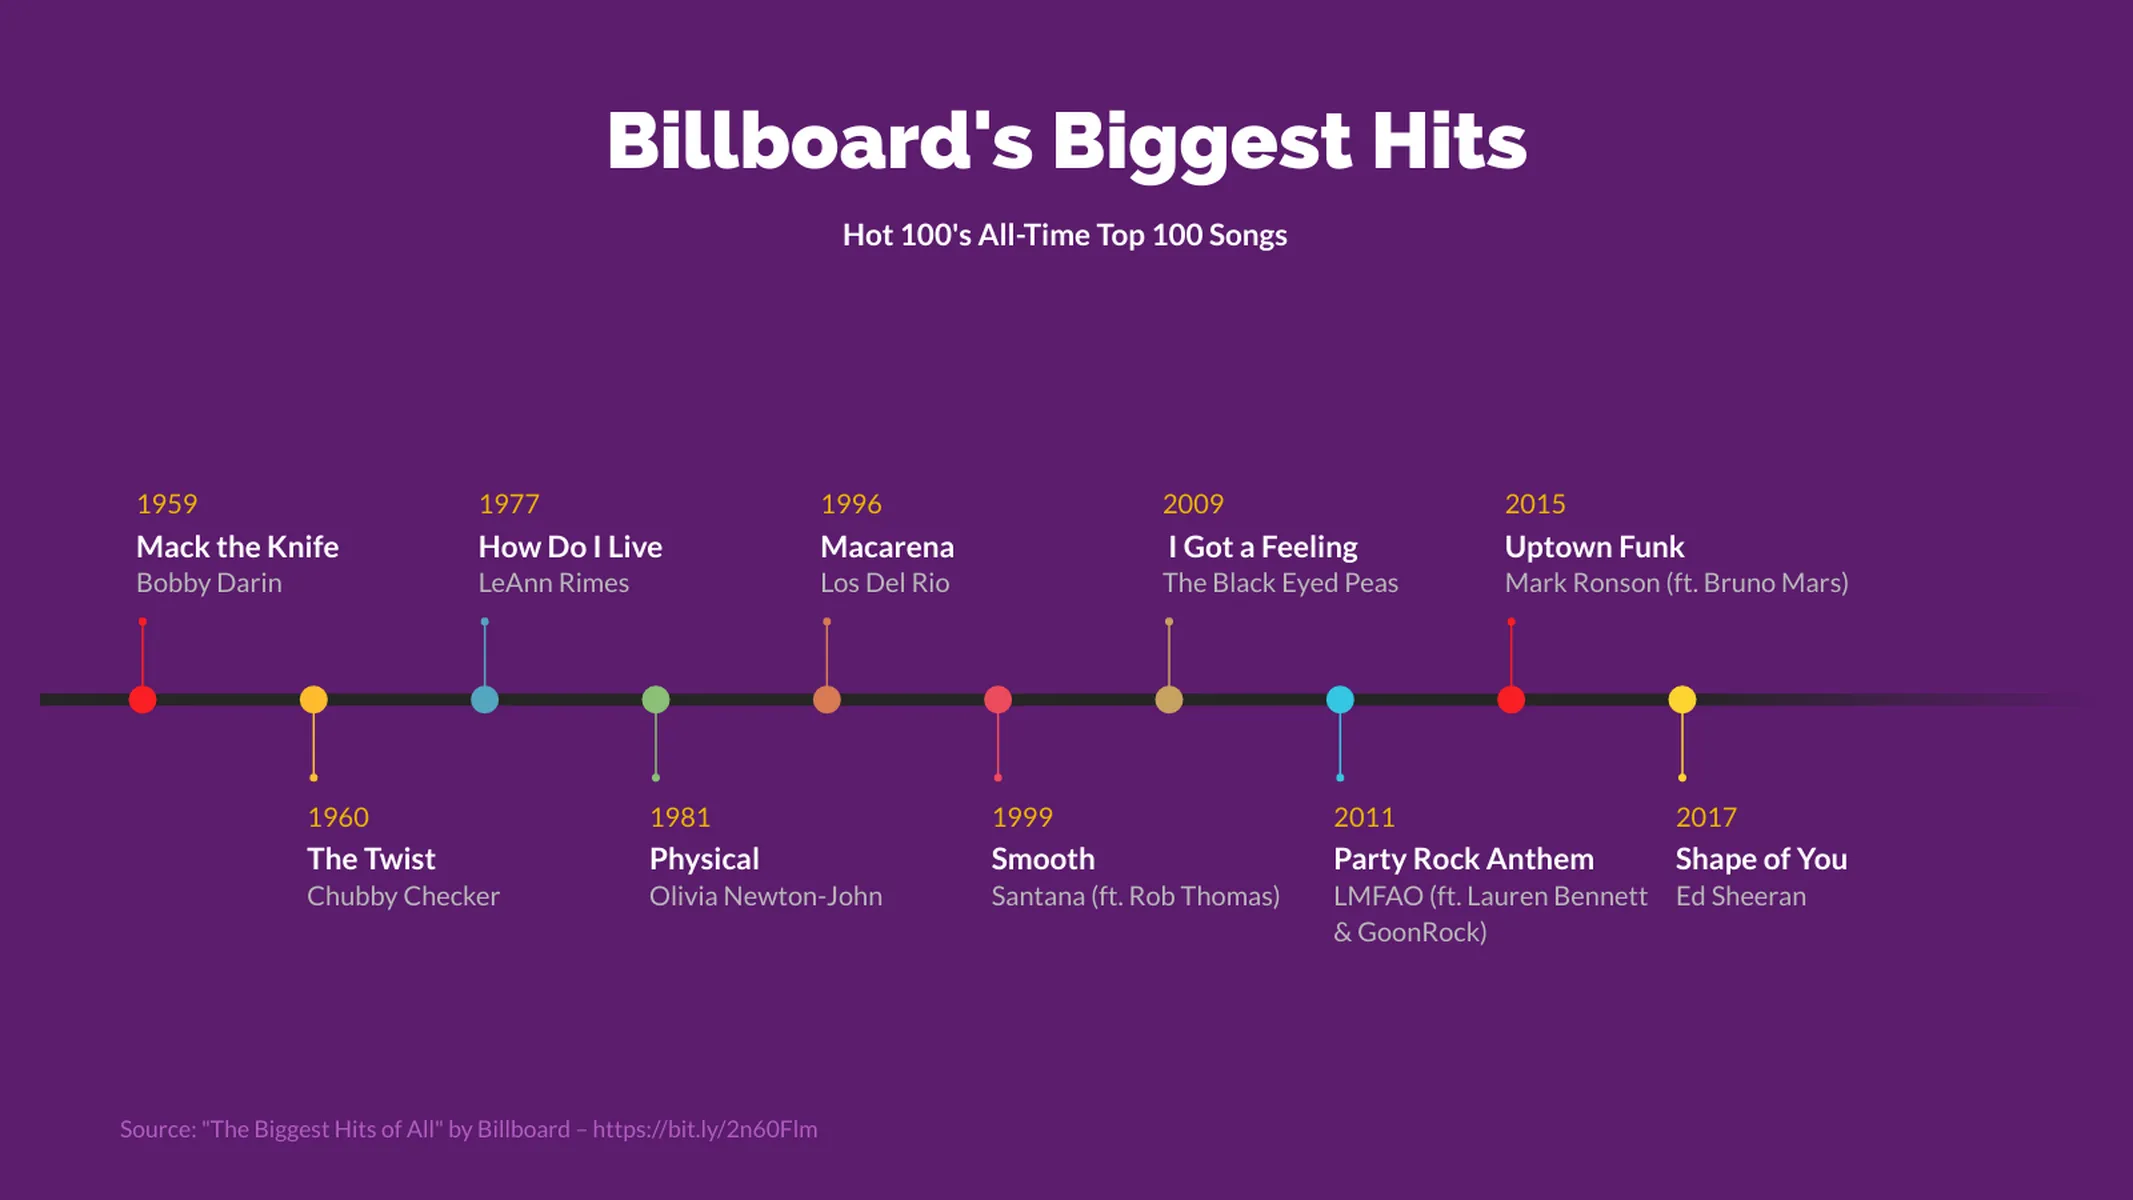
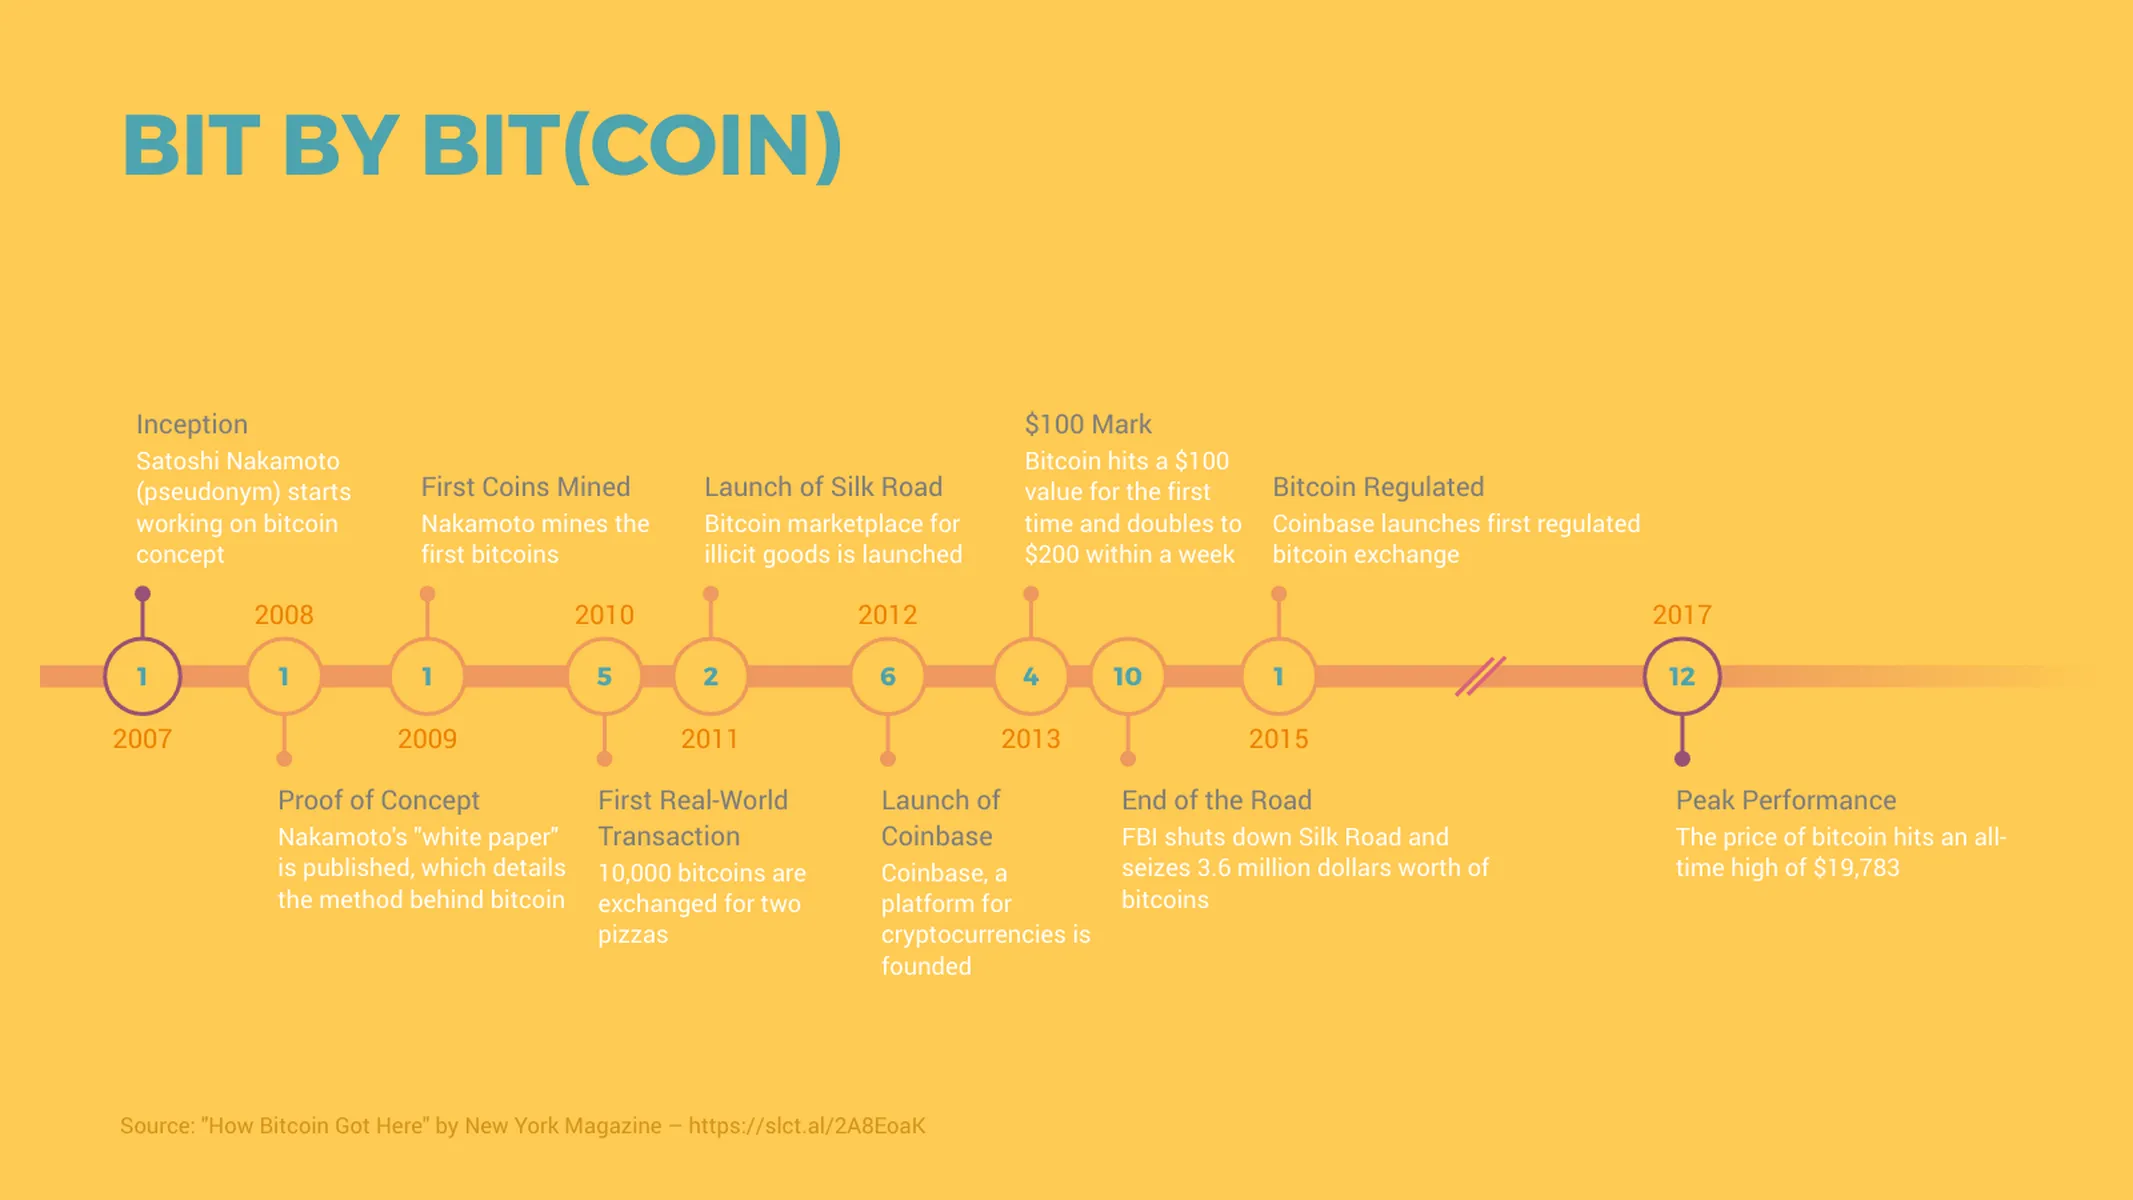
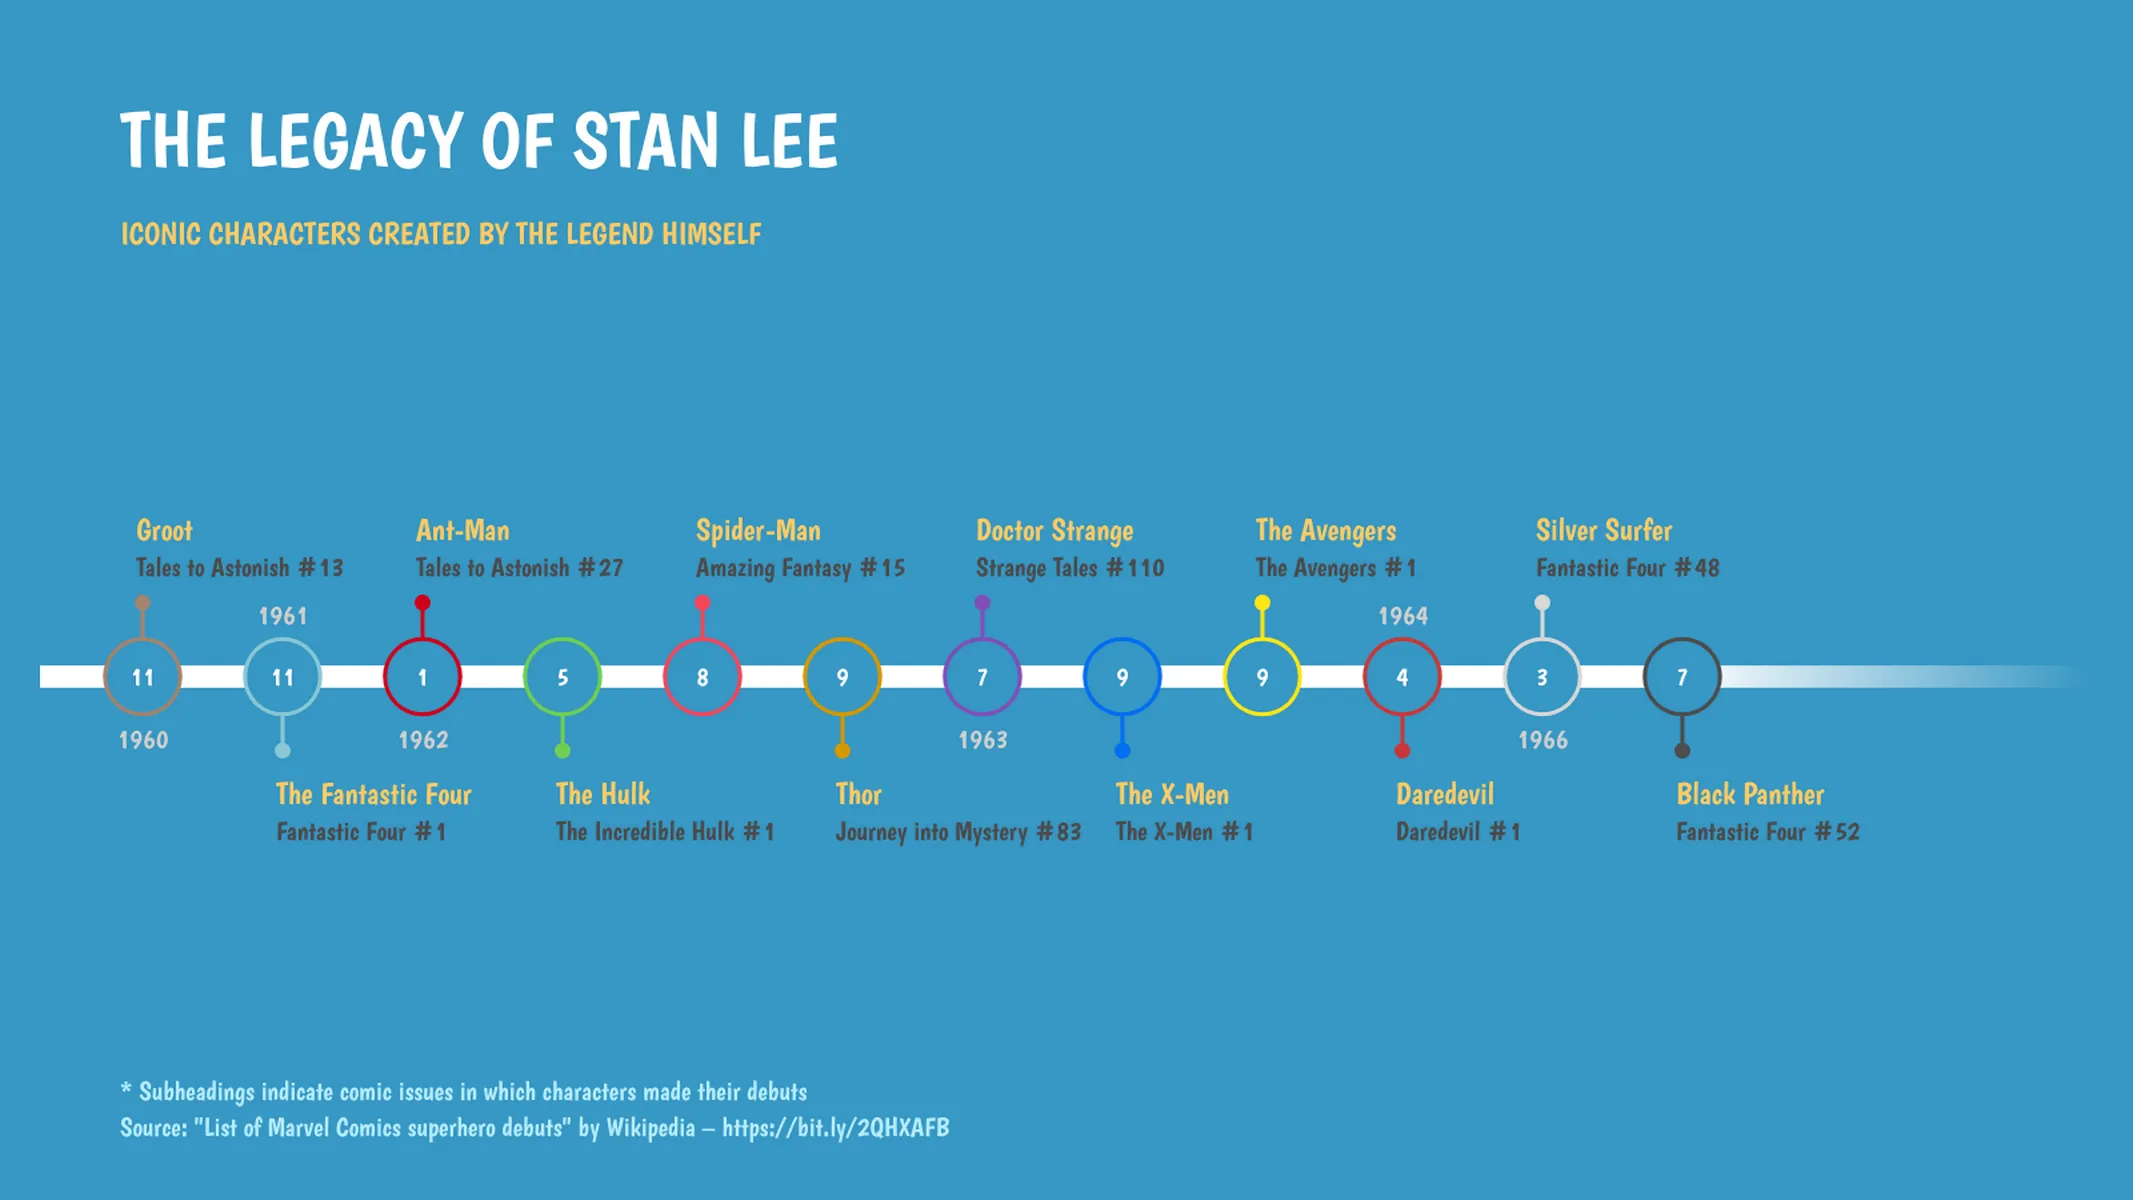
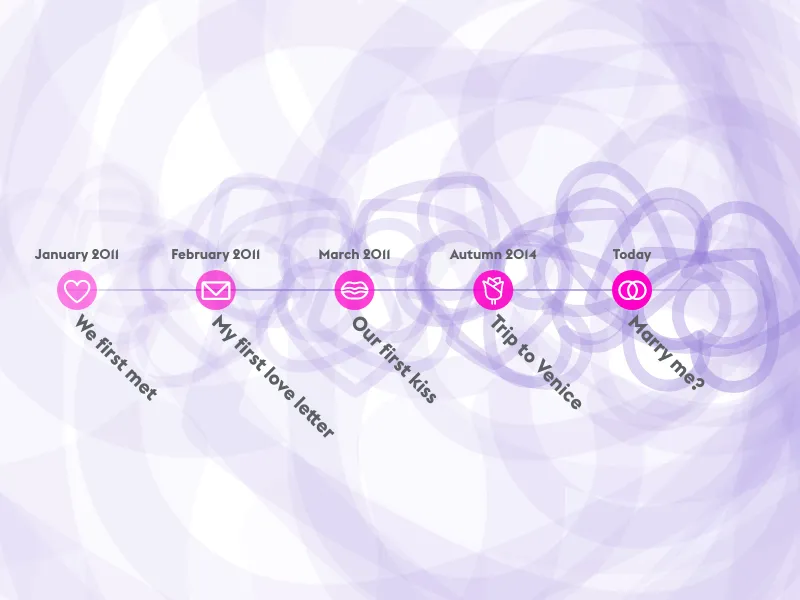
- Communicating historical data in a fun, visual, and easily understandable way.
How to make a timeline with Vizzlo?
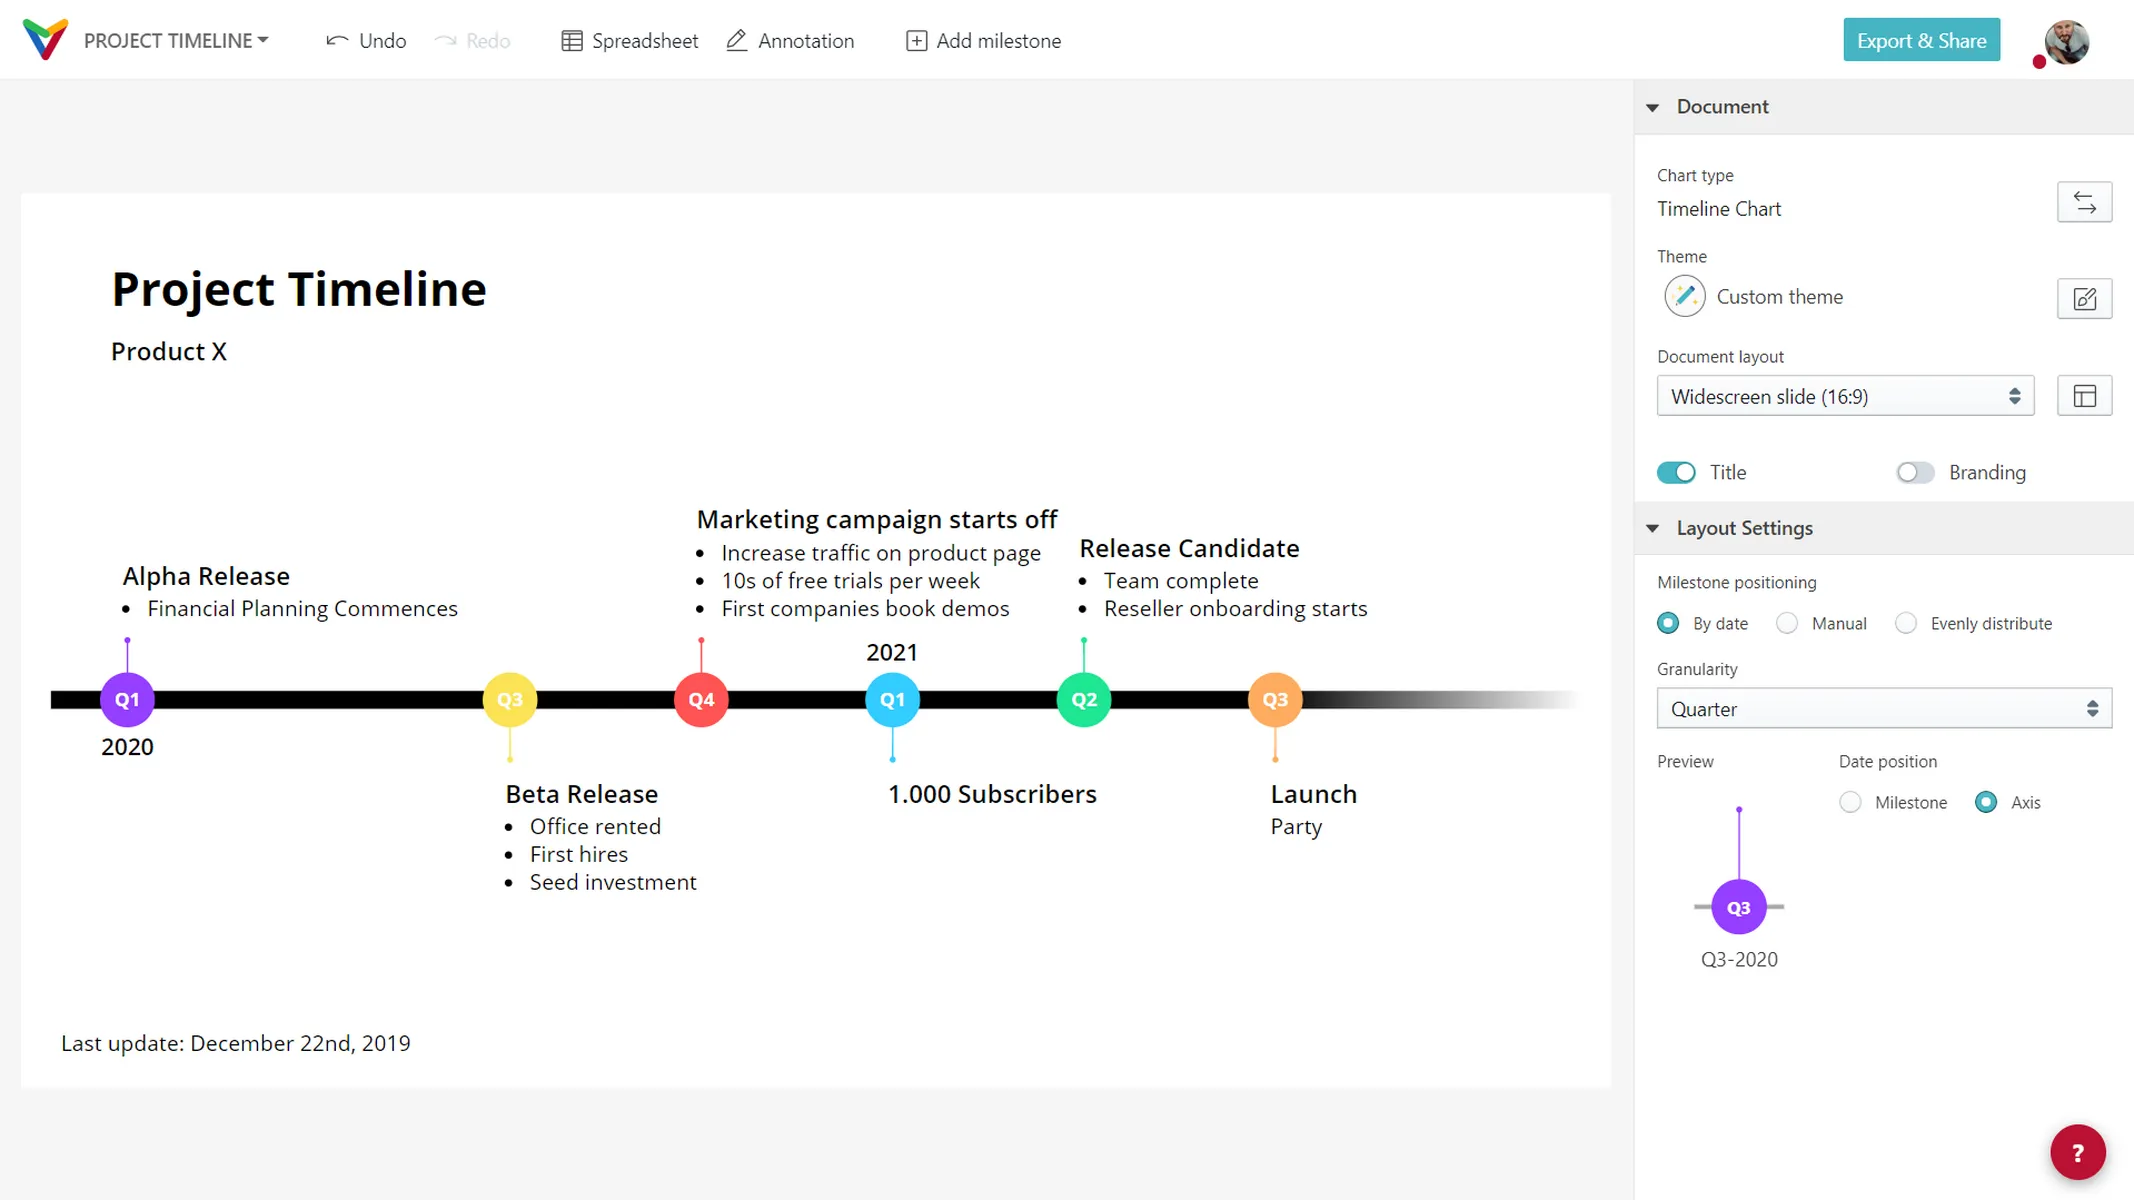
- Click on any milestone to edit the data and change colors if necessary.
- Click on the time axis to add a new milestone or a scale break.
- Change the document layout from 4:3 to 16:9, or define a custom layout.
- Change the date display format.
- Define in which granularity the milestones should be positioned: by day, week, month, quarter, or year.
- Fine-tune the look of your timeline with the many customization options that the Vizzlo theme editor offers.
Timeline: pro tips
- Quickly add a larger amount of data and import your data as a Microsoft Excel file or CSV file. For this, click on the button Spreadsheet in the menu bar.
- Adjust the date format easily and choose from many options for different locales.
Timeline maker: key features
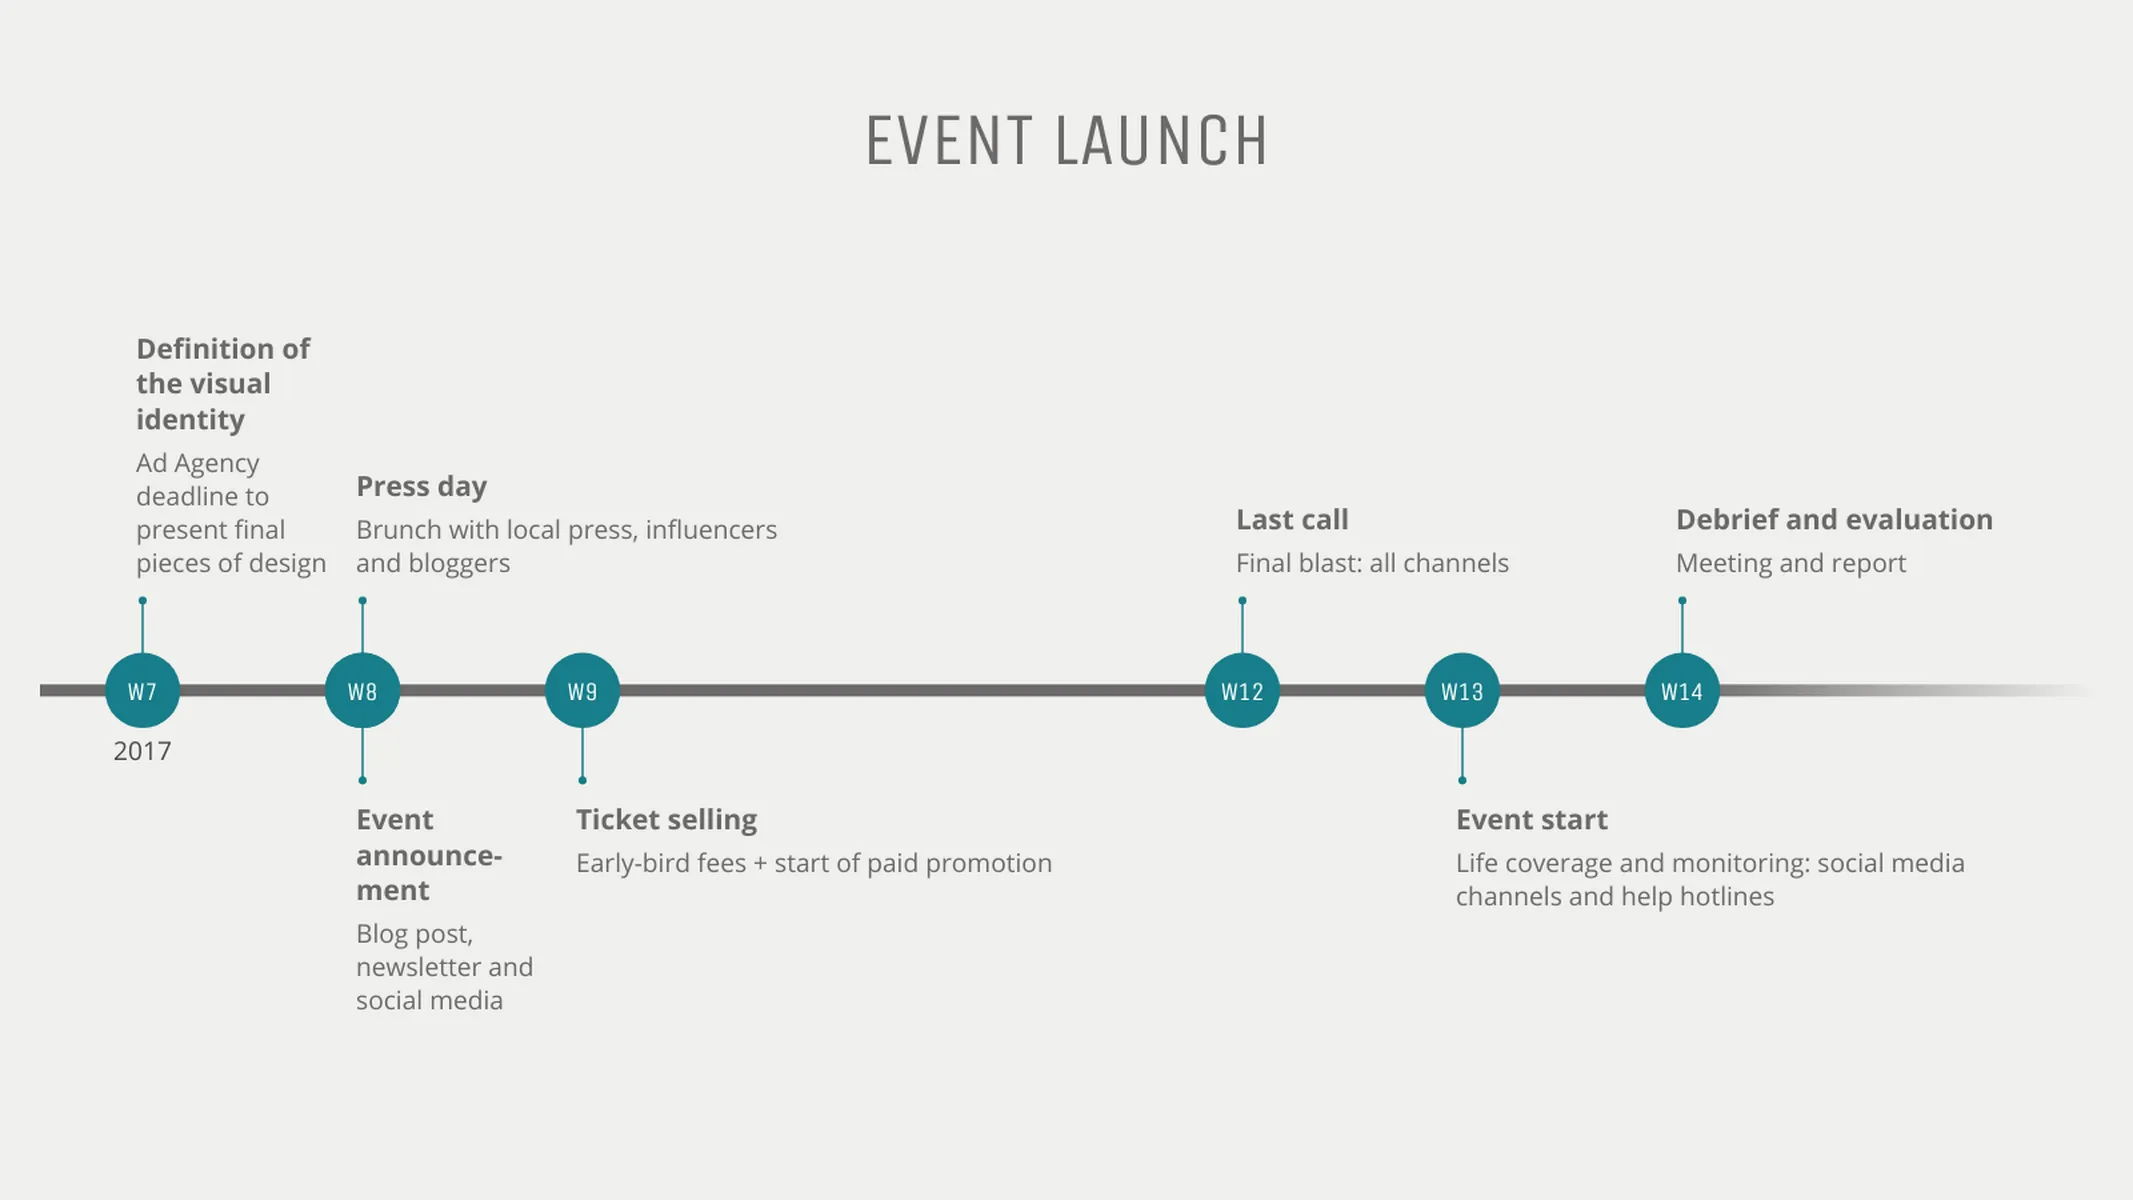
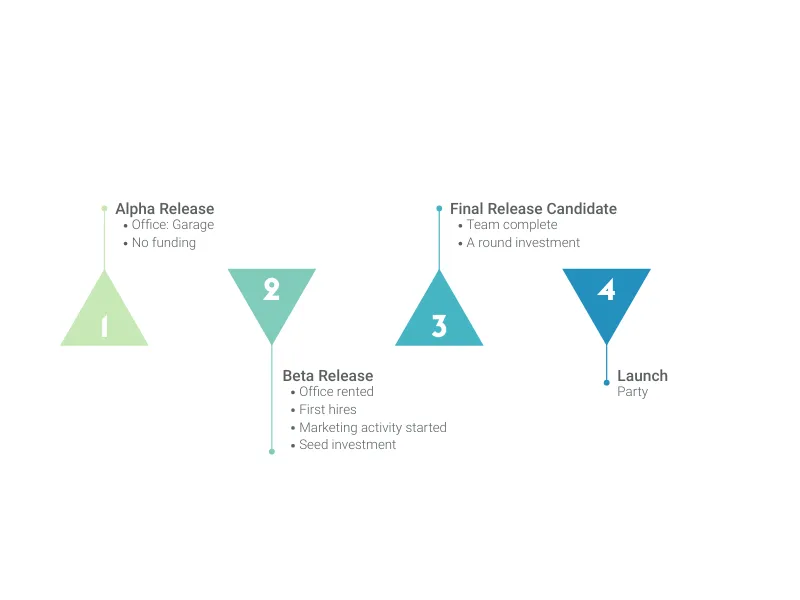
- Vizzlo offers a project timeline with milestones.
- Switch between dated-based positioning of milestones or position them manually. You get impressive templates, powerful features, and drag & drop simplicity.
- By default, Vizzlo’s Timeline will present your data as milestones on a linear scale. A unit of distance is equal to a set amount of time.
- Vizzlo parsed over 20 date formats and different locales. No need for you to worry about the correct data import.
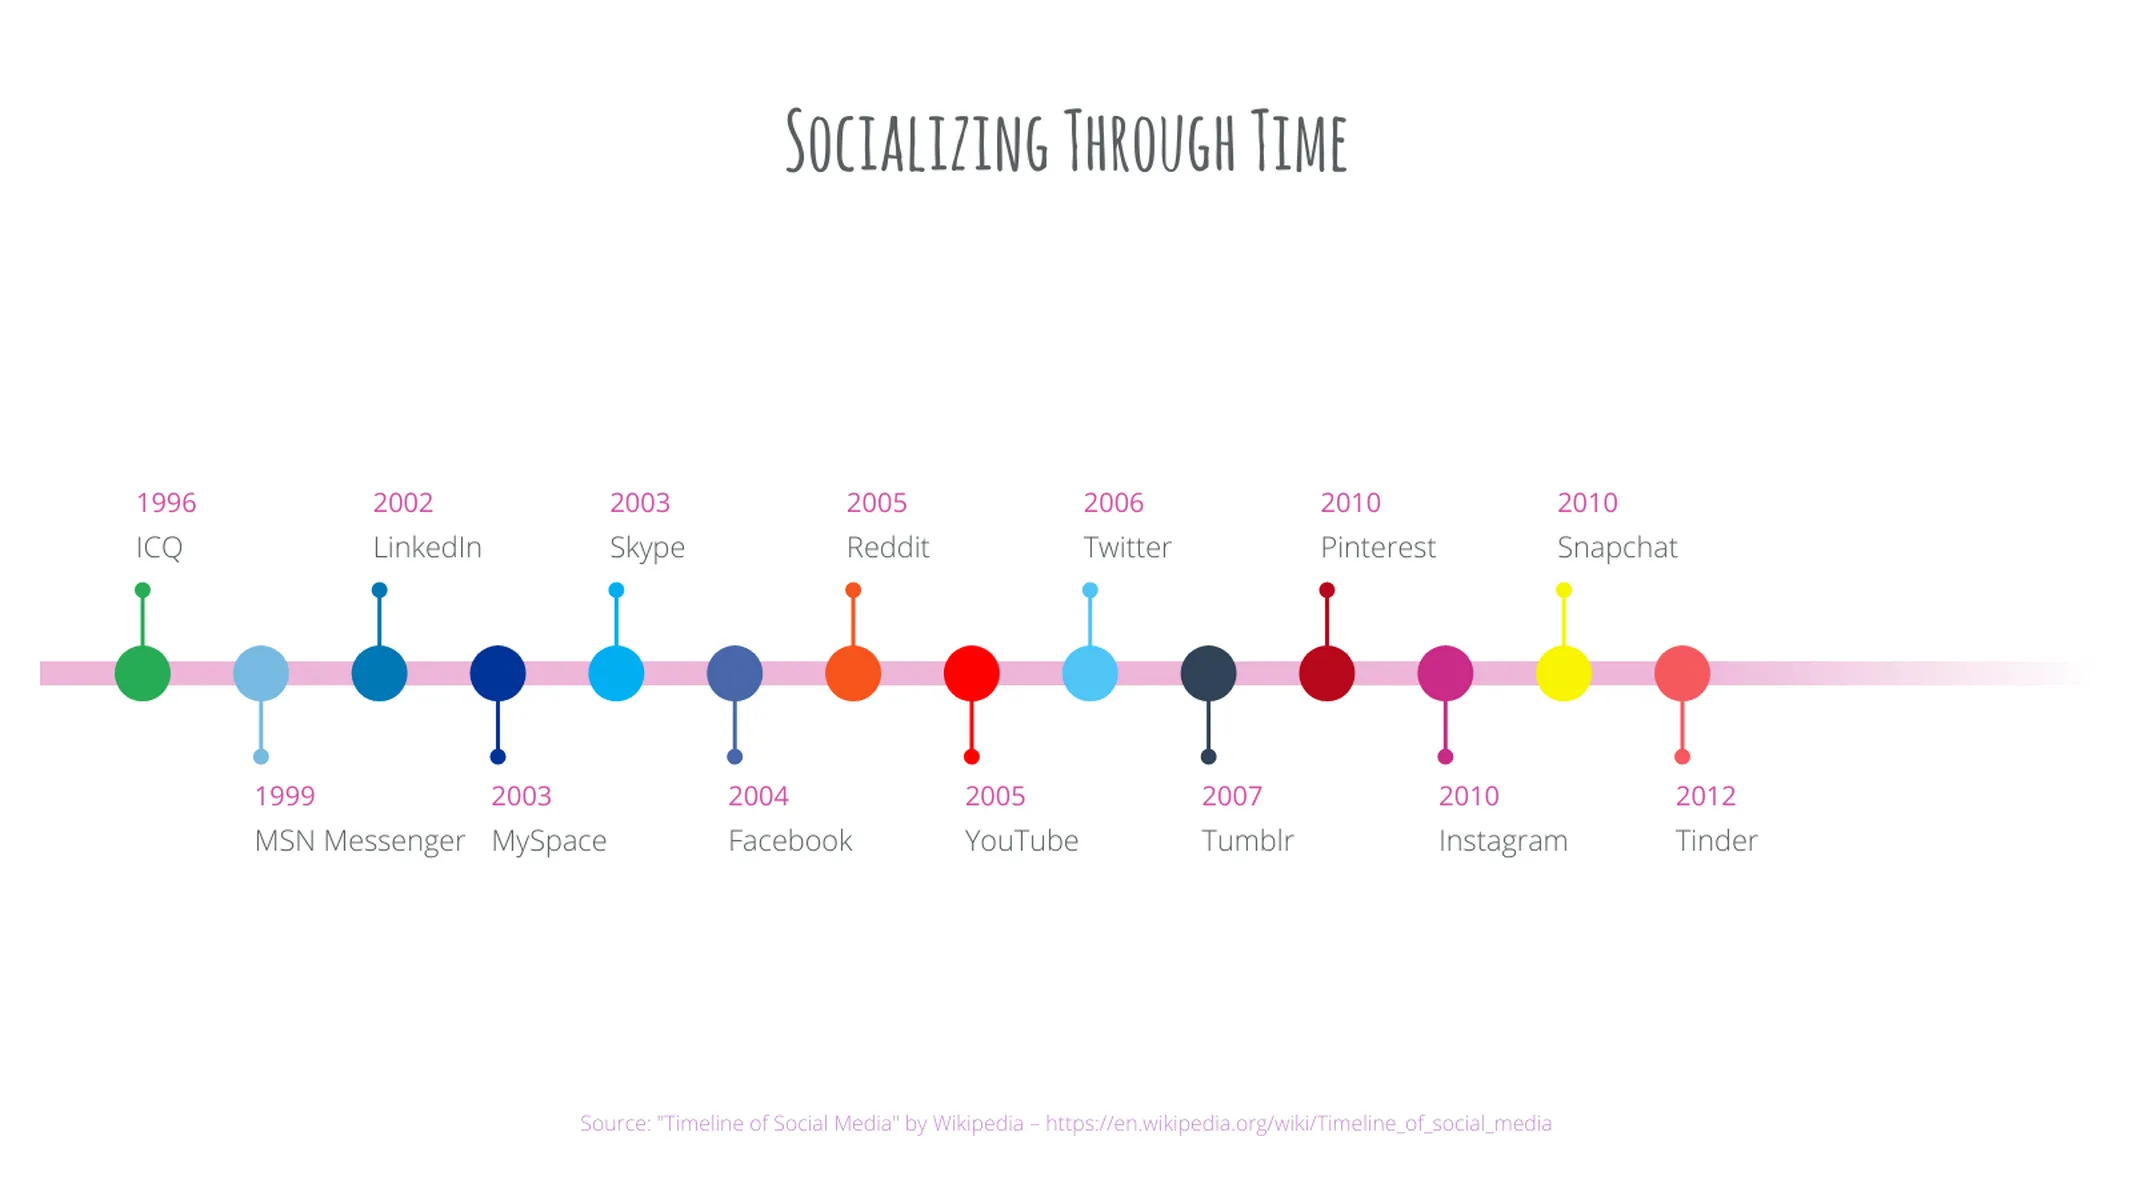
- Evenly distribute your milestones for a clear visual.
- Choose from custom date formats for many locales.
- Change the colors and shapes of the milestone.
- Position your milestones in different levels of time from daily, weekly, monthly, quarterly to yearly.
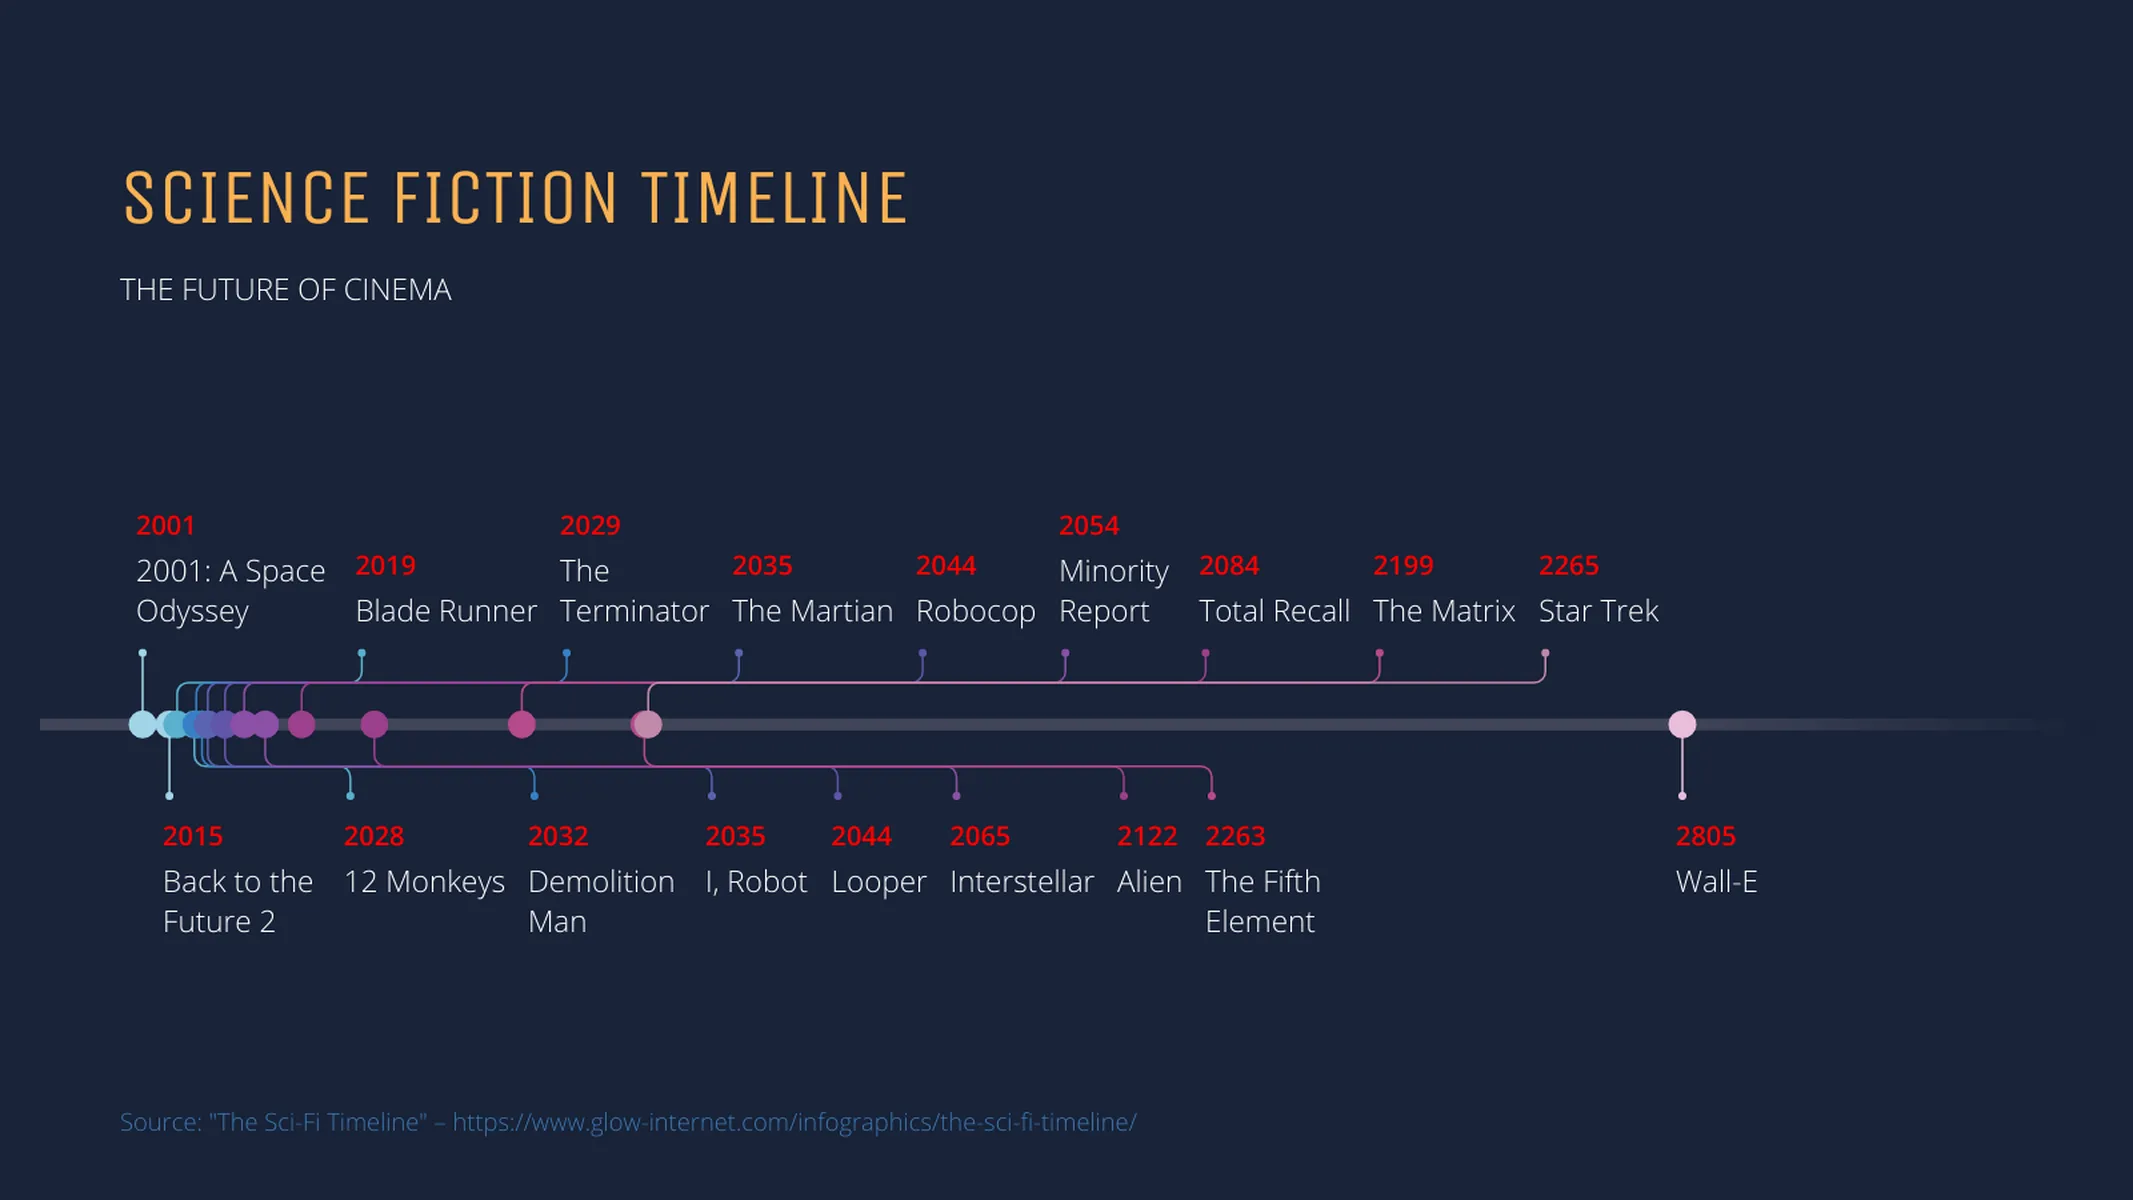
- Deviate from a linear time scale and add optional scale breaks.
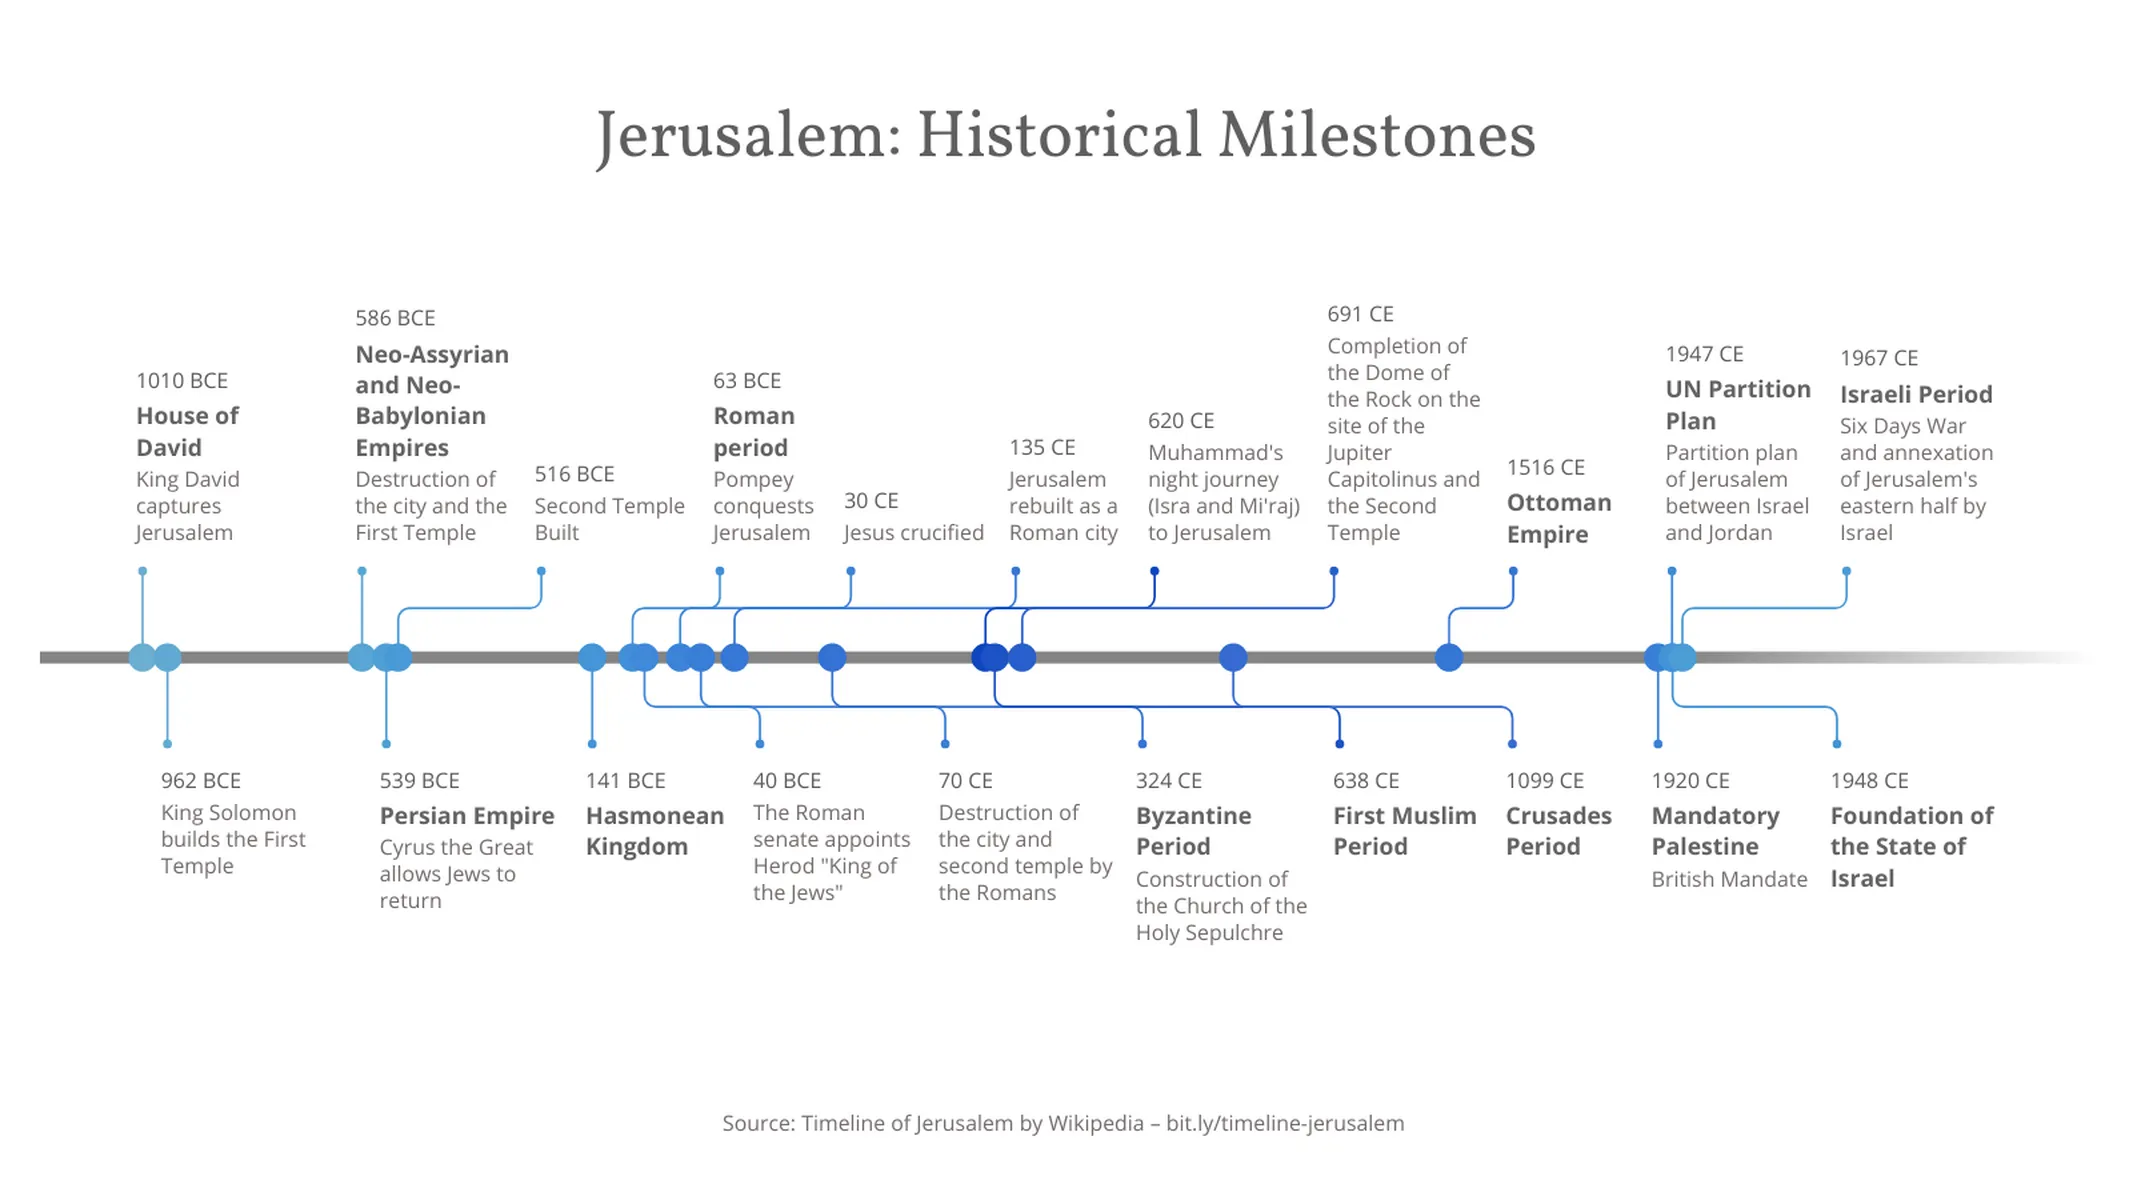
- Display milestones as historical data “Before the Common Era” (BCE) and “Common Era” (CE).
- You can download timelines in PNG, or PDF.
- You can embed timelines on your website.
Resources
- Step-by-step tutorial
- Date formats that Vizzlo can interpret
- Blog Post: Increase the clarity of your project schedule with 5 Charts & Timelines
Timeline Chart: What's new?
Adding historical dates is now possible after using the checkbox in the sidebar.
The styling of individual numerical value labels can now be modified—much in the same way you’ve been able to format the text labels before.
Timeline date formatting works more reliably now when editing the same document from multiple timezones.
We cleaned up the user interface and fixes some minor things about date formats.
The initial date format displayed in your chart will match your locale now.
Enhance your productivity
Create a Timeline Chart directly in the tools you love

Create a Timeline Chart in PowerPoint with
Vizzlo's add-in

Loved by professionals around the world


Visualizations your audience won’t forget
Convey abstract concepts and data with professionally designed
charts and graphics you can easily edit and customize.