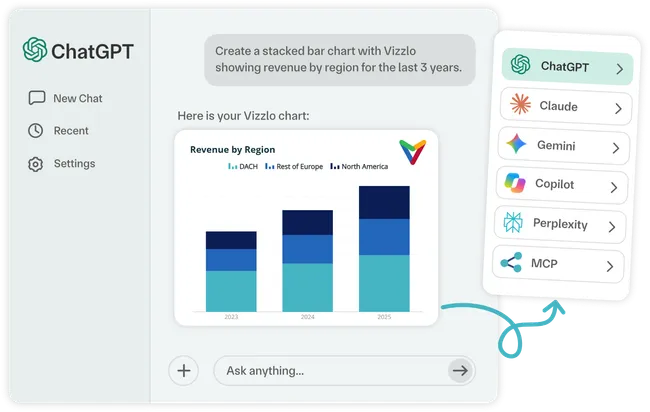
Build presentations with ChatGPT. Vizzlo powers the charts.
Create presentations, reports, and business analyses with ChatGPT, while Vizzlo handles the charts. Turn your data into professional visualizations you can refine in ChatGPT or customize further in Vizzlo.
From prompt to chart, right inside ChatGPT
Describe what you need in natural language. ChatGPT uses Vizzlo to create the chart, which you can refine in the conversation or open in Vizzlo for more control.
-
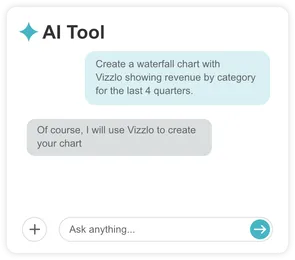
Ask for a presentation or chart
-
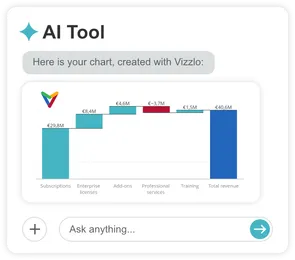
Get professional Vizzlo charts
-
Refine and customize
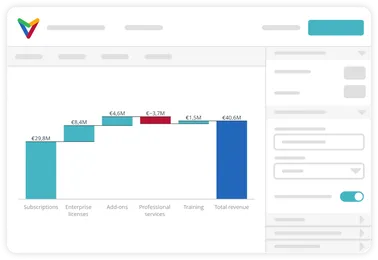
Turn your ChatGPT data into professional charts
Working with spreadsheets, uploaded files, or tables in ChatGPT? Use Vizzlo to turn your data into clear, editable visualizations without starting over.
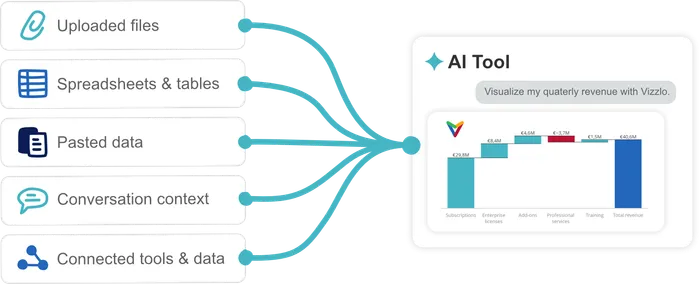
Go beyond basic AI-generated charts
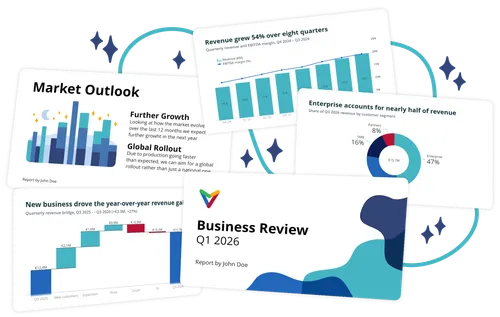
Turn AI-generated insights into polished, presentation-ready visualizations with Vizzlo.
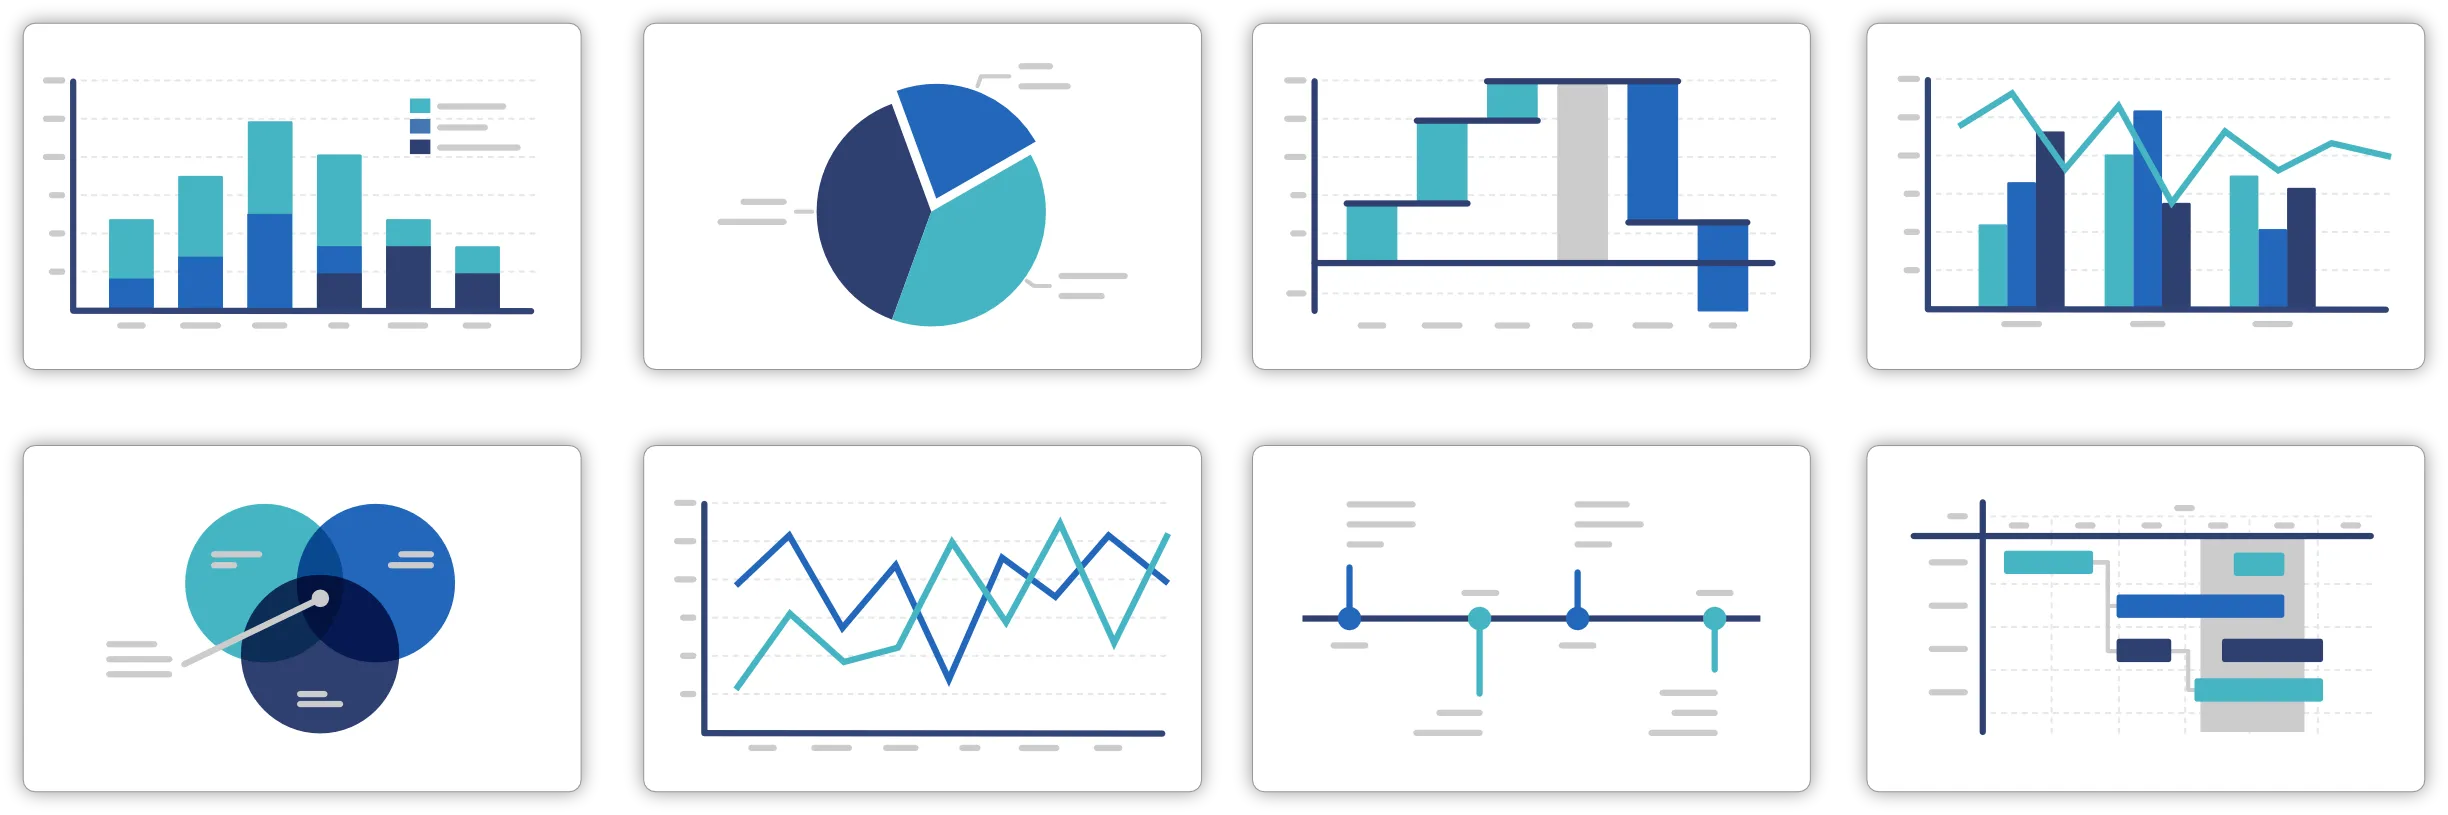
120+ professional chart types
Go beyond basic charts with waterfalls, Gantts, timelines, and more.
Refine when needed
Ask ChatGPT to adjust your chart without manually rebuilding it.
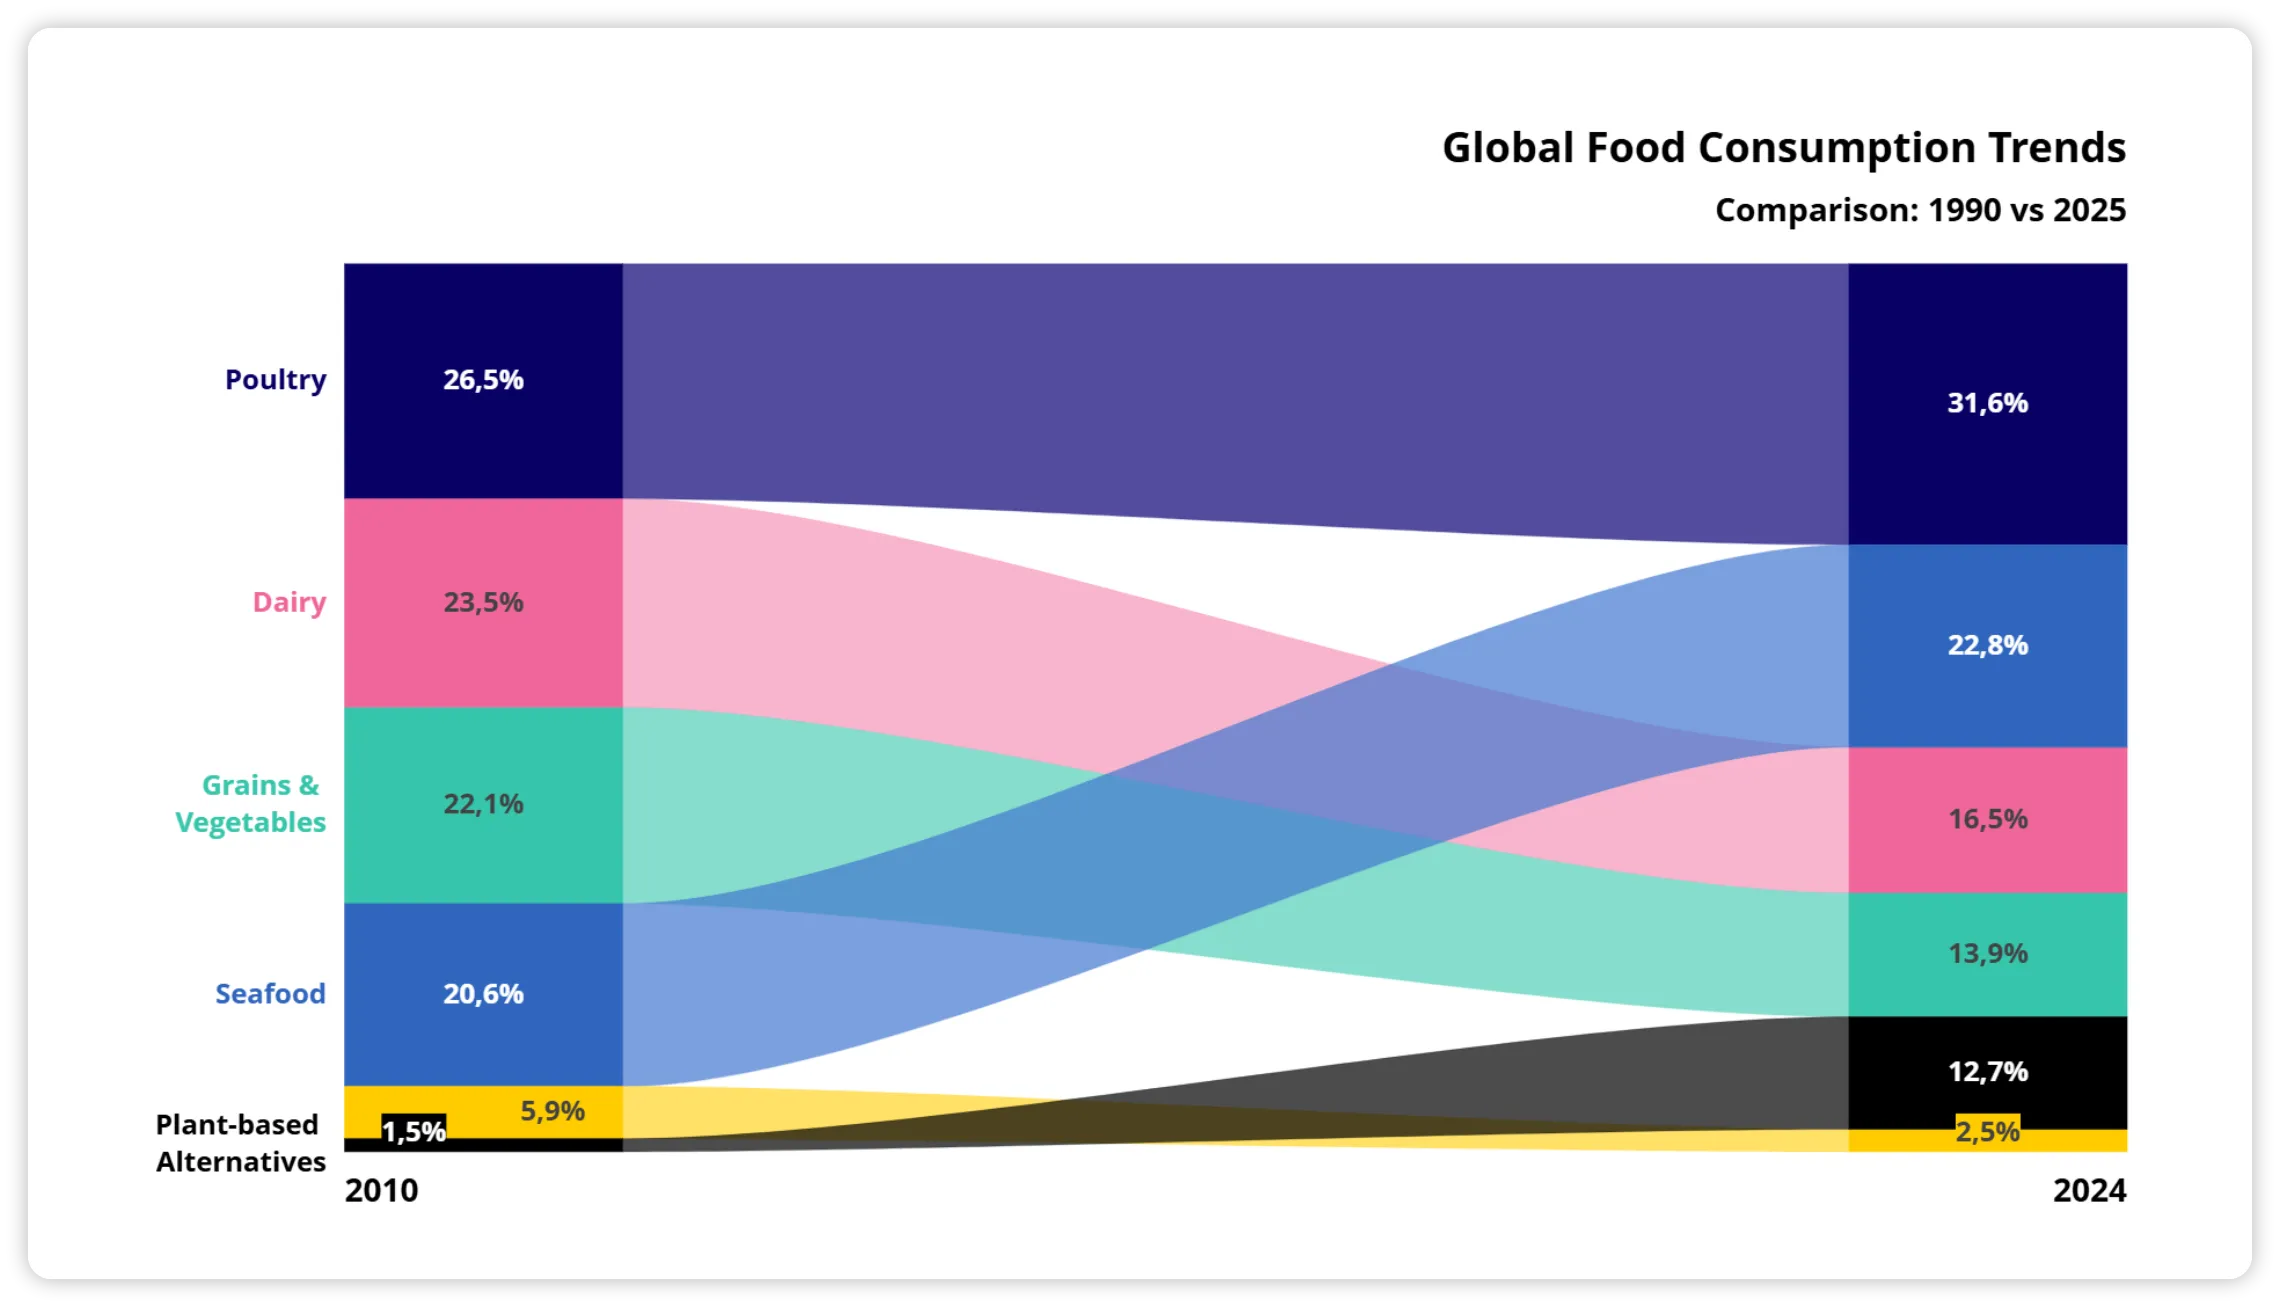
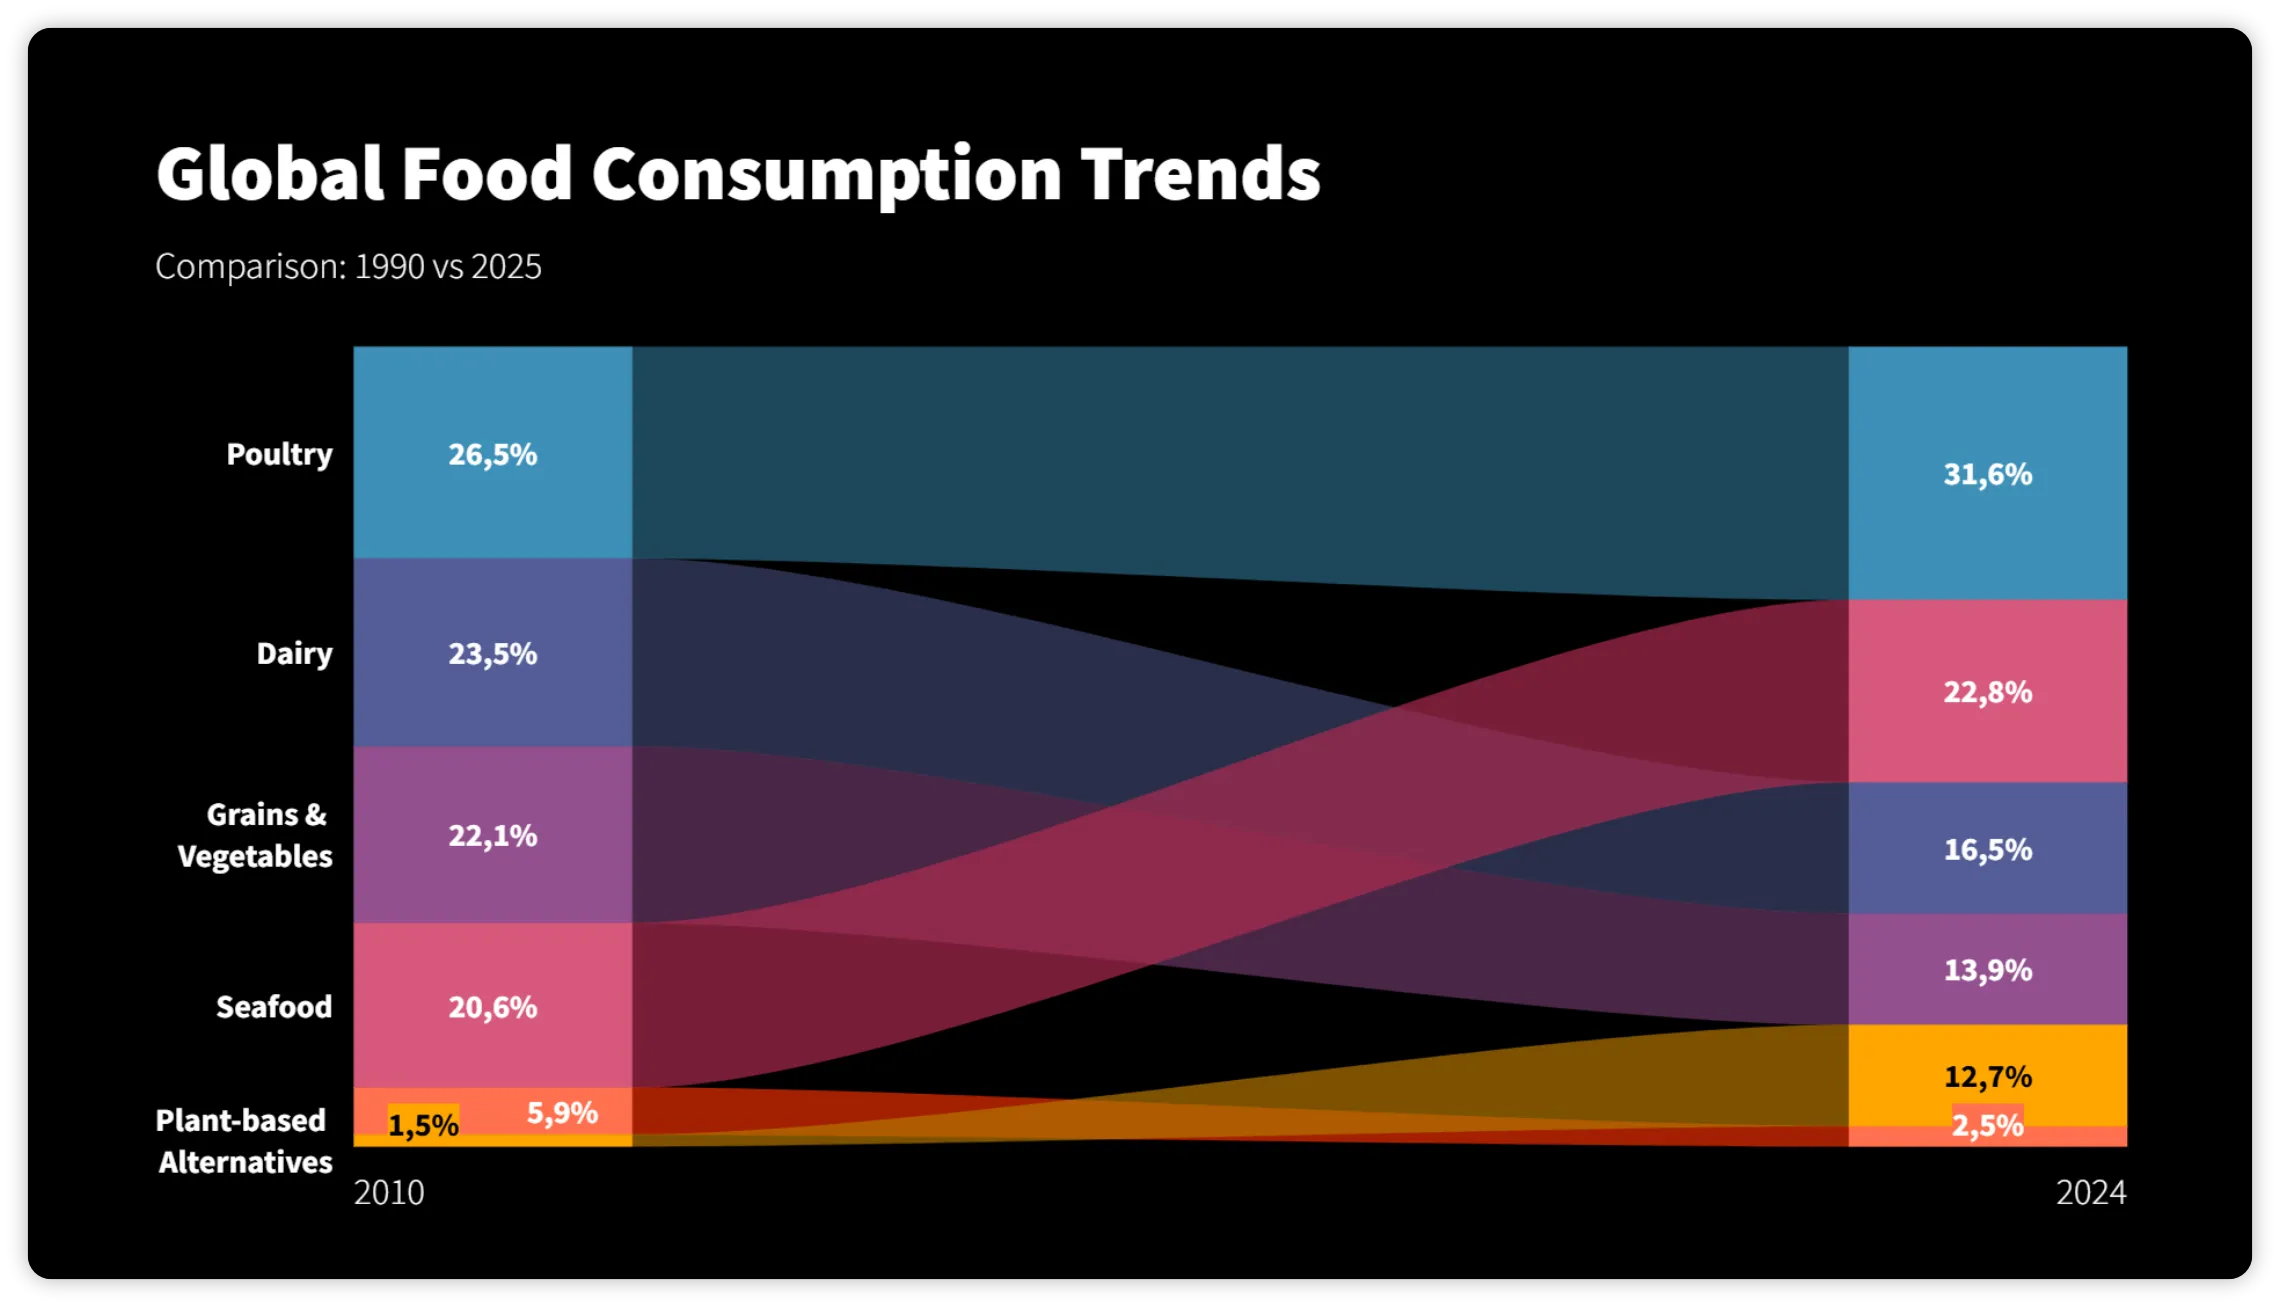
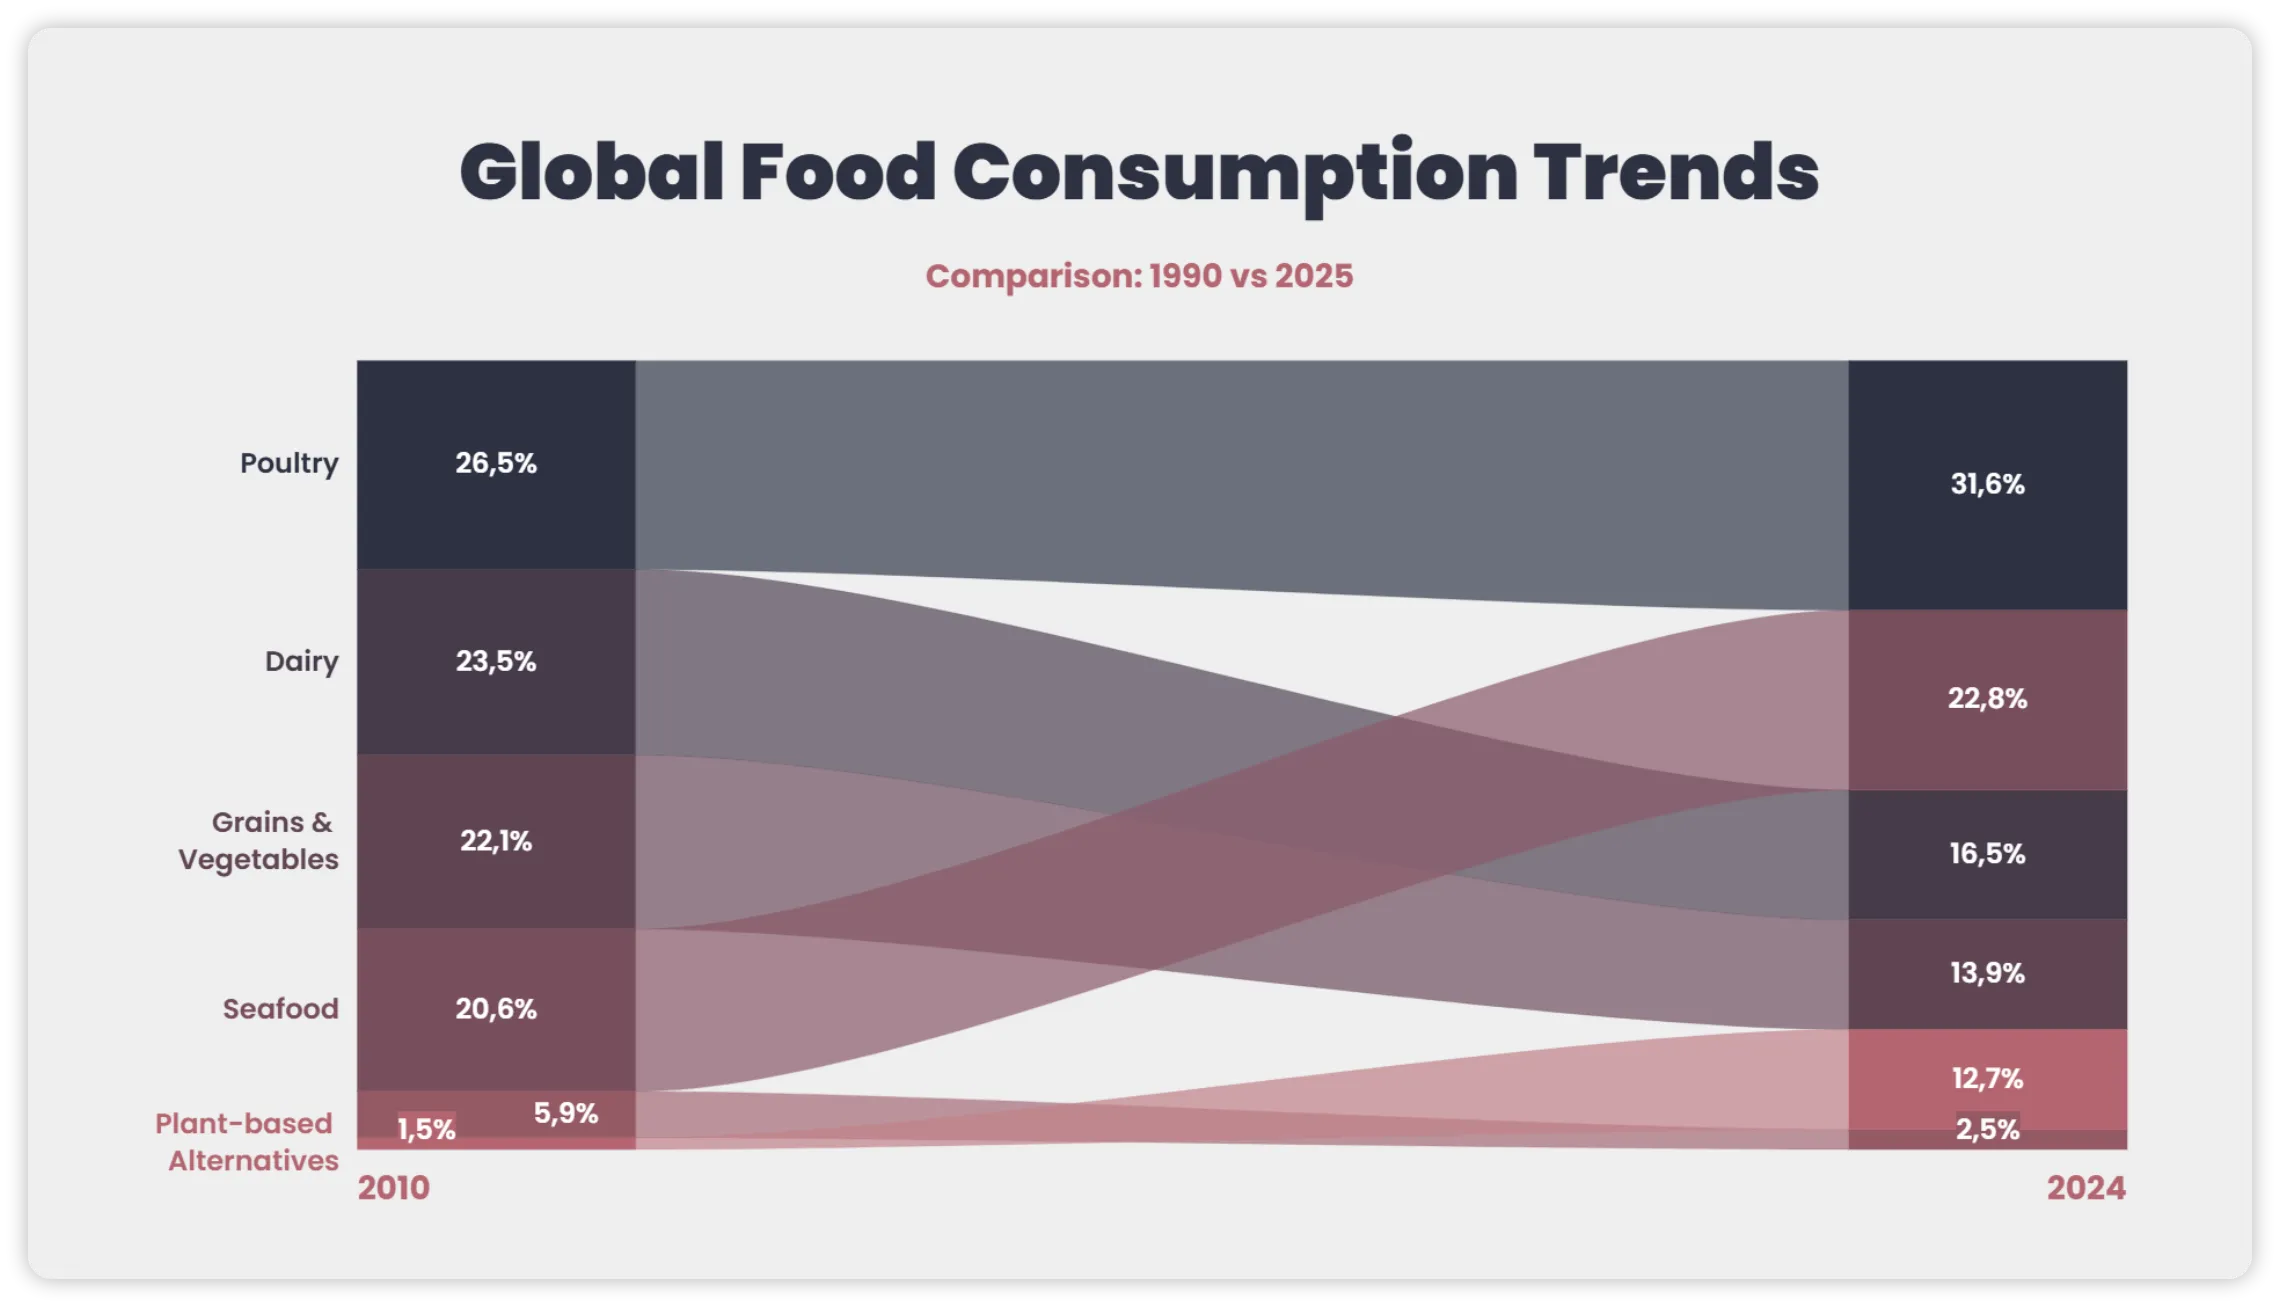
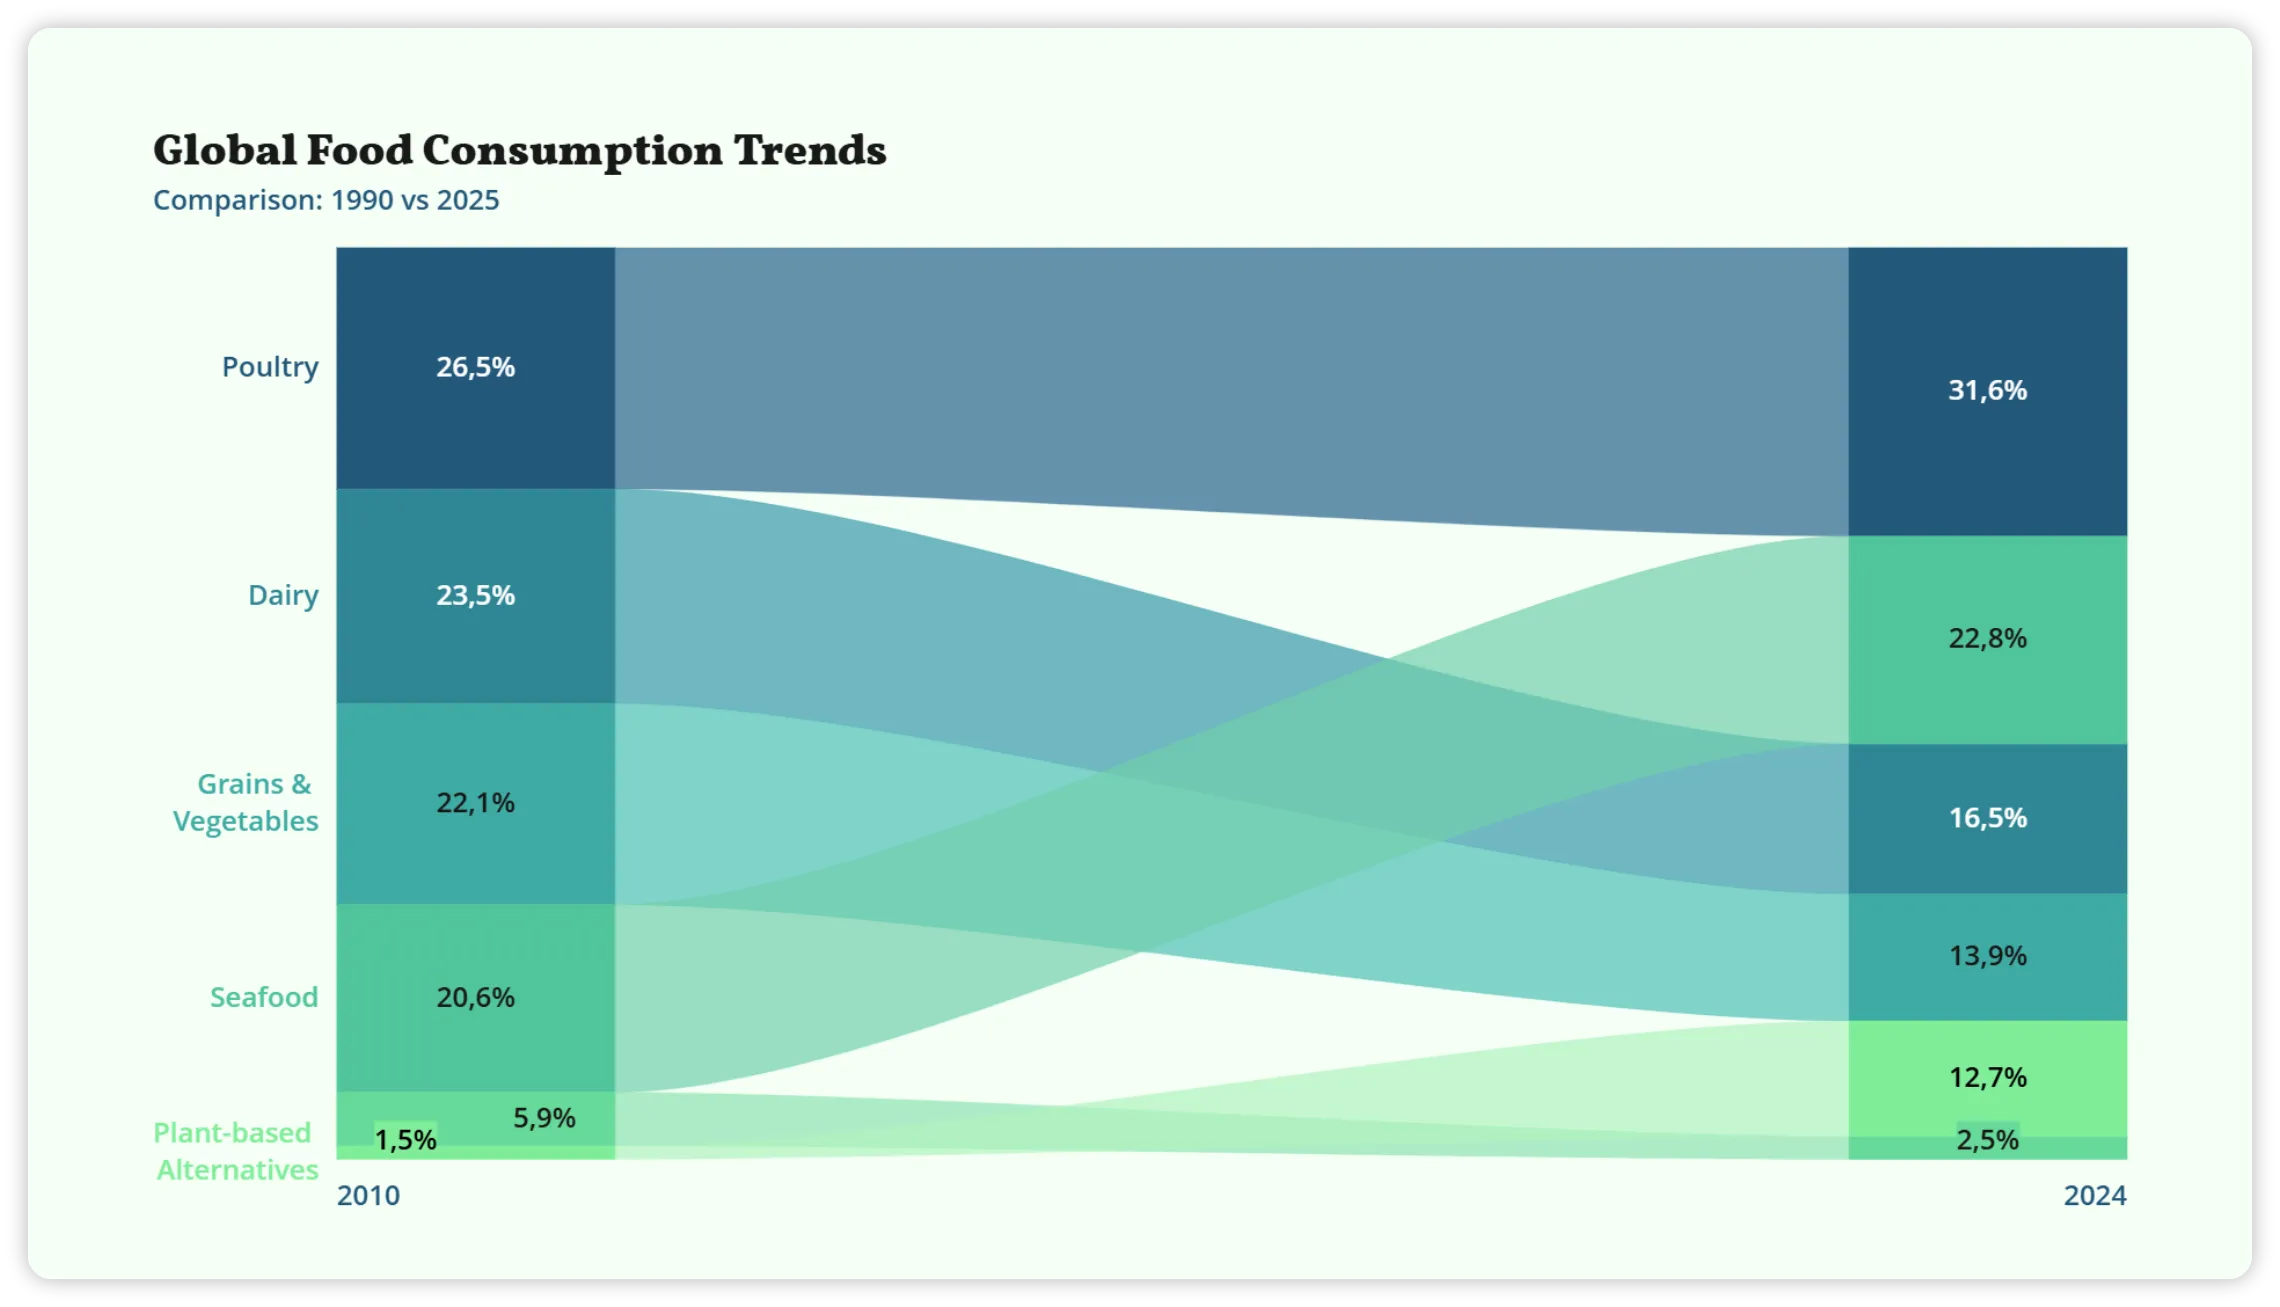
Stay on brand
Open your chart in Vizzlo to customize its data, labels, colors, and styling.
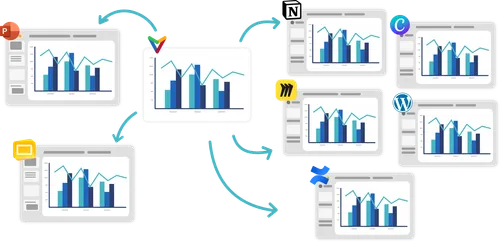
Create in ChatGPT. Use your charts anywhere.
Take charts created with ChatGPT and Vizzlo into presentations, reports, documents, and dashboards — without recreating them from scratch.
Explore Vizzlo-
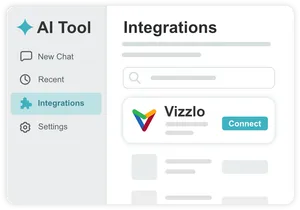 Add Vizzlo to your AI Assistant
-
 Connect your Vizzlo Account
Connect Vizzlo to ChatGPT in just a few steps
Add Vizzlo to ChatGPT, connect your account, and you're ready to create charts.
Using another AI assistant?
-
 Claude
Connect to Claude
-
 Gemini
Connect to Gemini
-
 Microsoft Copilot
Connect to Copilot
-
 Perplexity
Connect to Perplexity
-
 Any MCP-compatible AI
Use Vizzlo via MCP
Setup only takes a few steps