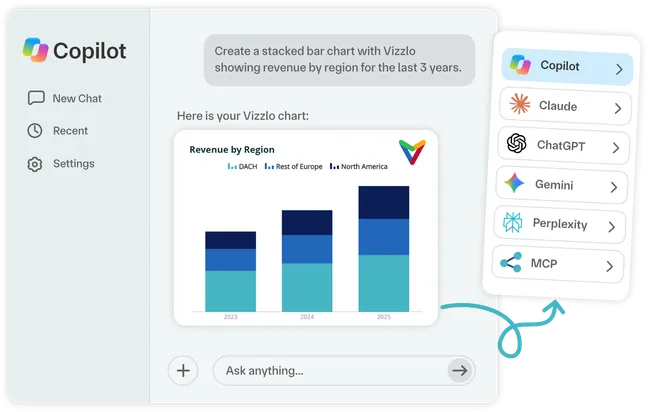
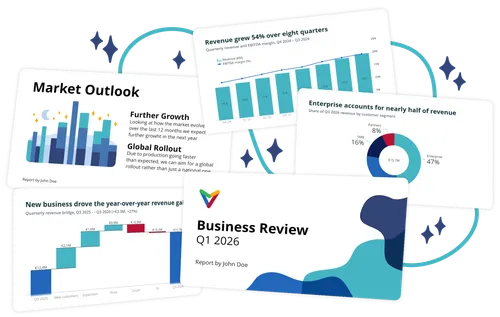
Build presentations with Copilot. Vizzlo powers the charts.
Use Copilot to prepare reports and business insights, while Vizzlo turns your data into professional charts for presentations and business reviews.
From business data to charts, right inside Copilot
Describe what you need, provide your data, and let Copilot work with Vizzlo to create professional visualizations. Refine your charts through natural language or open them in Vizzlo for more control.
-
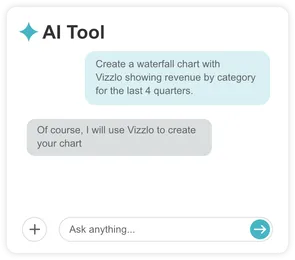
Describe what you want
-
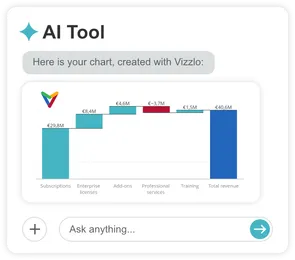
Get a professional chart
-
Refine it your way
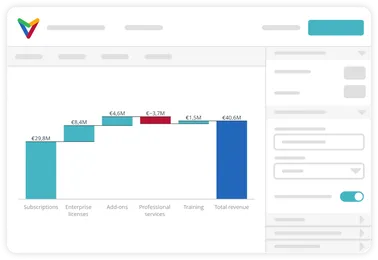
Make your business data easier to communicate
Working with spreadsheets, performance metrics, or project plans? Use Vizzlo to turn information from your Copilot workflow into clear, professional charts — without spending hours on manual formatting.
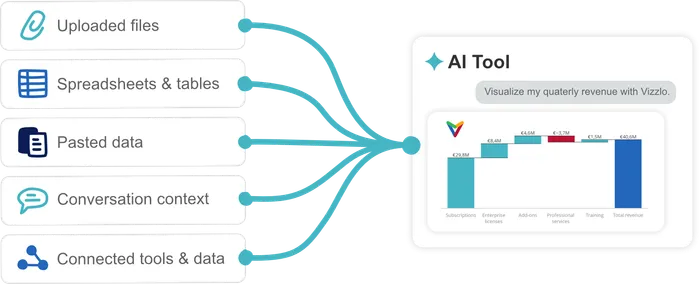
Spend less time formatting. More time communicating.
Turn business information into polished, presentation-ready charts with Vizzlo.
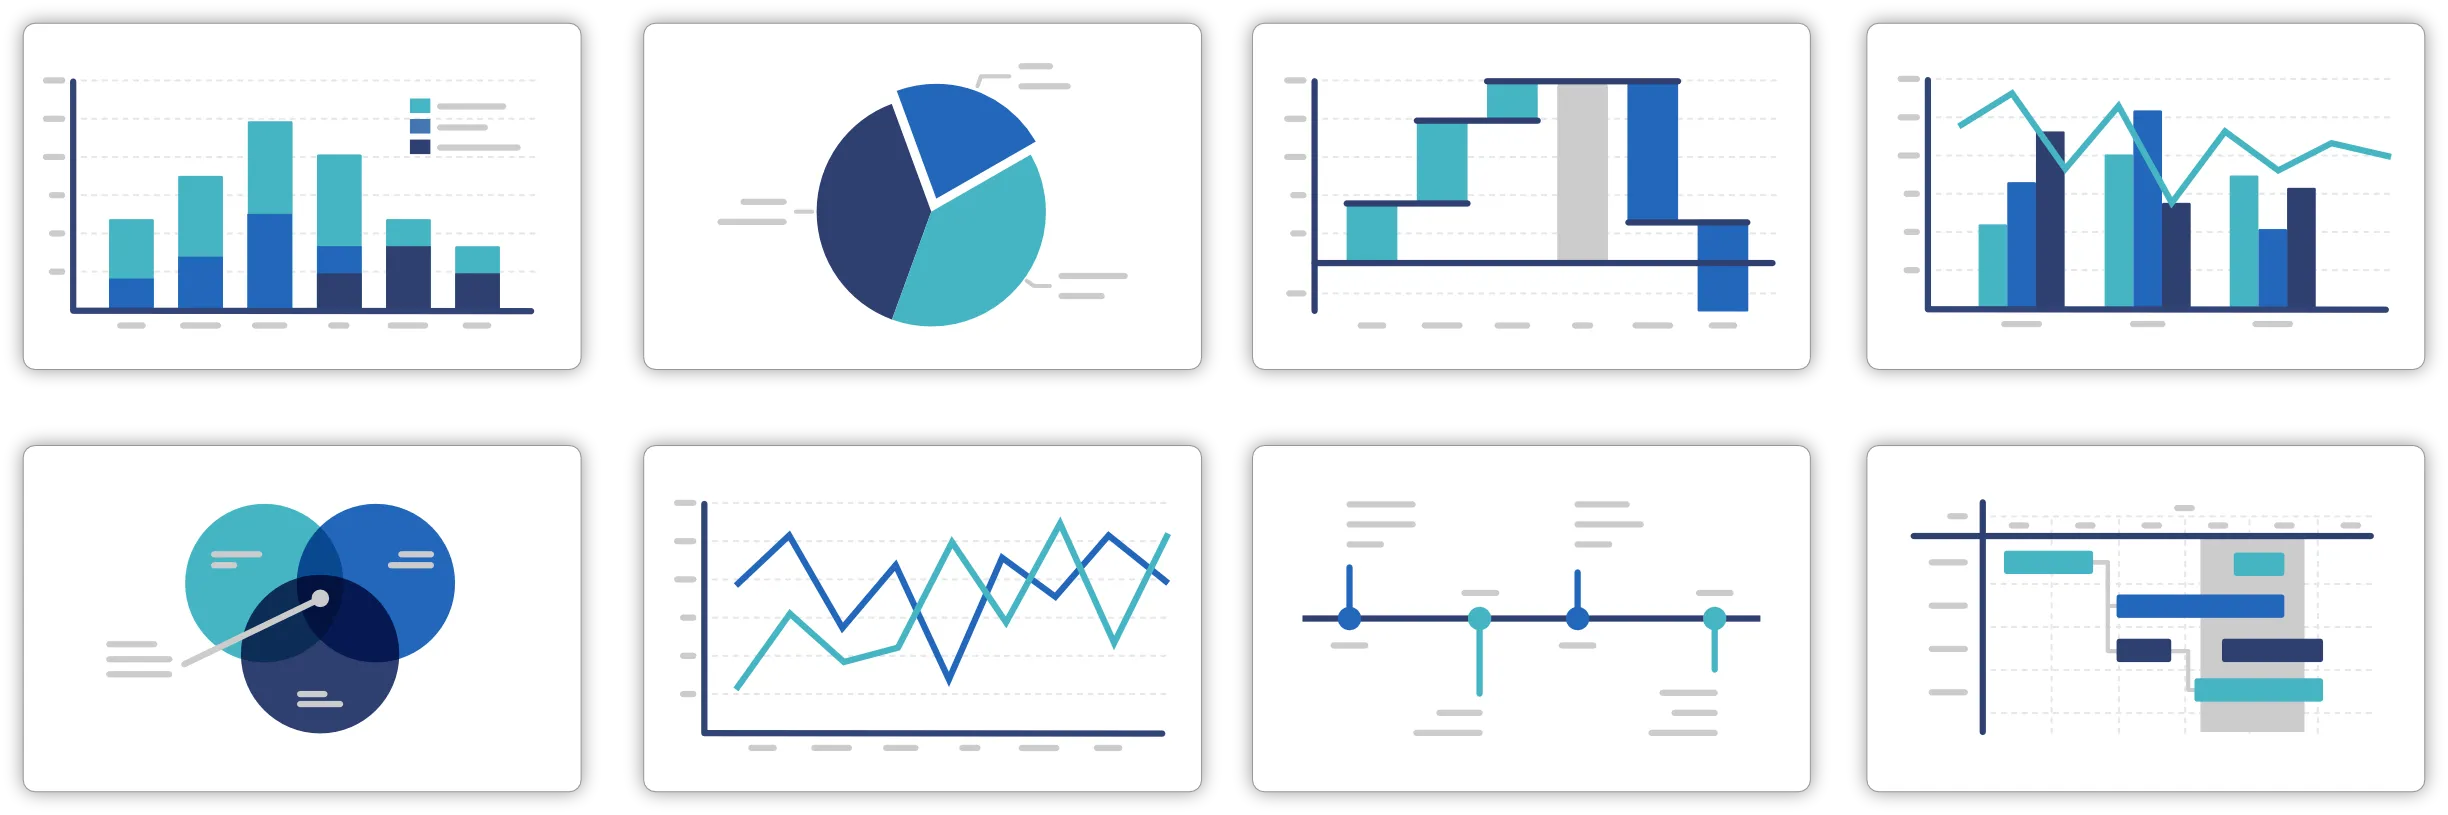
120+ professional chart types
Go beyond basic charts with waterfalls, Gantts, timelines, and more.

Refine when needed
Ask Copilot to adjust your chart without manually rebuilding it.
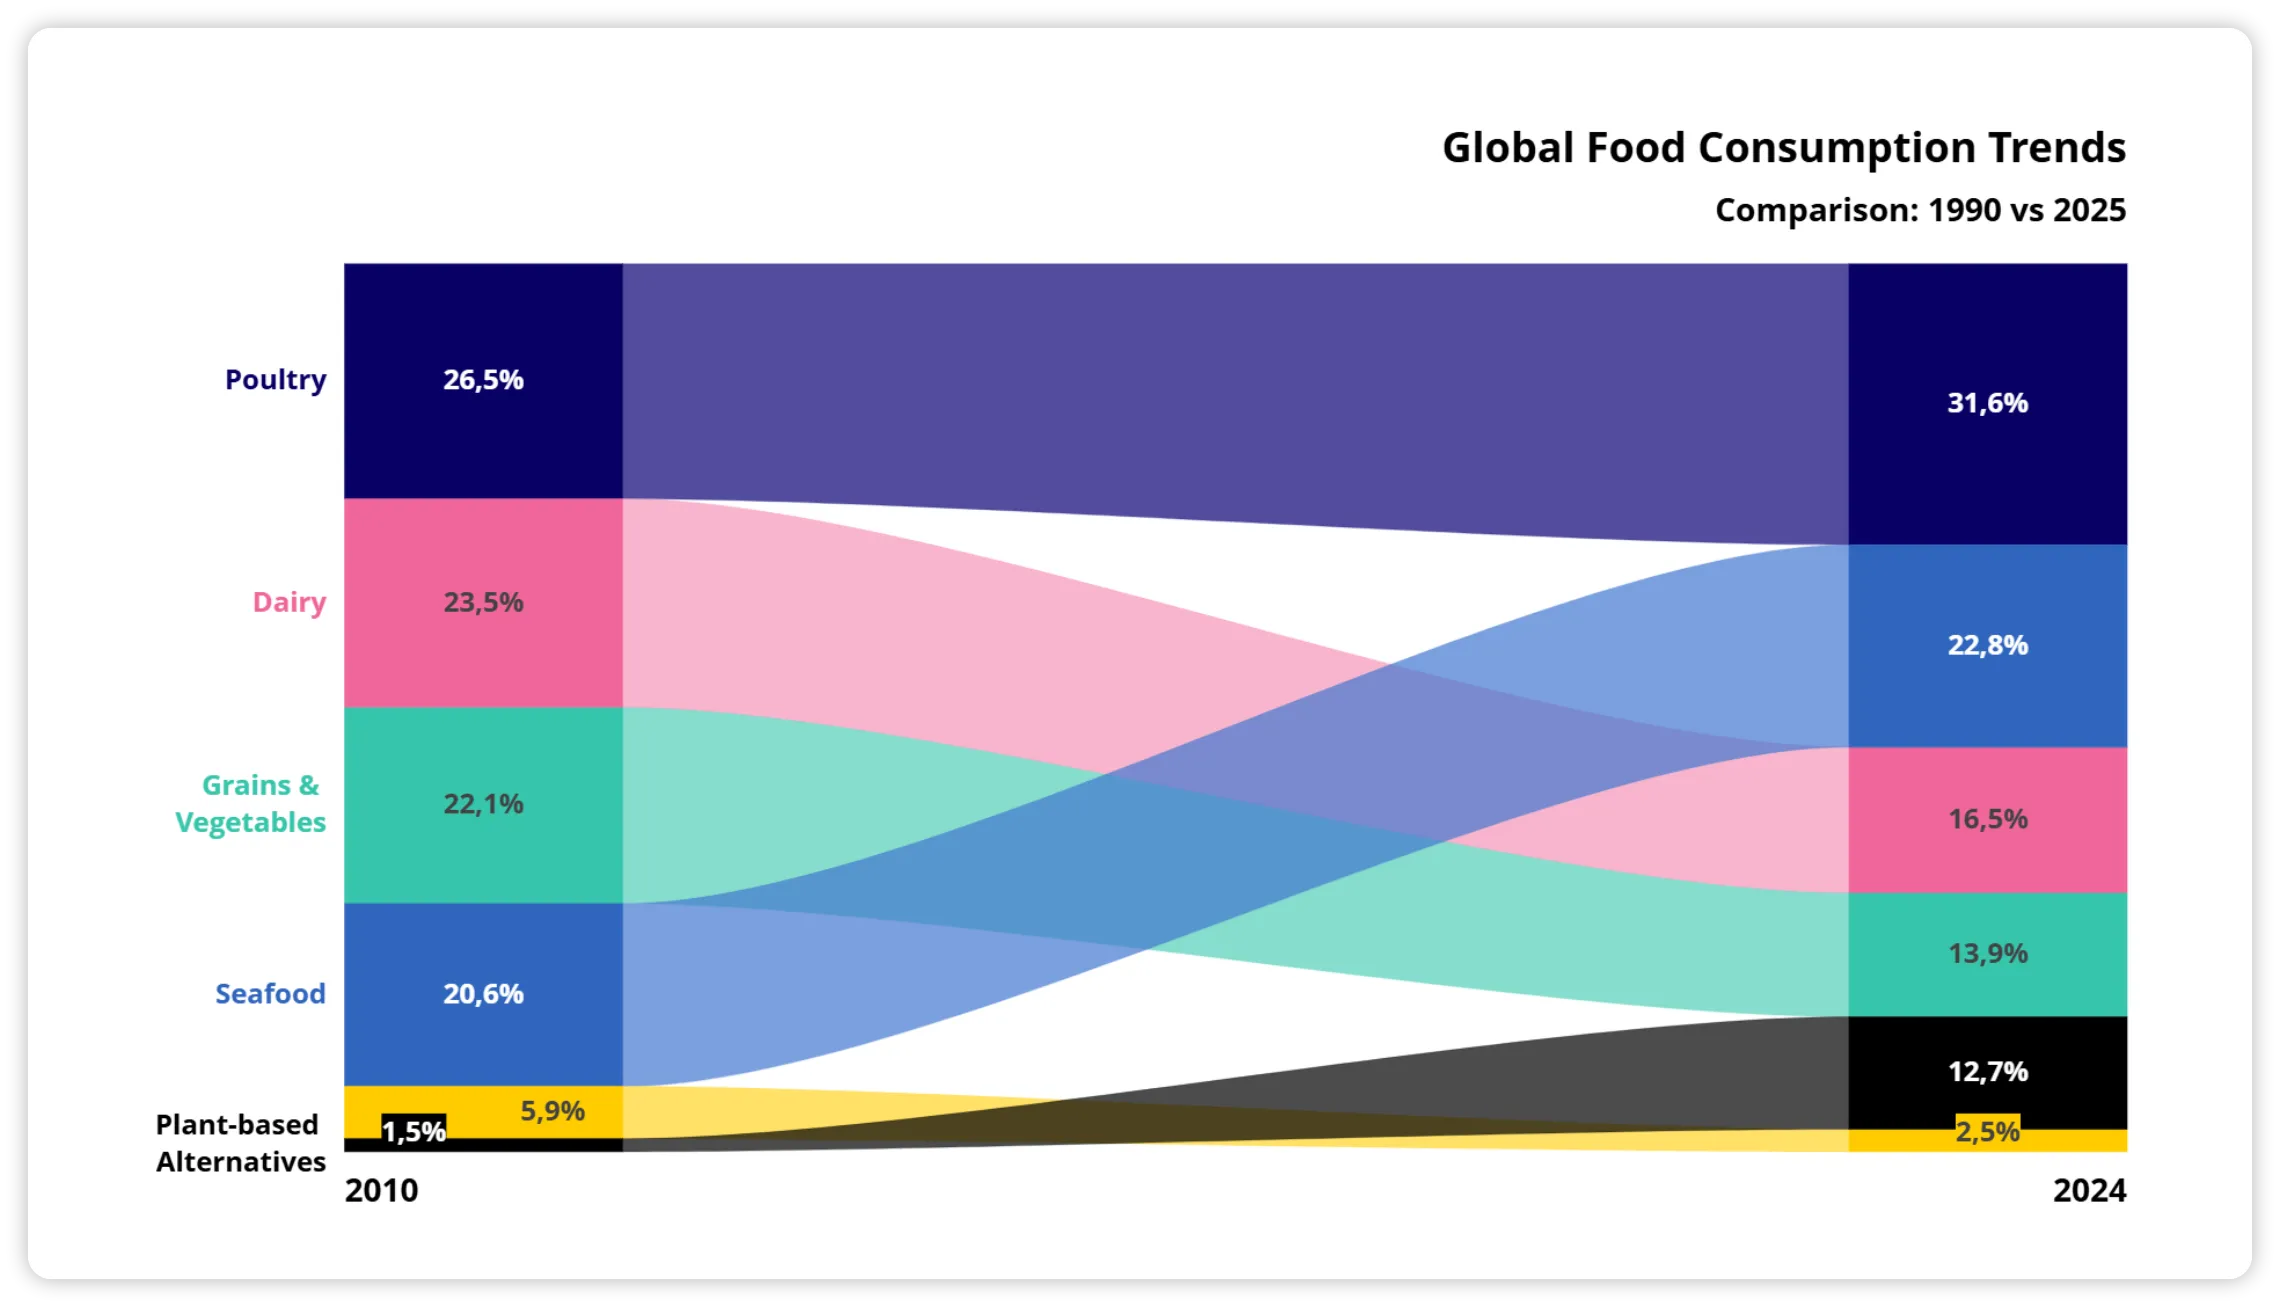
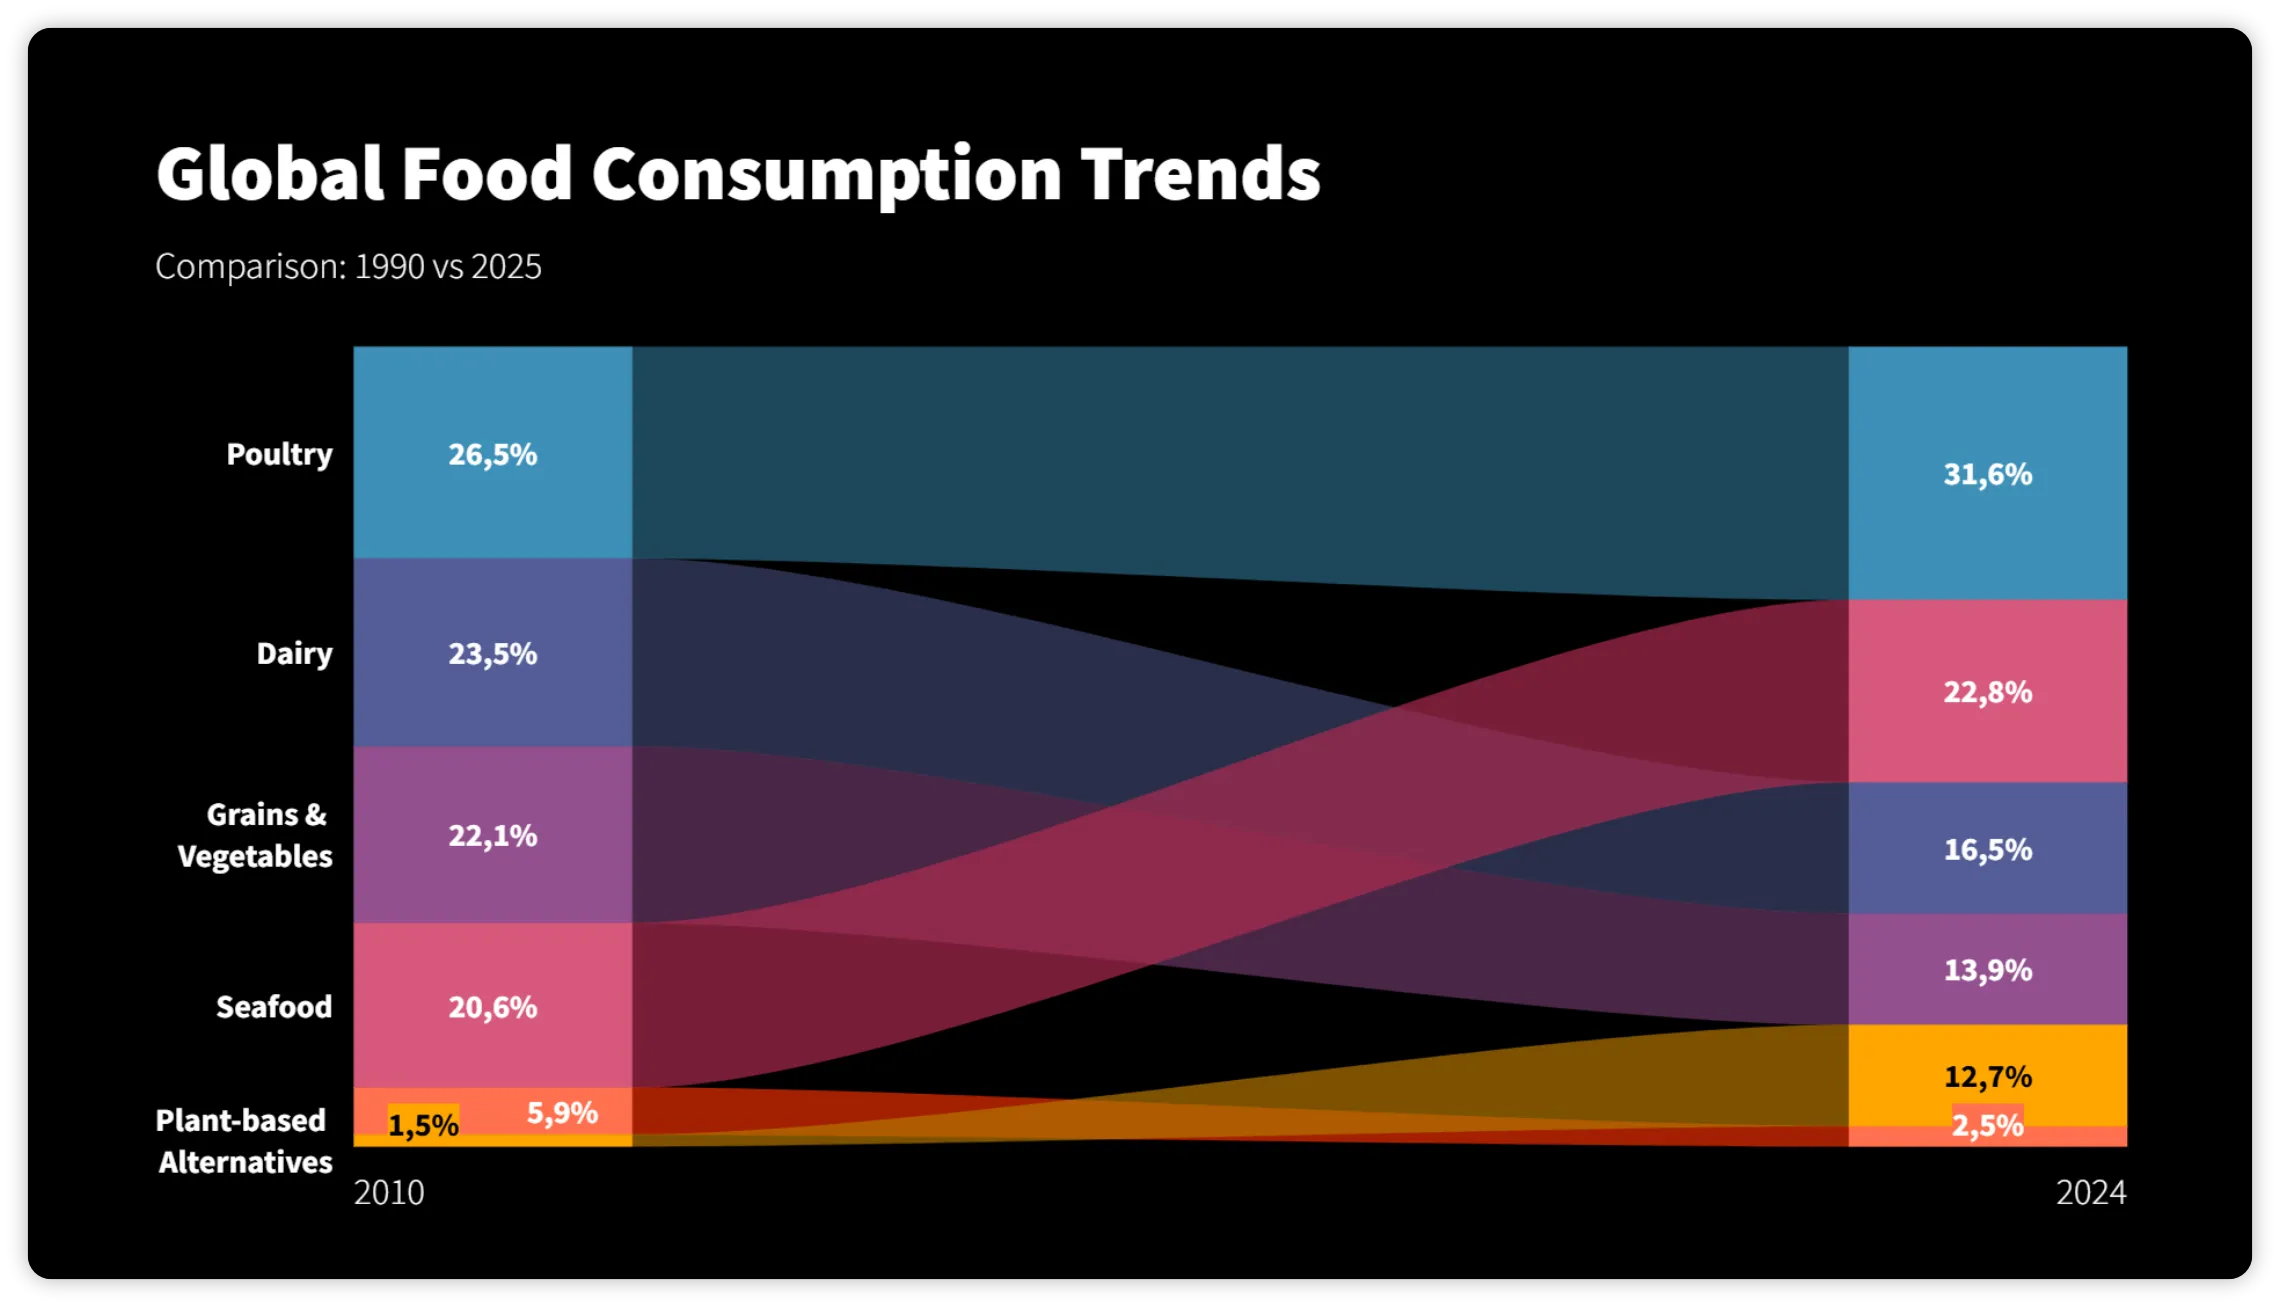
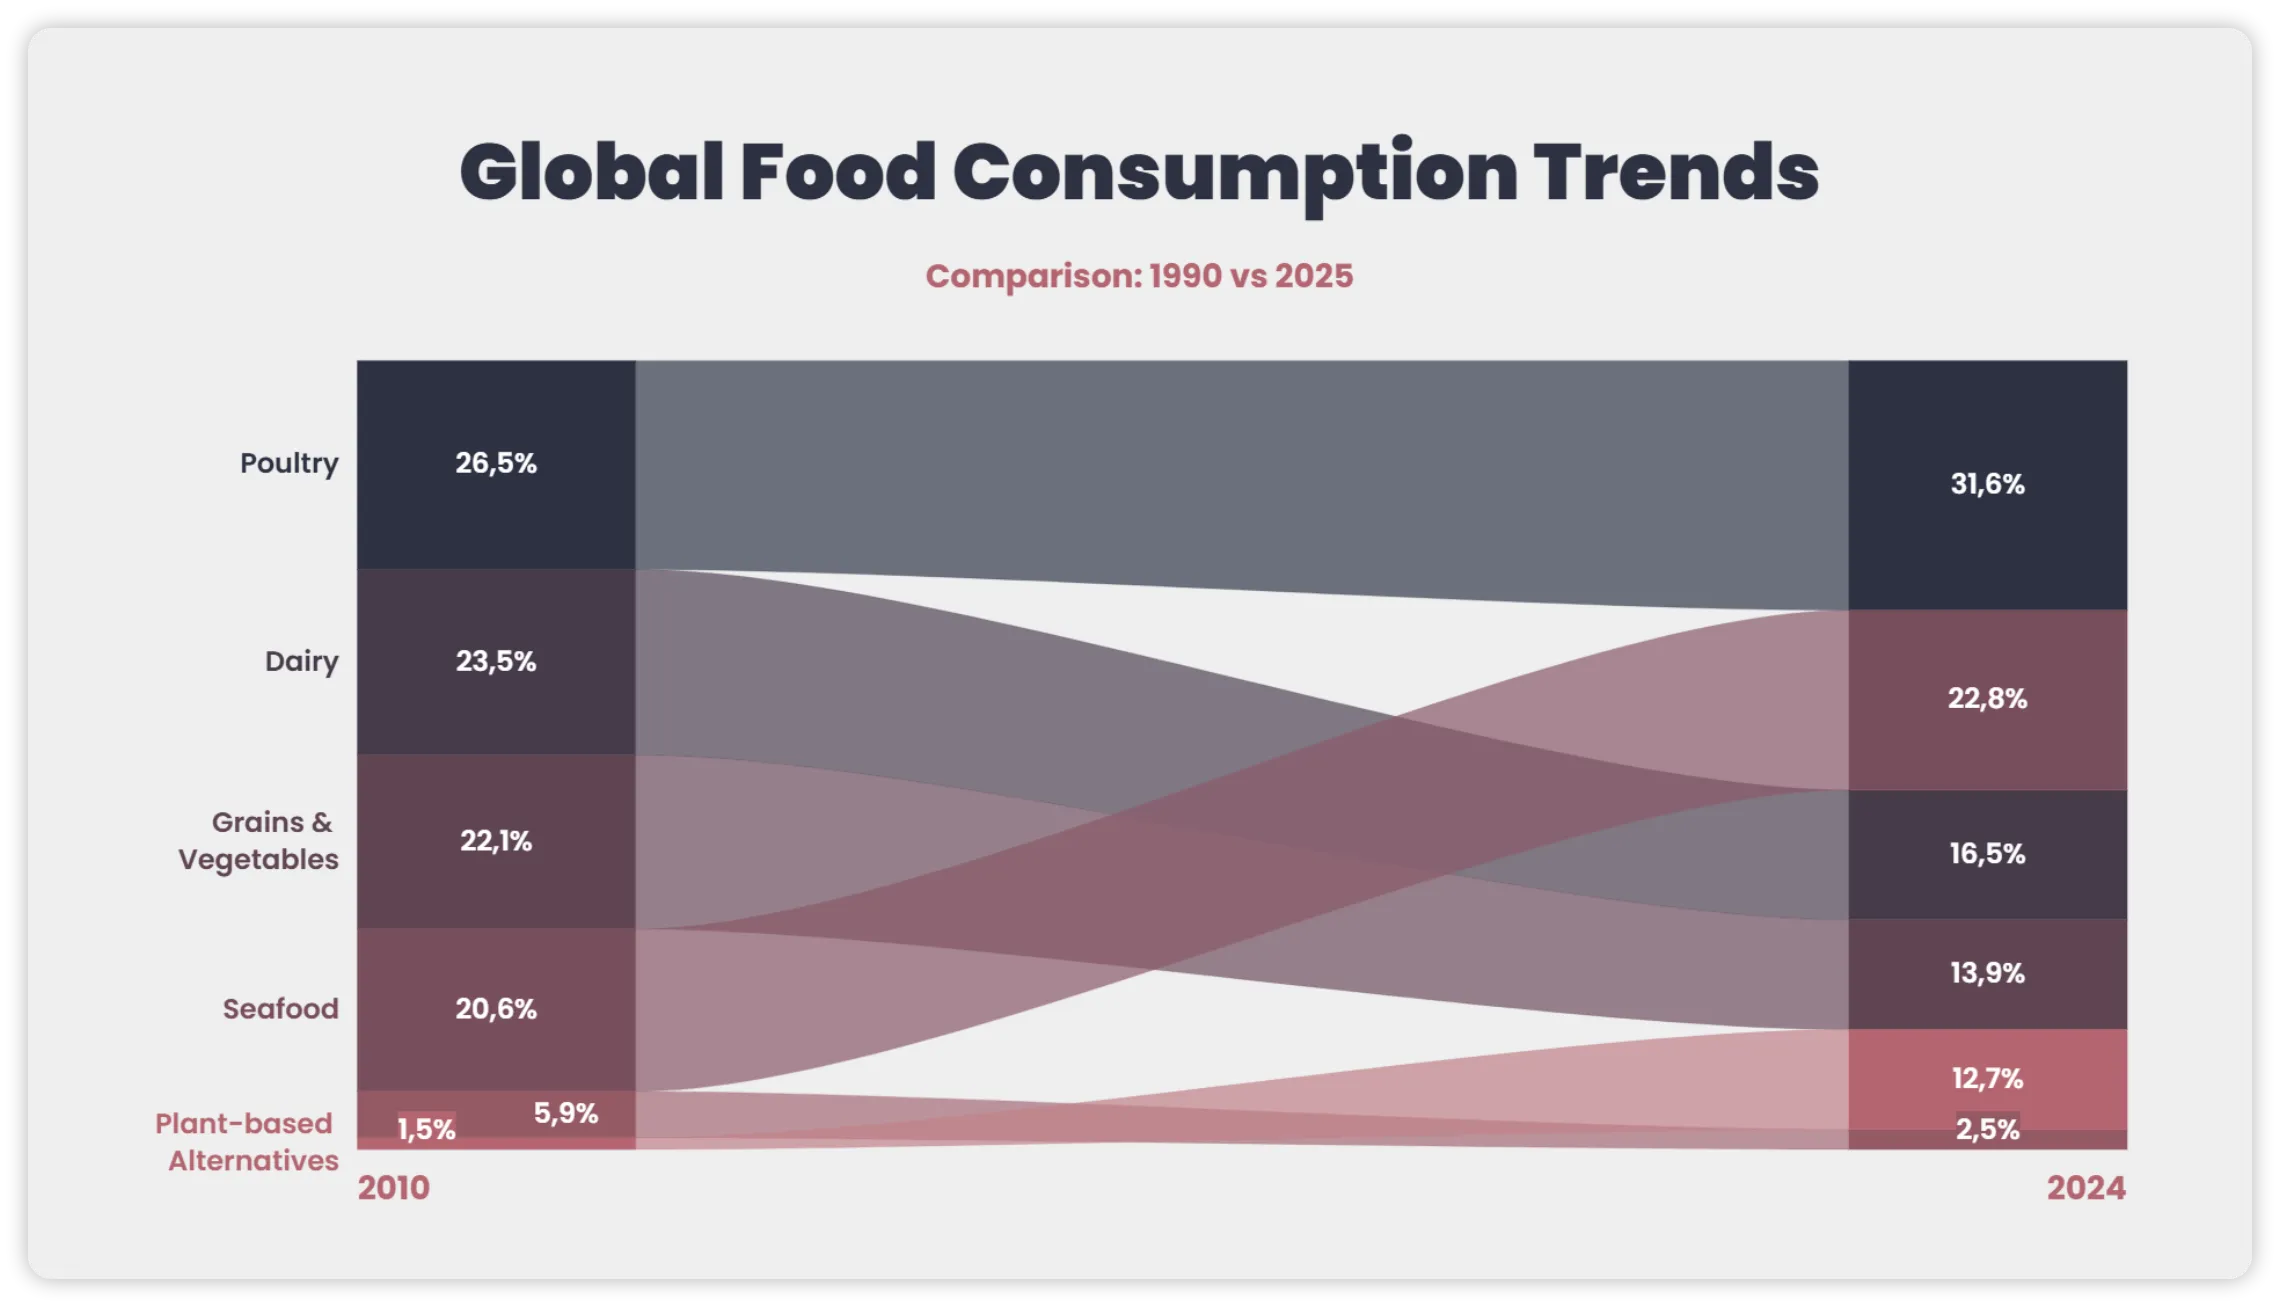
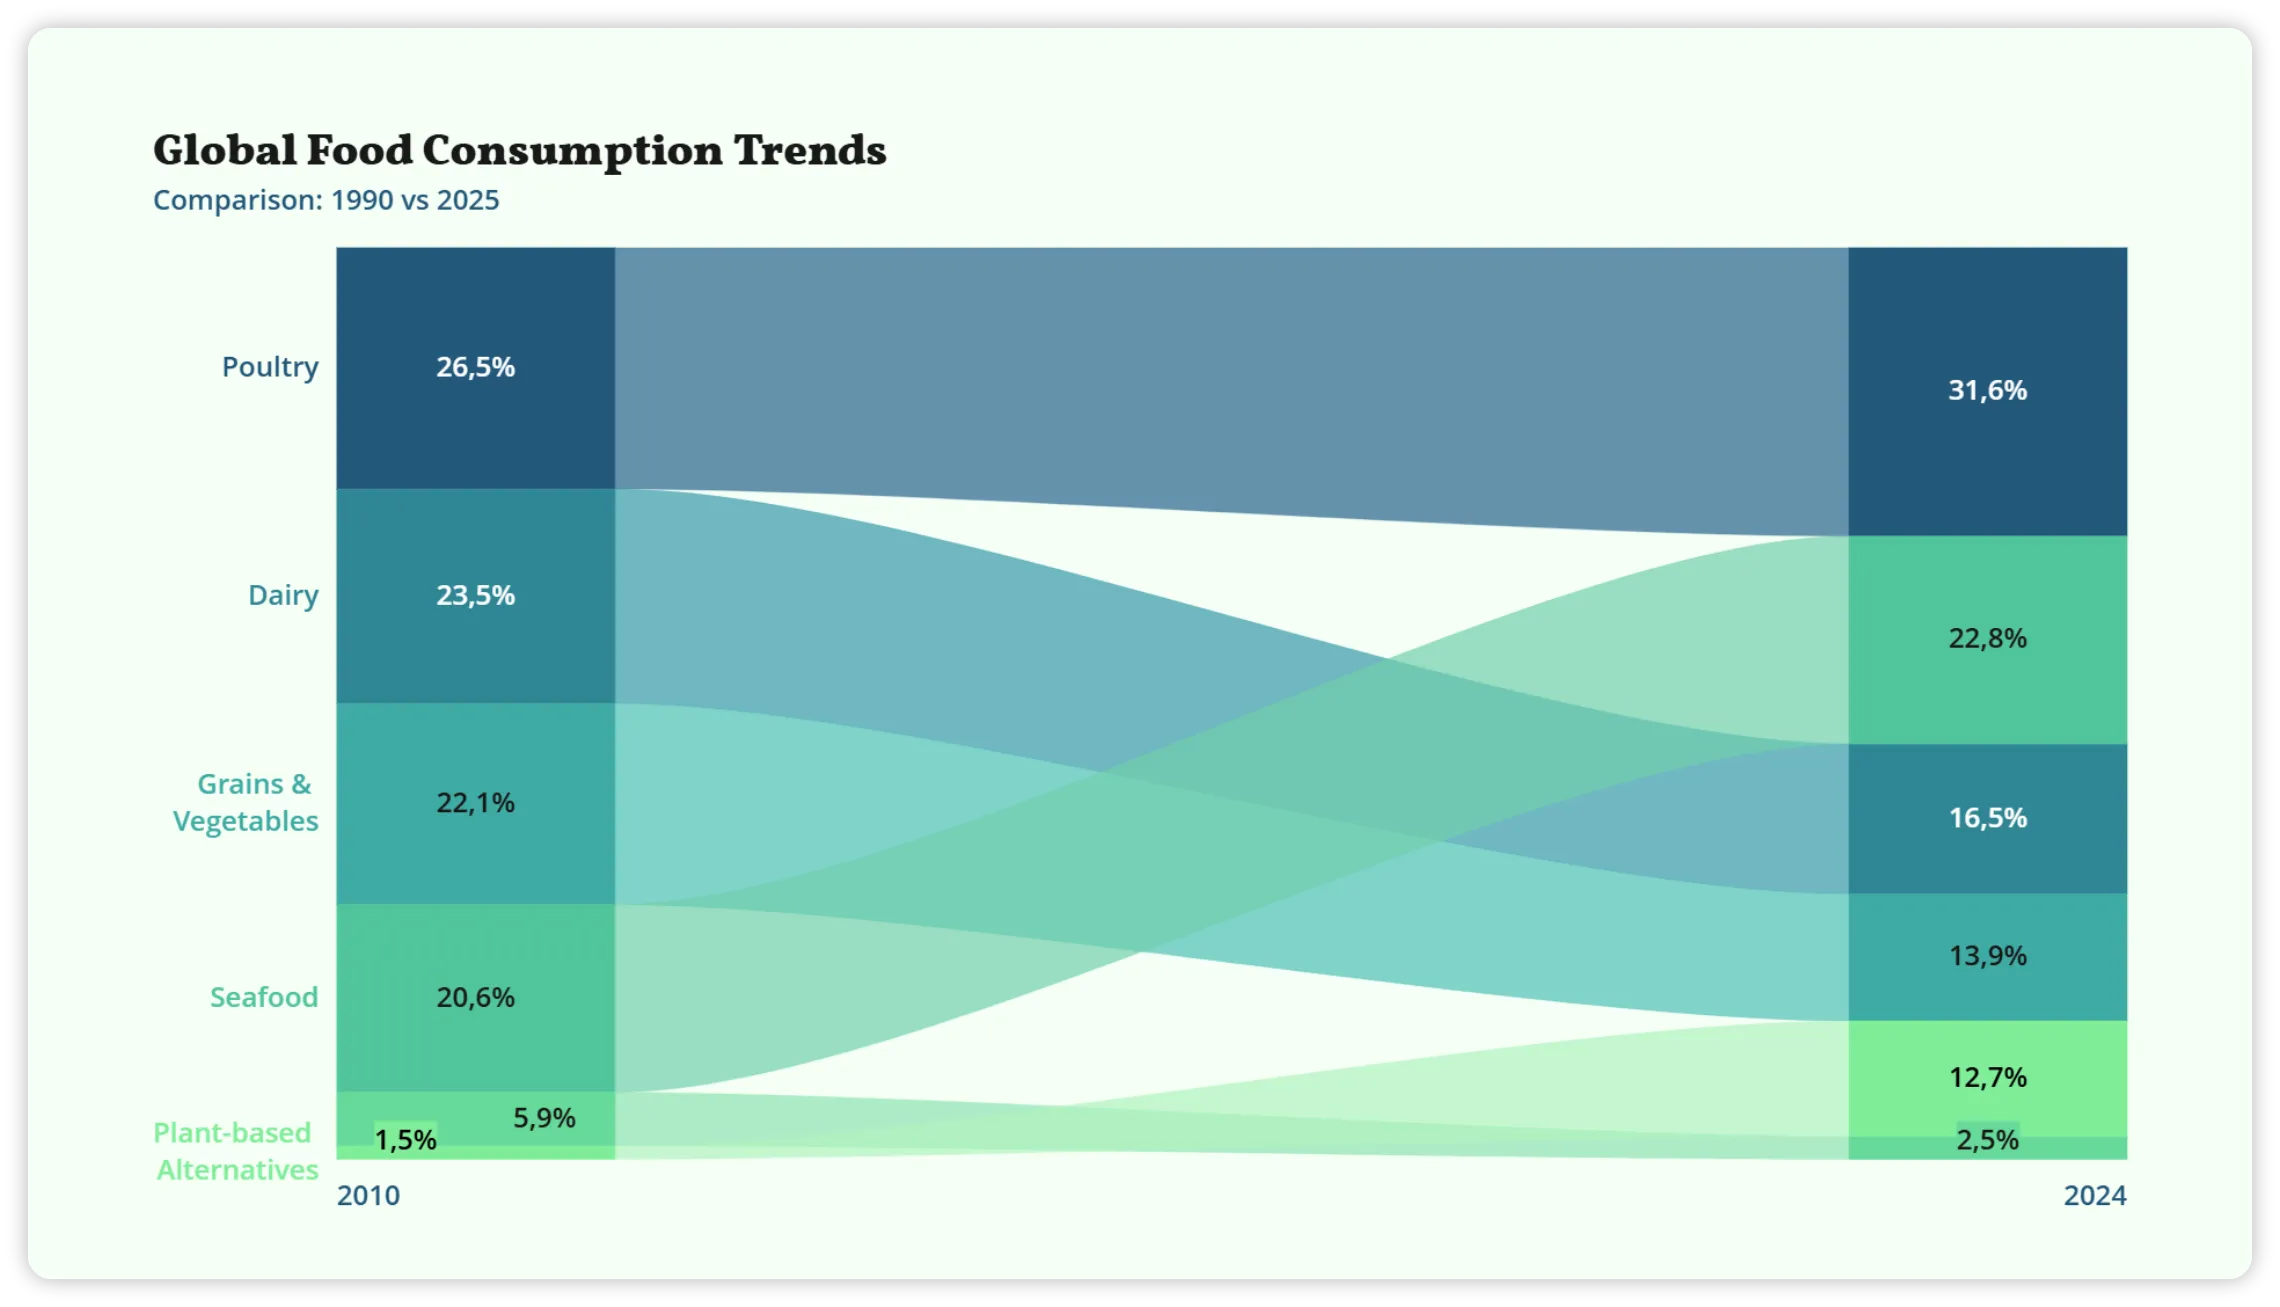
Stay on brand
Open your chart in Vizzlo to customize its data, labels, colors, and styling.
One chart. Multiple business workflows.
Create charts with Copilot and Vizzlo, then reuse them across presentations, reports, and dashboards — fully editable and consistent with your brand.
Explore Vizzlo-
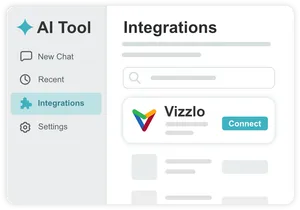 Add Vizzlo to your AI Assistant
-
 Connect your Vizzlo Account
Bring professional charting into your Copilot workflow
Connect Vizzlo to Copilot, sign in with your Vizzlo account, and start creating and refining professional charts using natural language.
Using another AI assistant?
-
 ChatGPT
Connect to ChatGPT
-
 Claude
Connect to Claude
-
 Gemini
Connect to Gemini
-
 Perplexity
Connect to Perplexity
-
 Any MCP-compatible AI
Use Vizzlo via MCP
Setup only takes a few steps