Turn data into something teams can work with
Add clear visual context to workshops, strategy boards, research, planning, and collaborative sessions.
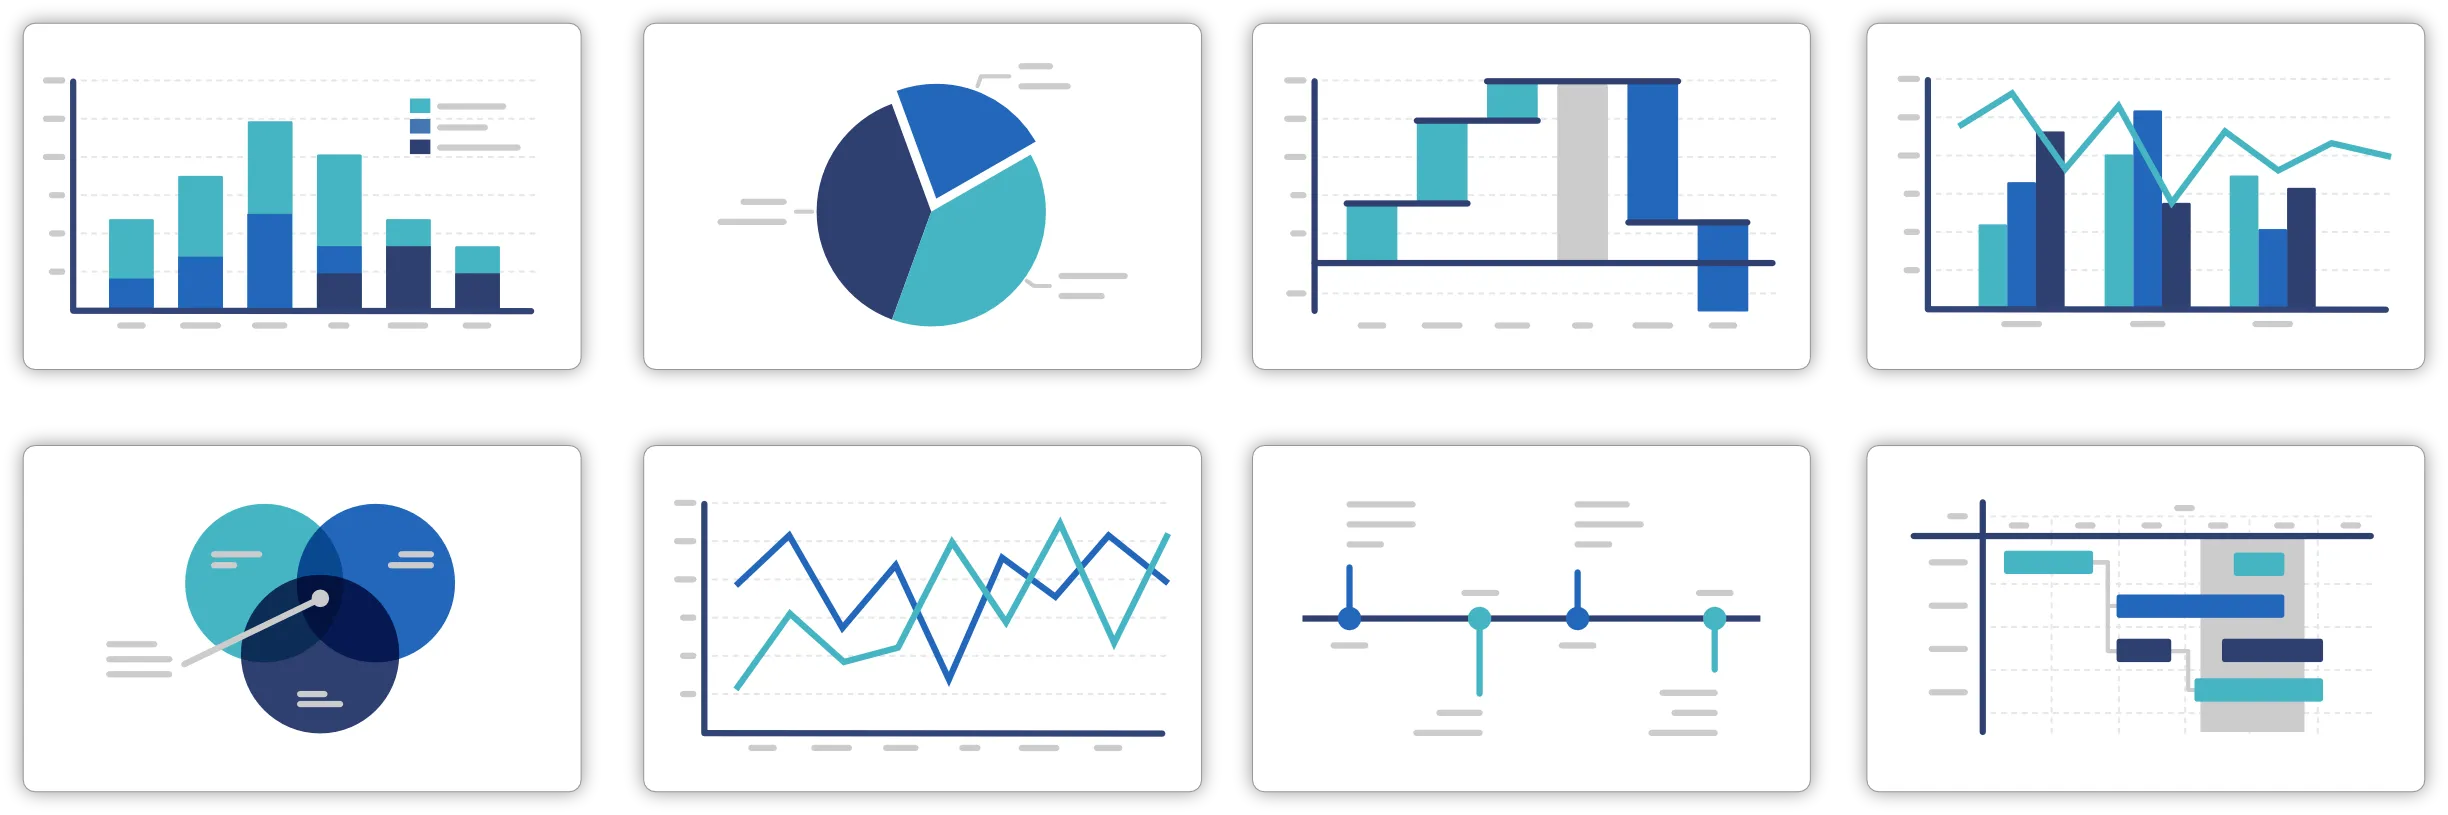
120+ professional chart types
Choose from 120+ chart types to explain trends, comparisons, flows, timelines, and more.
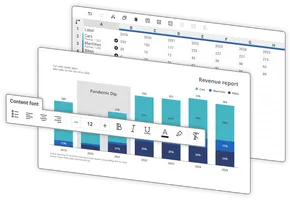
Create charts faster
Turn raw data into visuals your team can understand quickly during meetings and workshops.
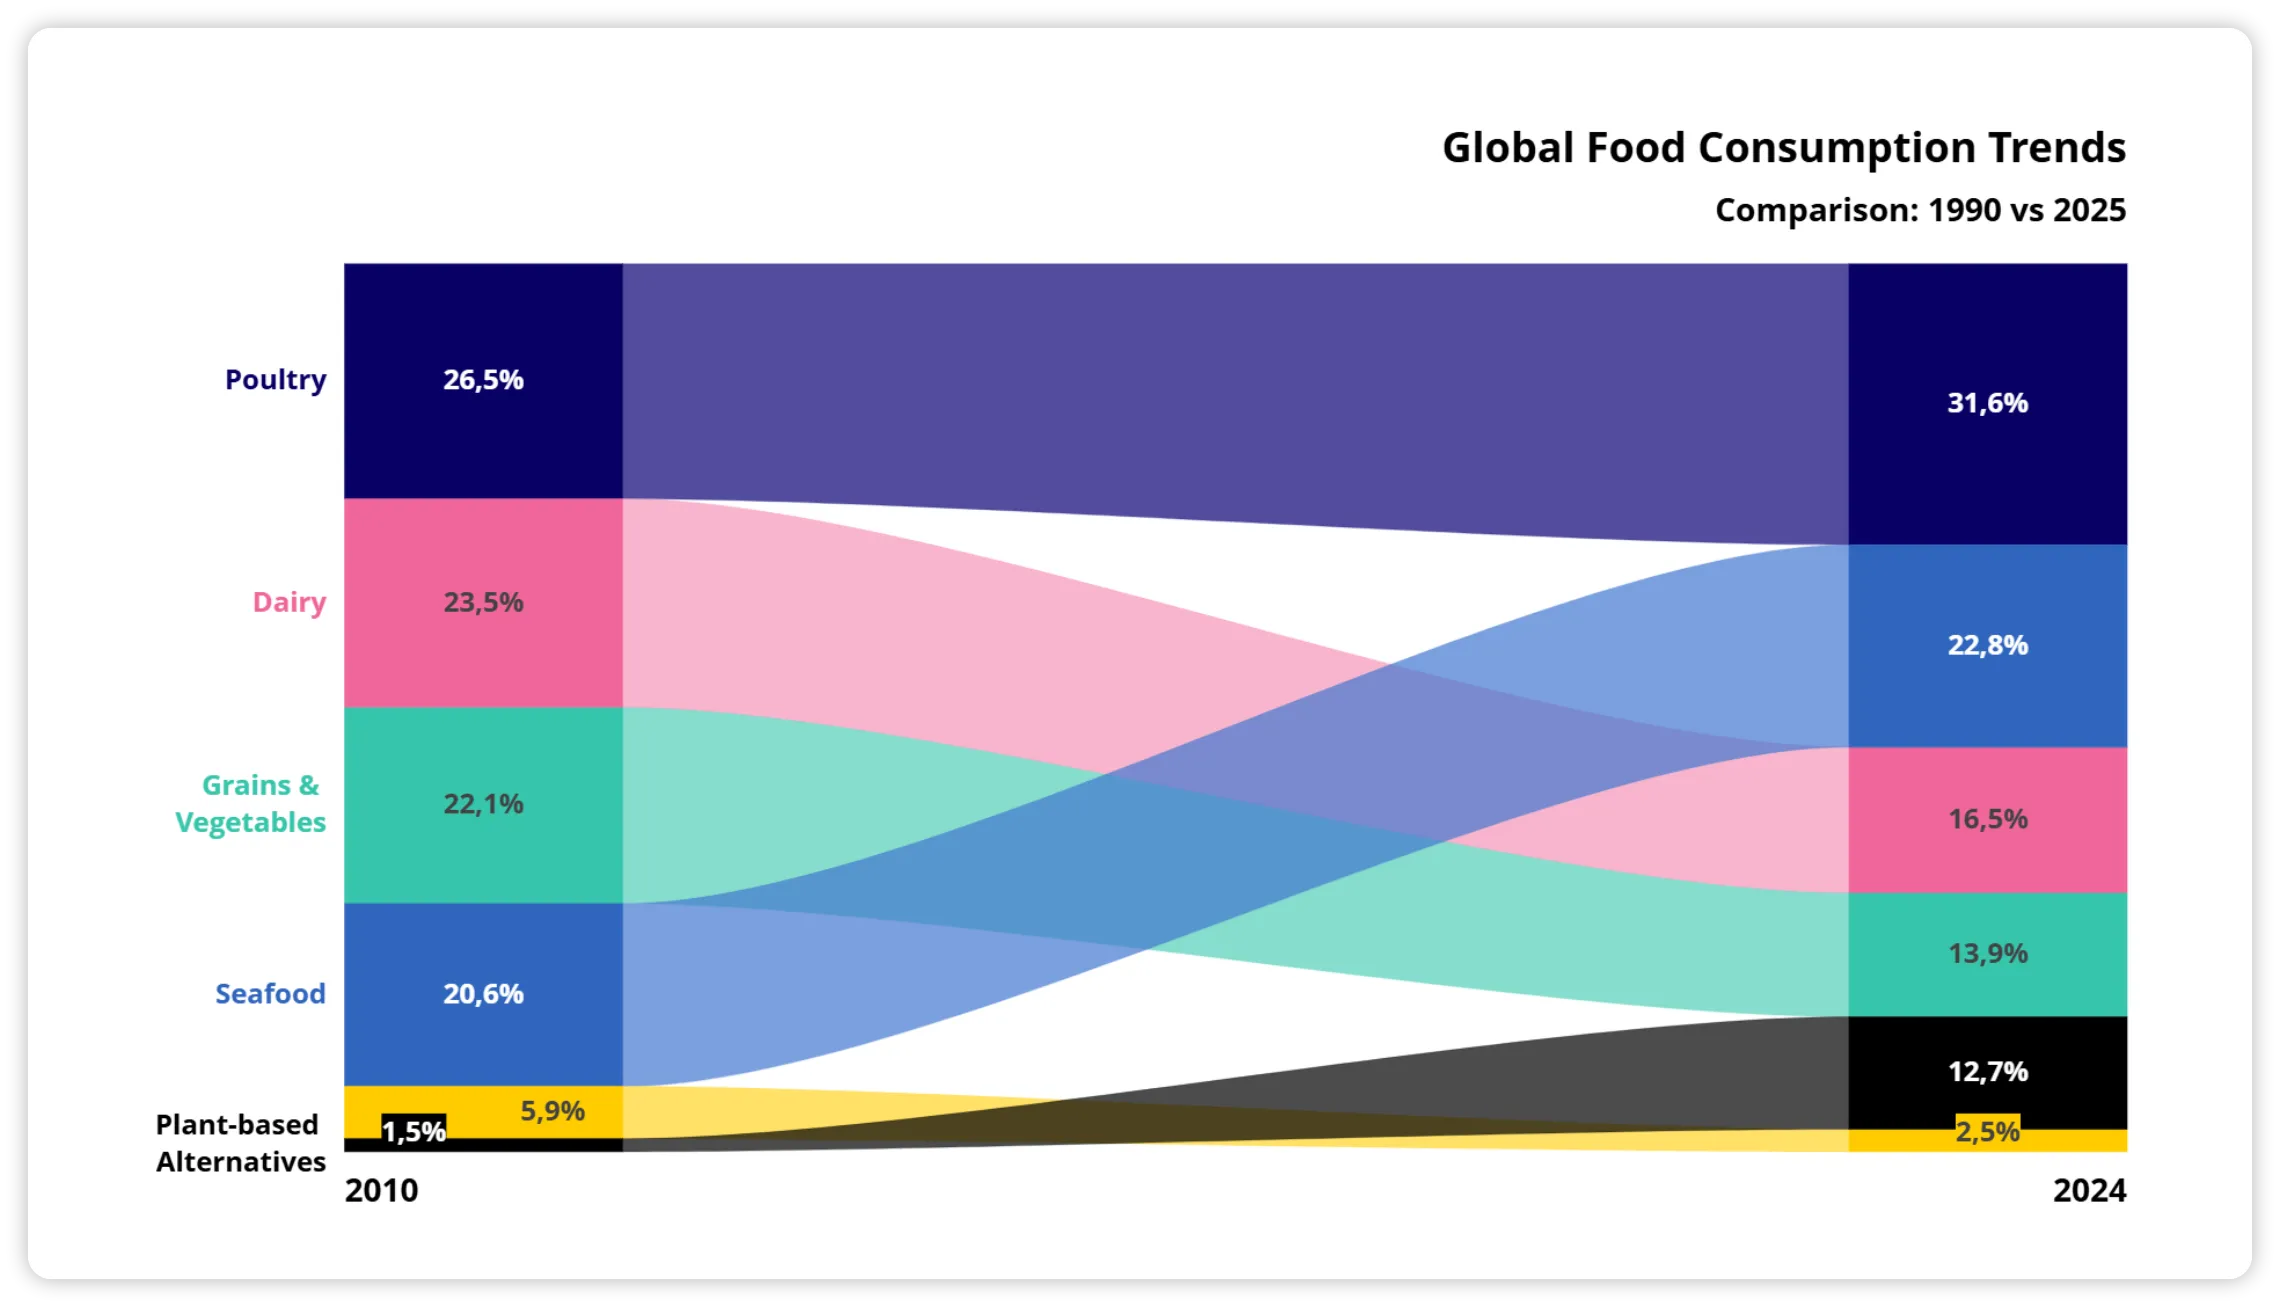
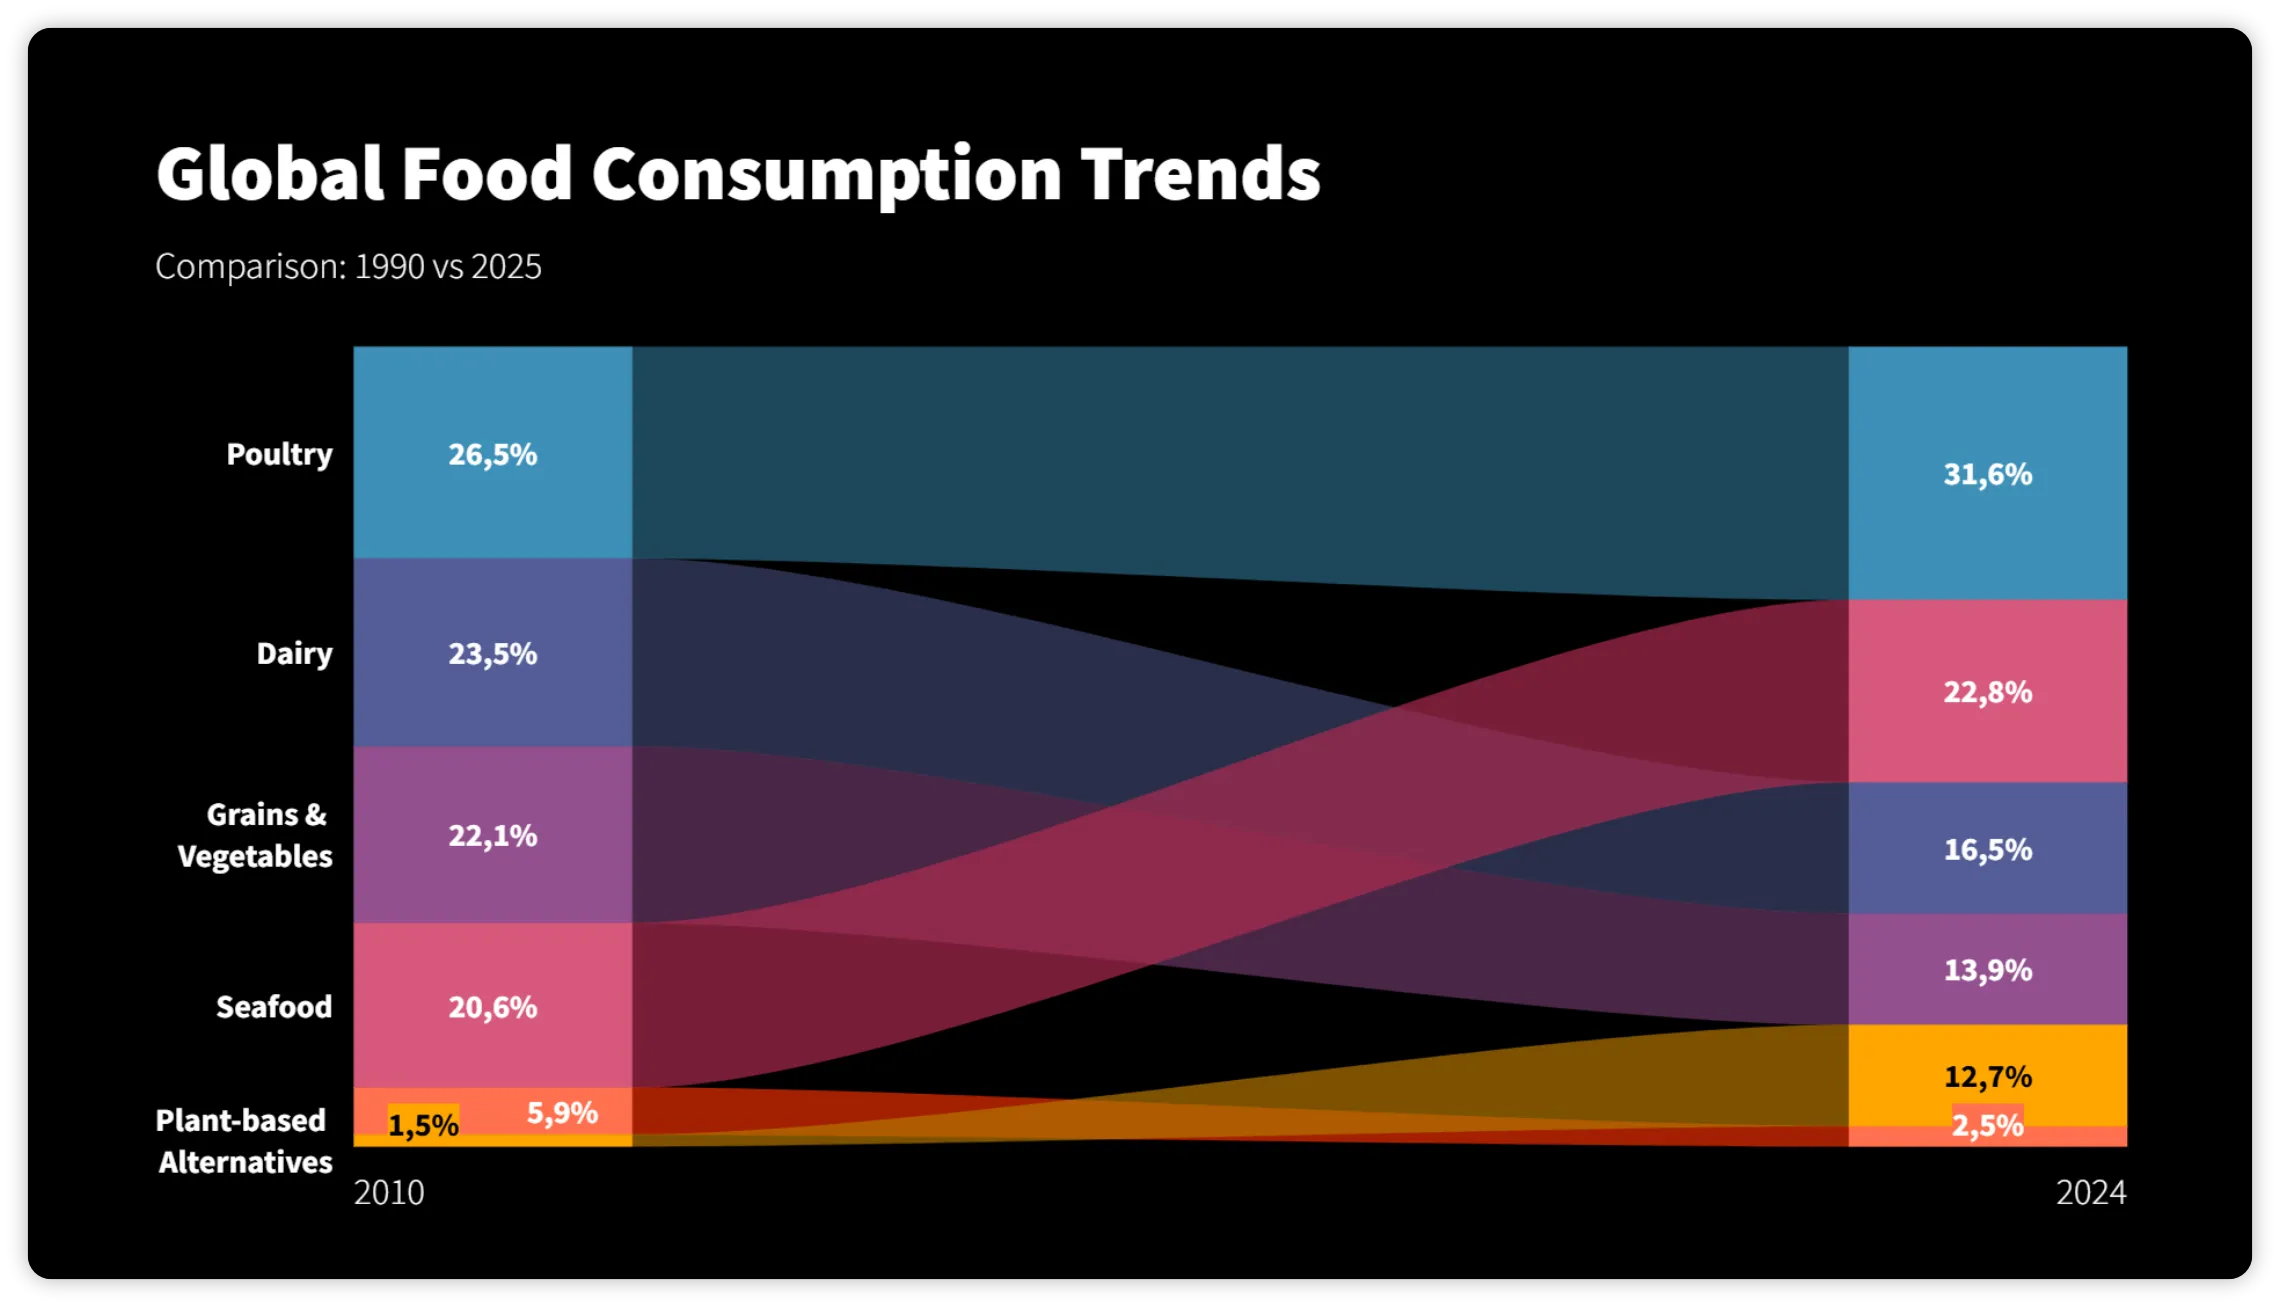
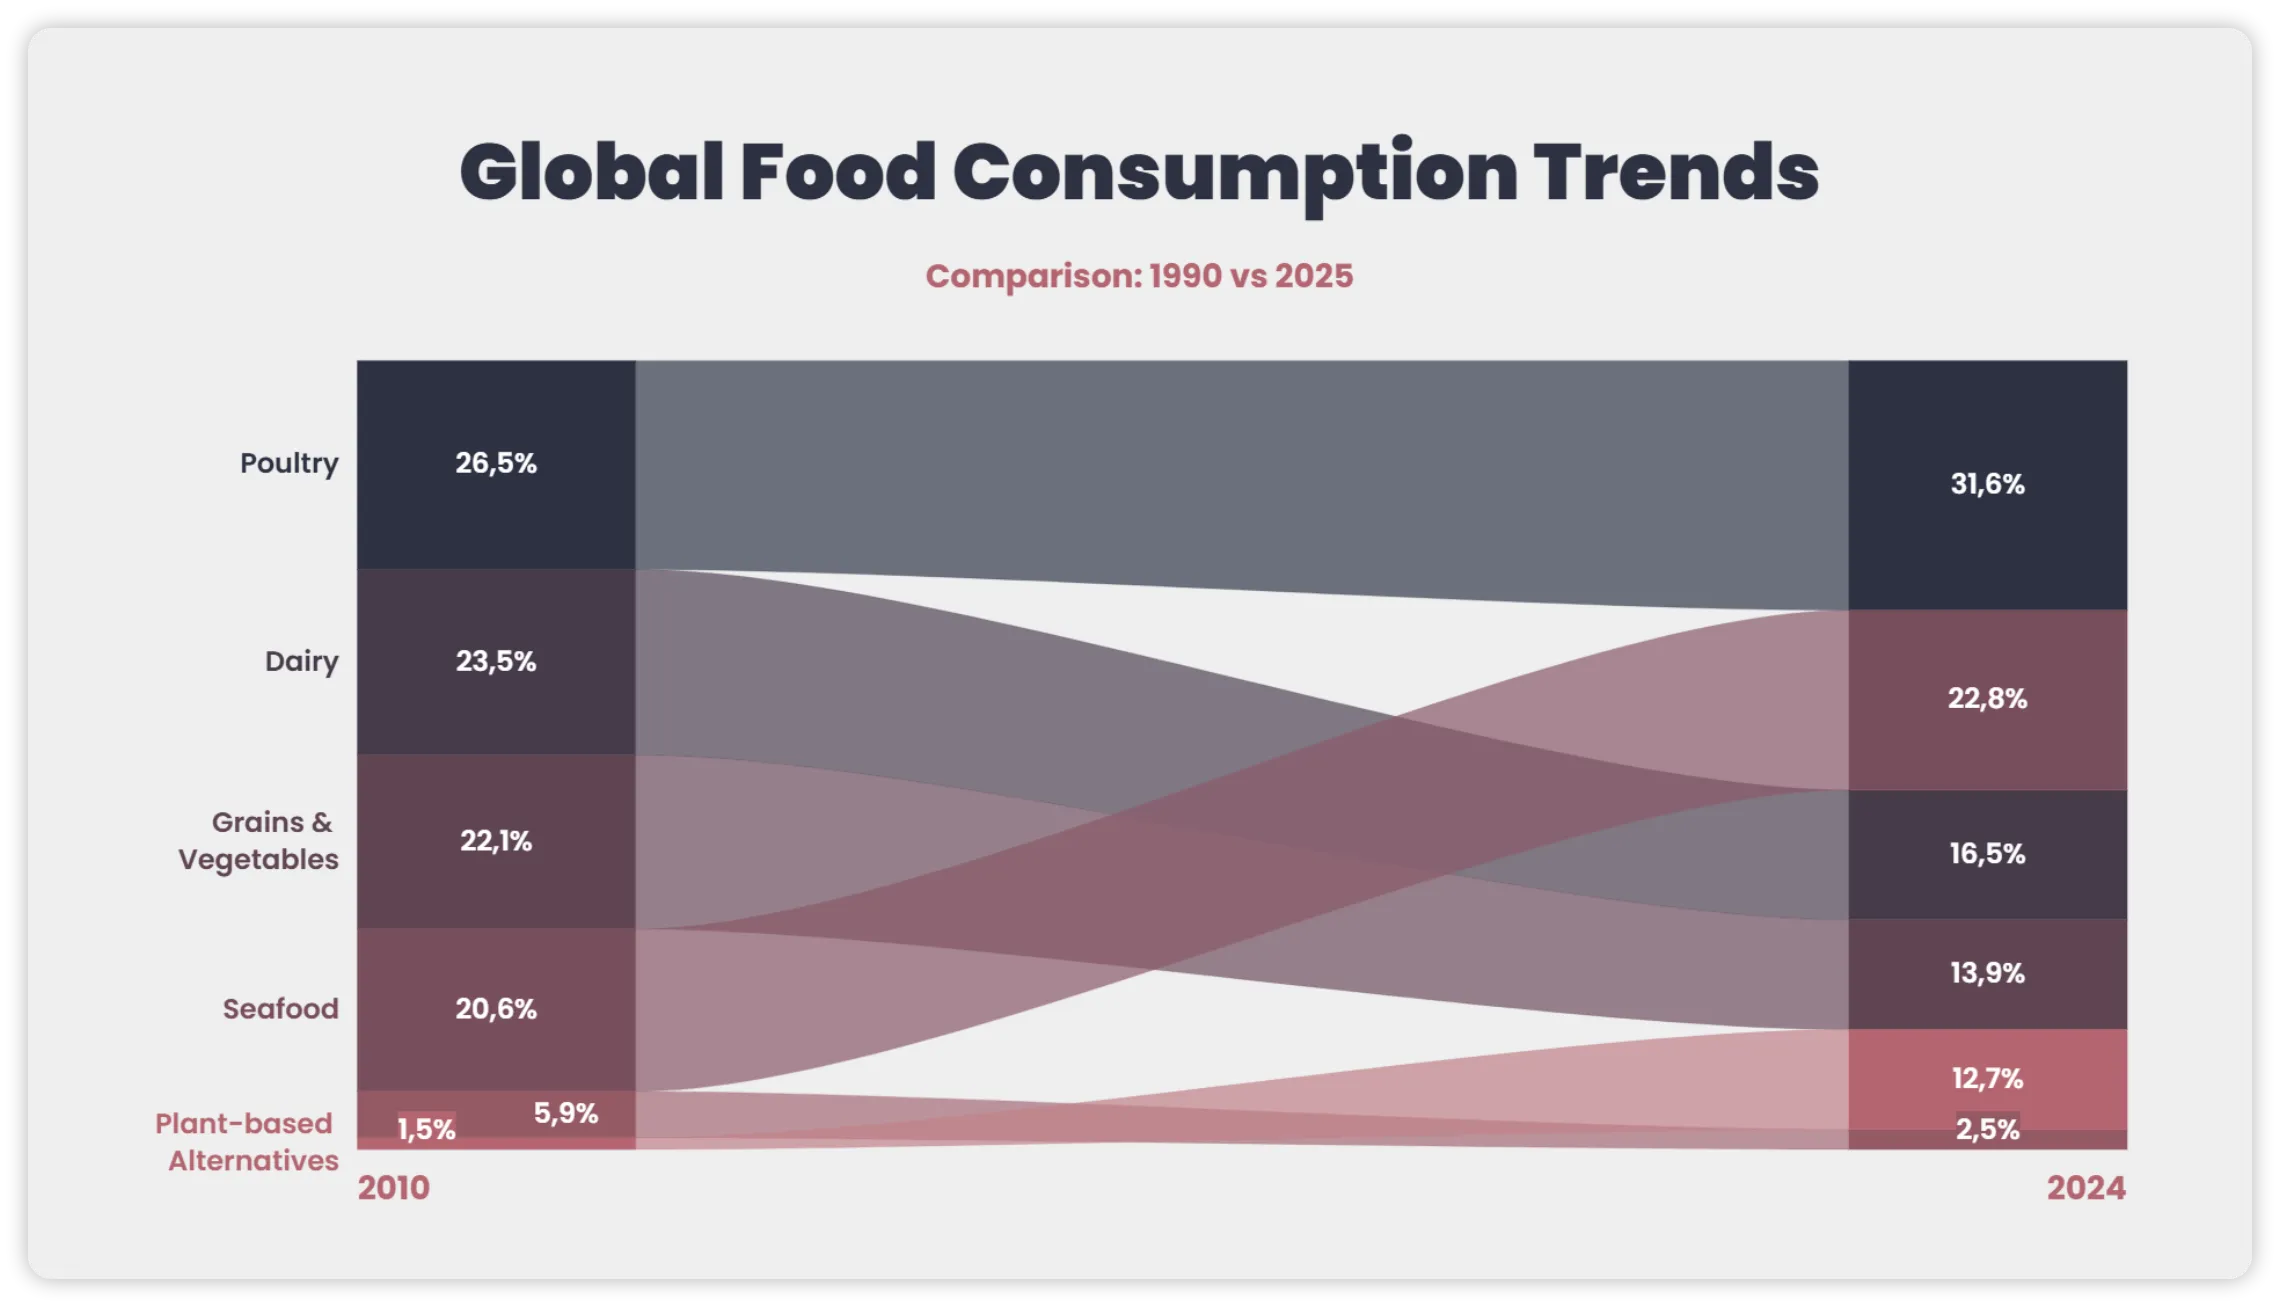
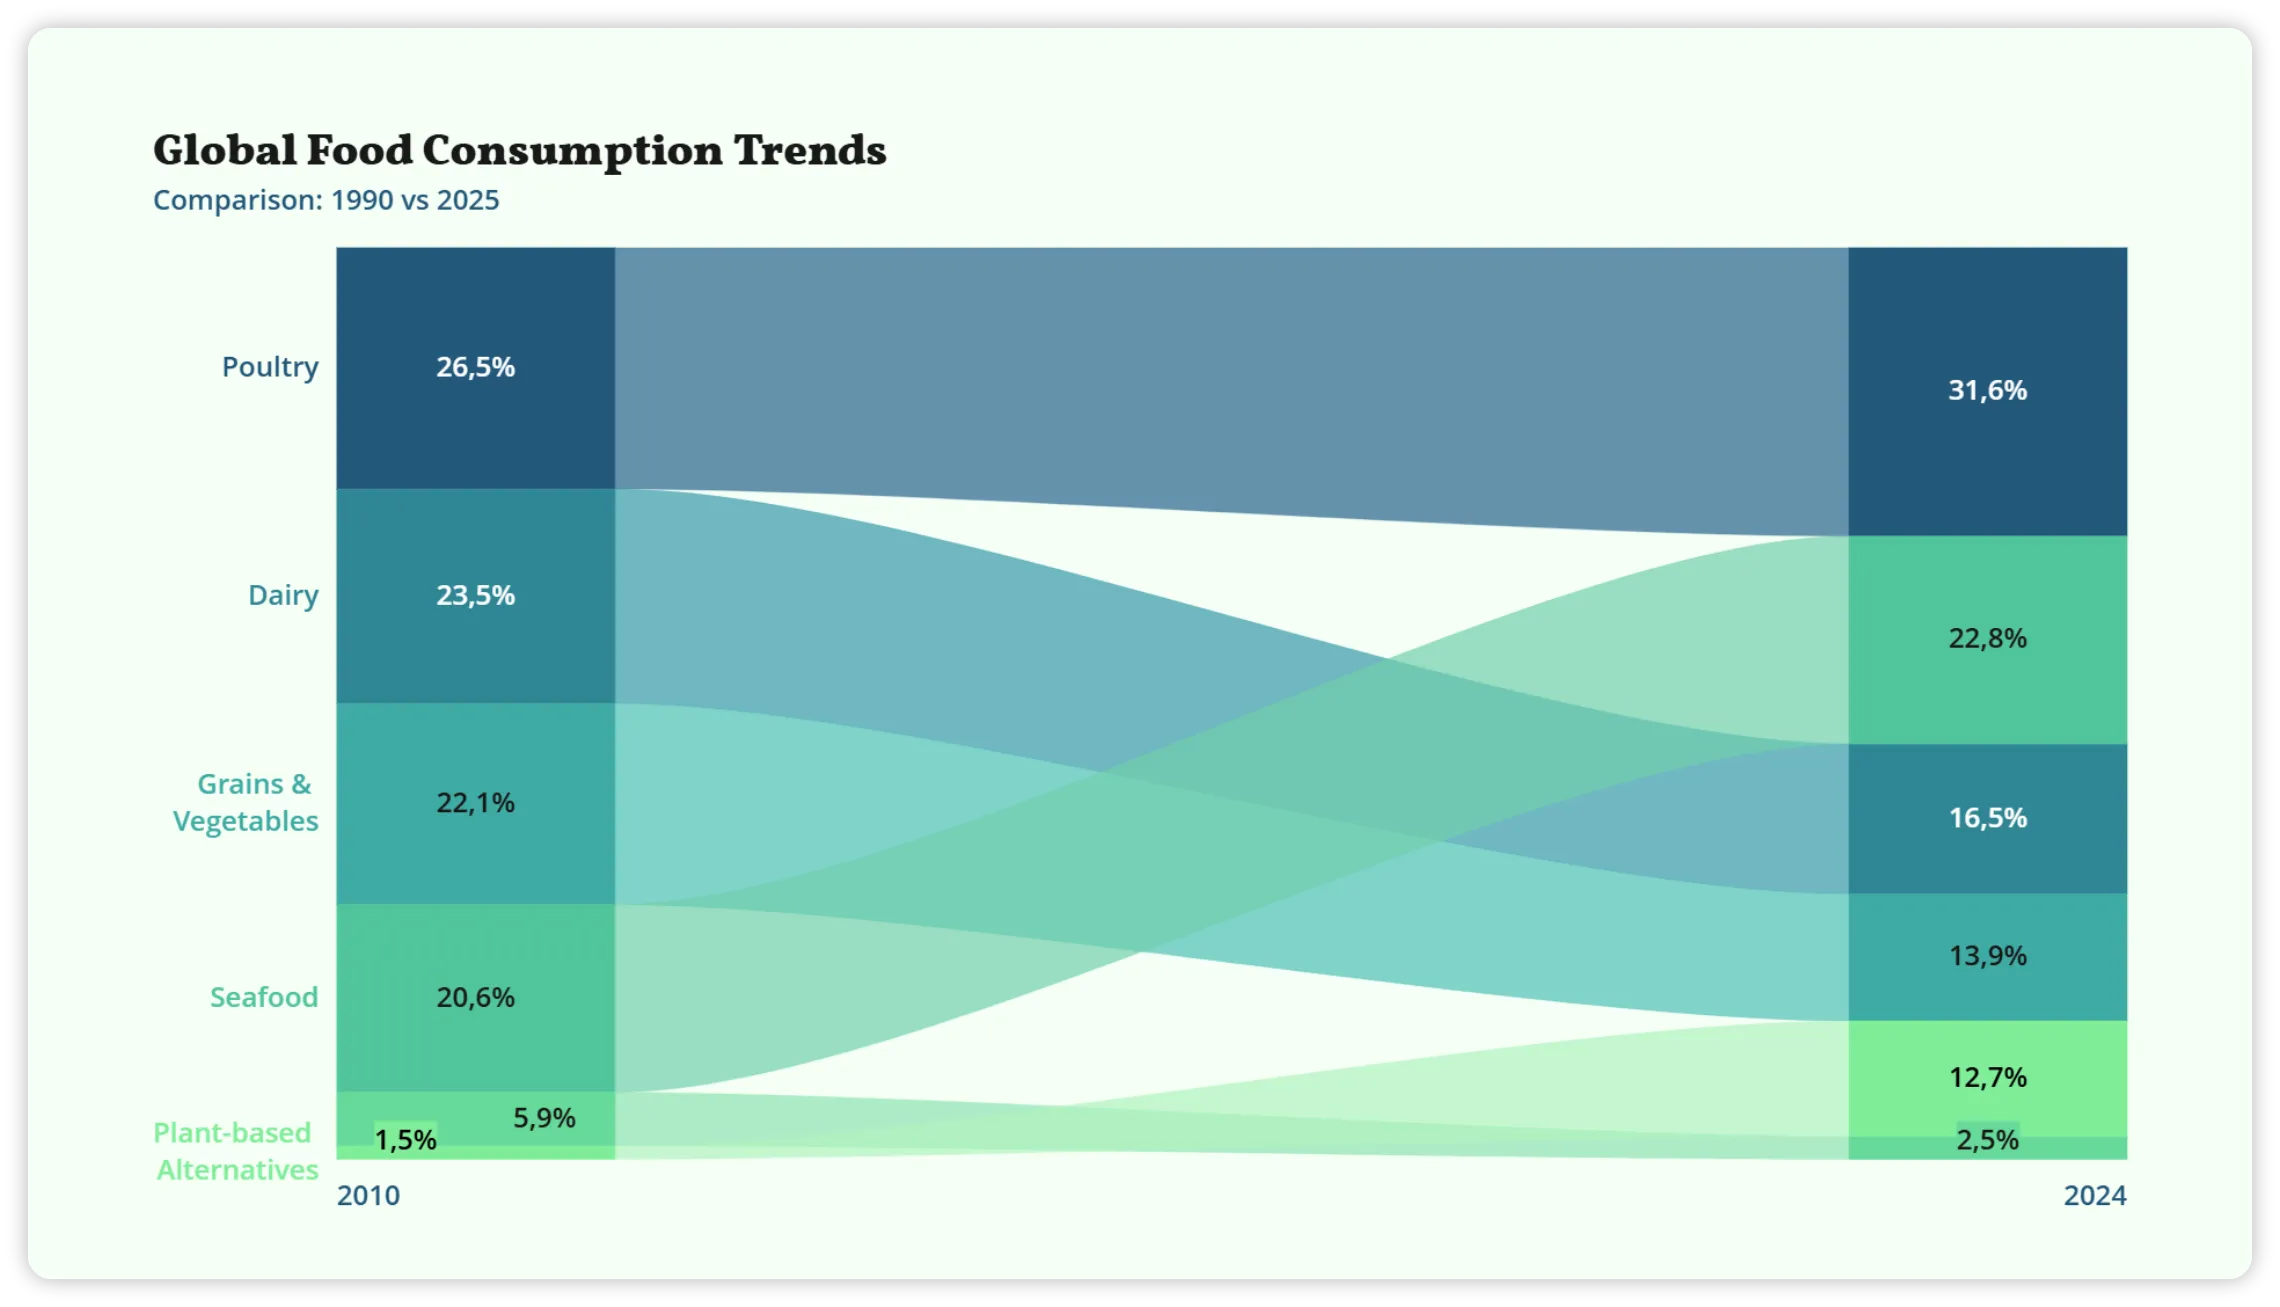
Keep every chart on brand
Customize colors, labels, and styles so your charts work naturally alongside the rest of your Miro content.
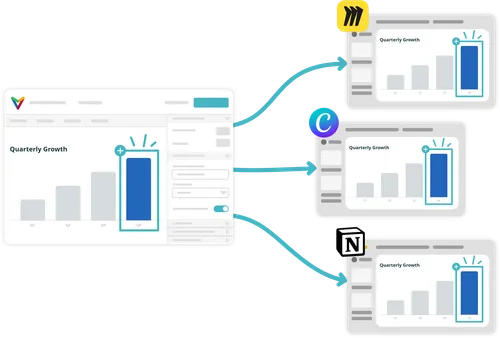
Keep your board current as the data changes
Update the chart in Vizzlo instead of replacing old screenshots. Your connected chart in Miro stays aligned with the latest version.
Use one chart across the whole workflow
Bring the same visualization into Miro, Notion, Confluence, Canva, WordPress, and more — while keeping a single source to update.





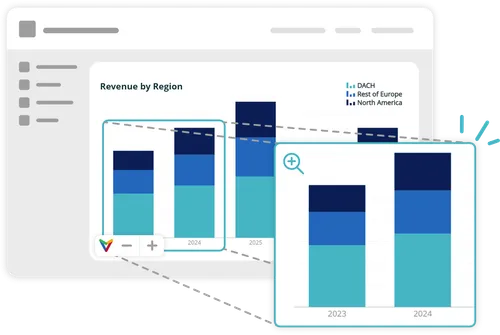
Give your board more context than a screenshot
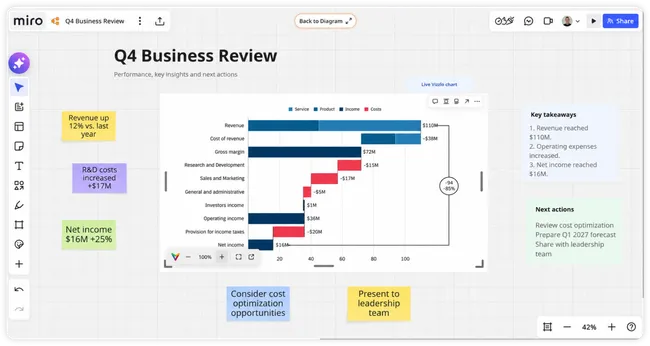
Embedded charts remain clear and easy to explore, helping teams zoom into details and work with the visualization directly inside the board.
-
Create your chart
Create and customize your chart in Vizzlo, PowerPoint, or Google Slides.
-
Copy the link
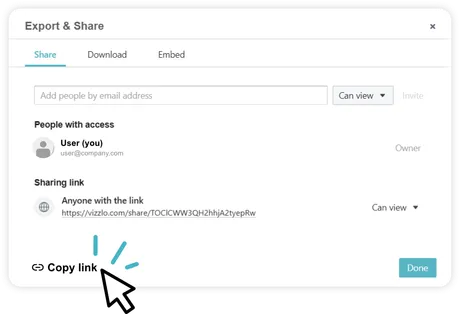
Open Export & Share and copy your sharing link.
-
Paste in Miro
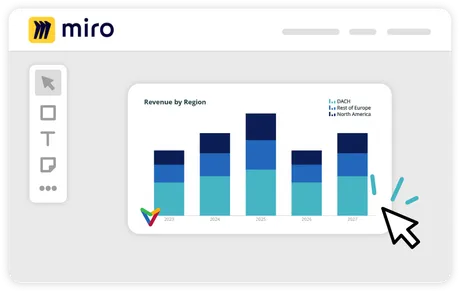
Paste the link into Miro to add your chart.
-
Keep it updated
Update the chart in Vizzlo — or let connected data sources refresh it automatically.