Better charts for your Canva designs and presentations
Create charts that fit naturally into presentations, reports, infographics, and branded content.
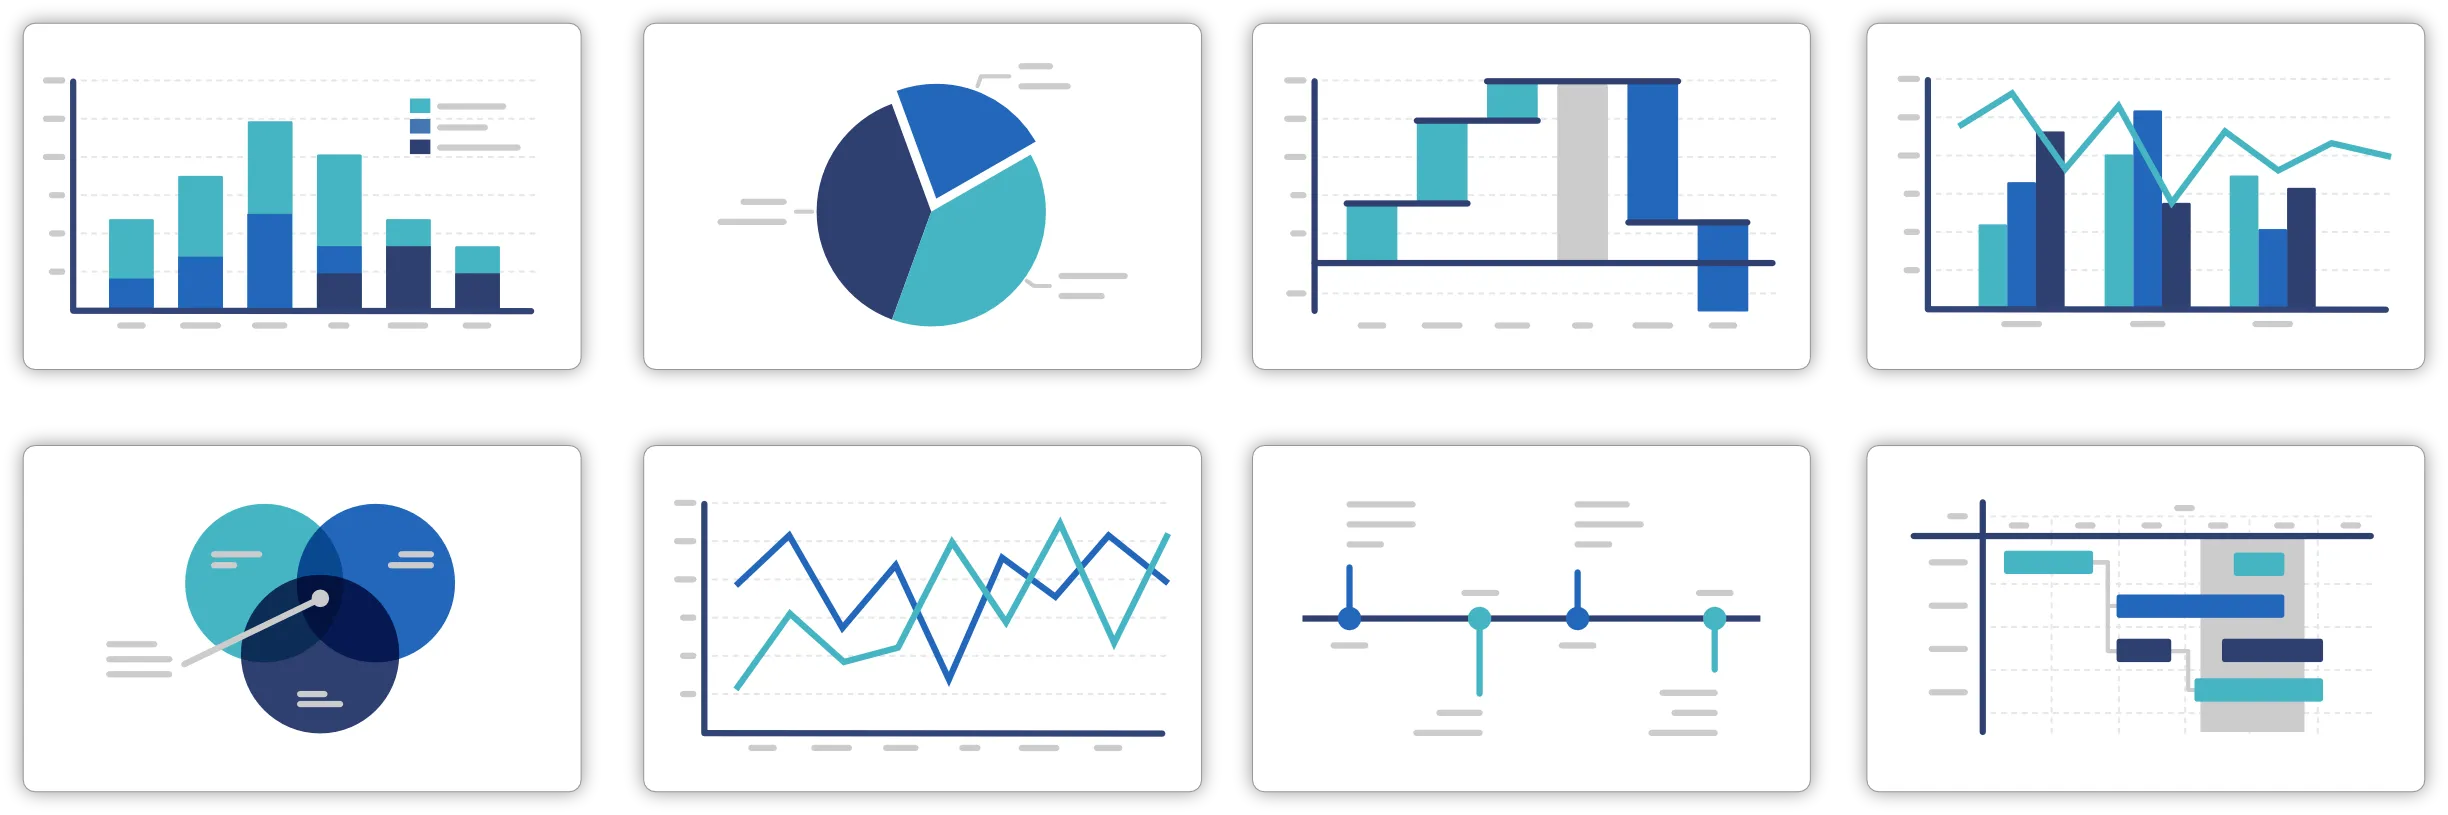
120+ professional chart types
Choose from 120+ chart types to visualize everything from simple comparisons to complex stories.
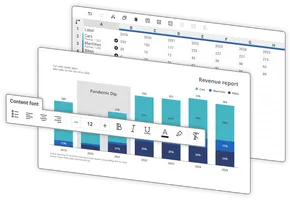
Create charts faster
Create polished visuals faster without manually drawing or formatting every element in Canva.
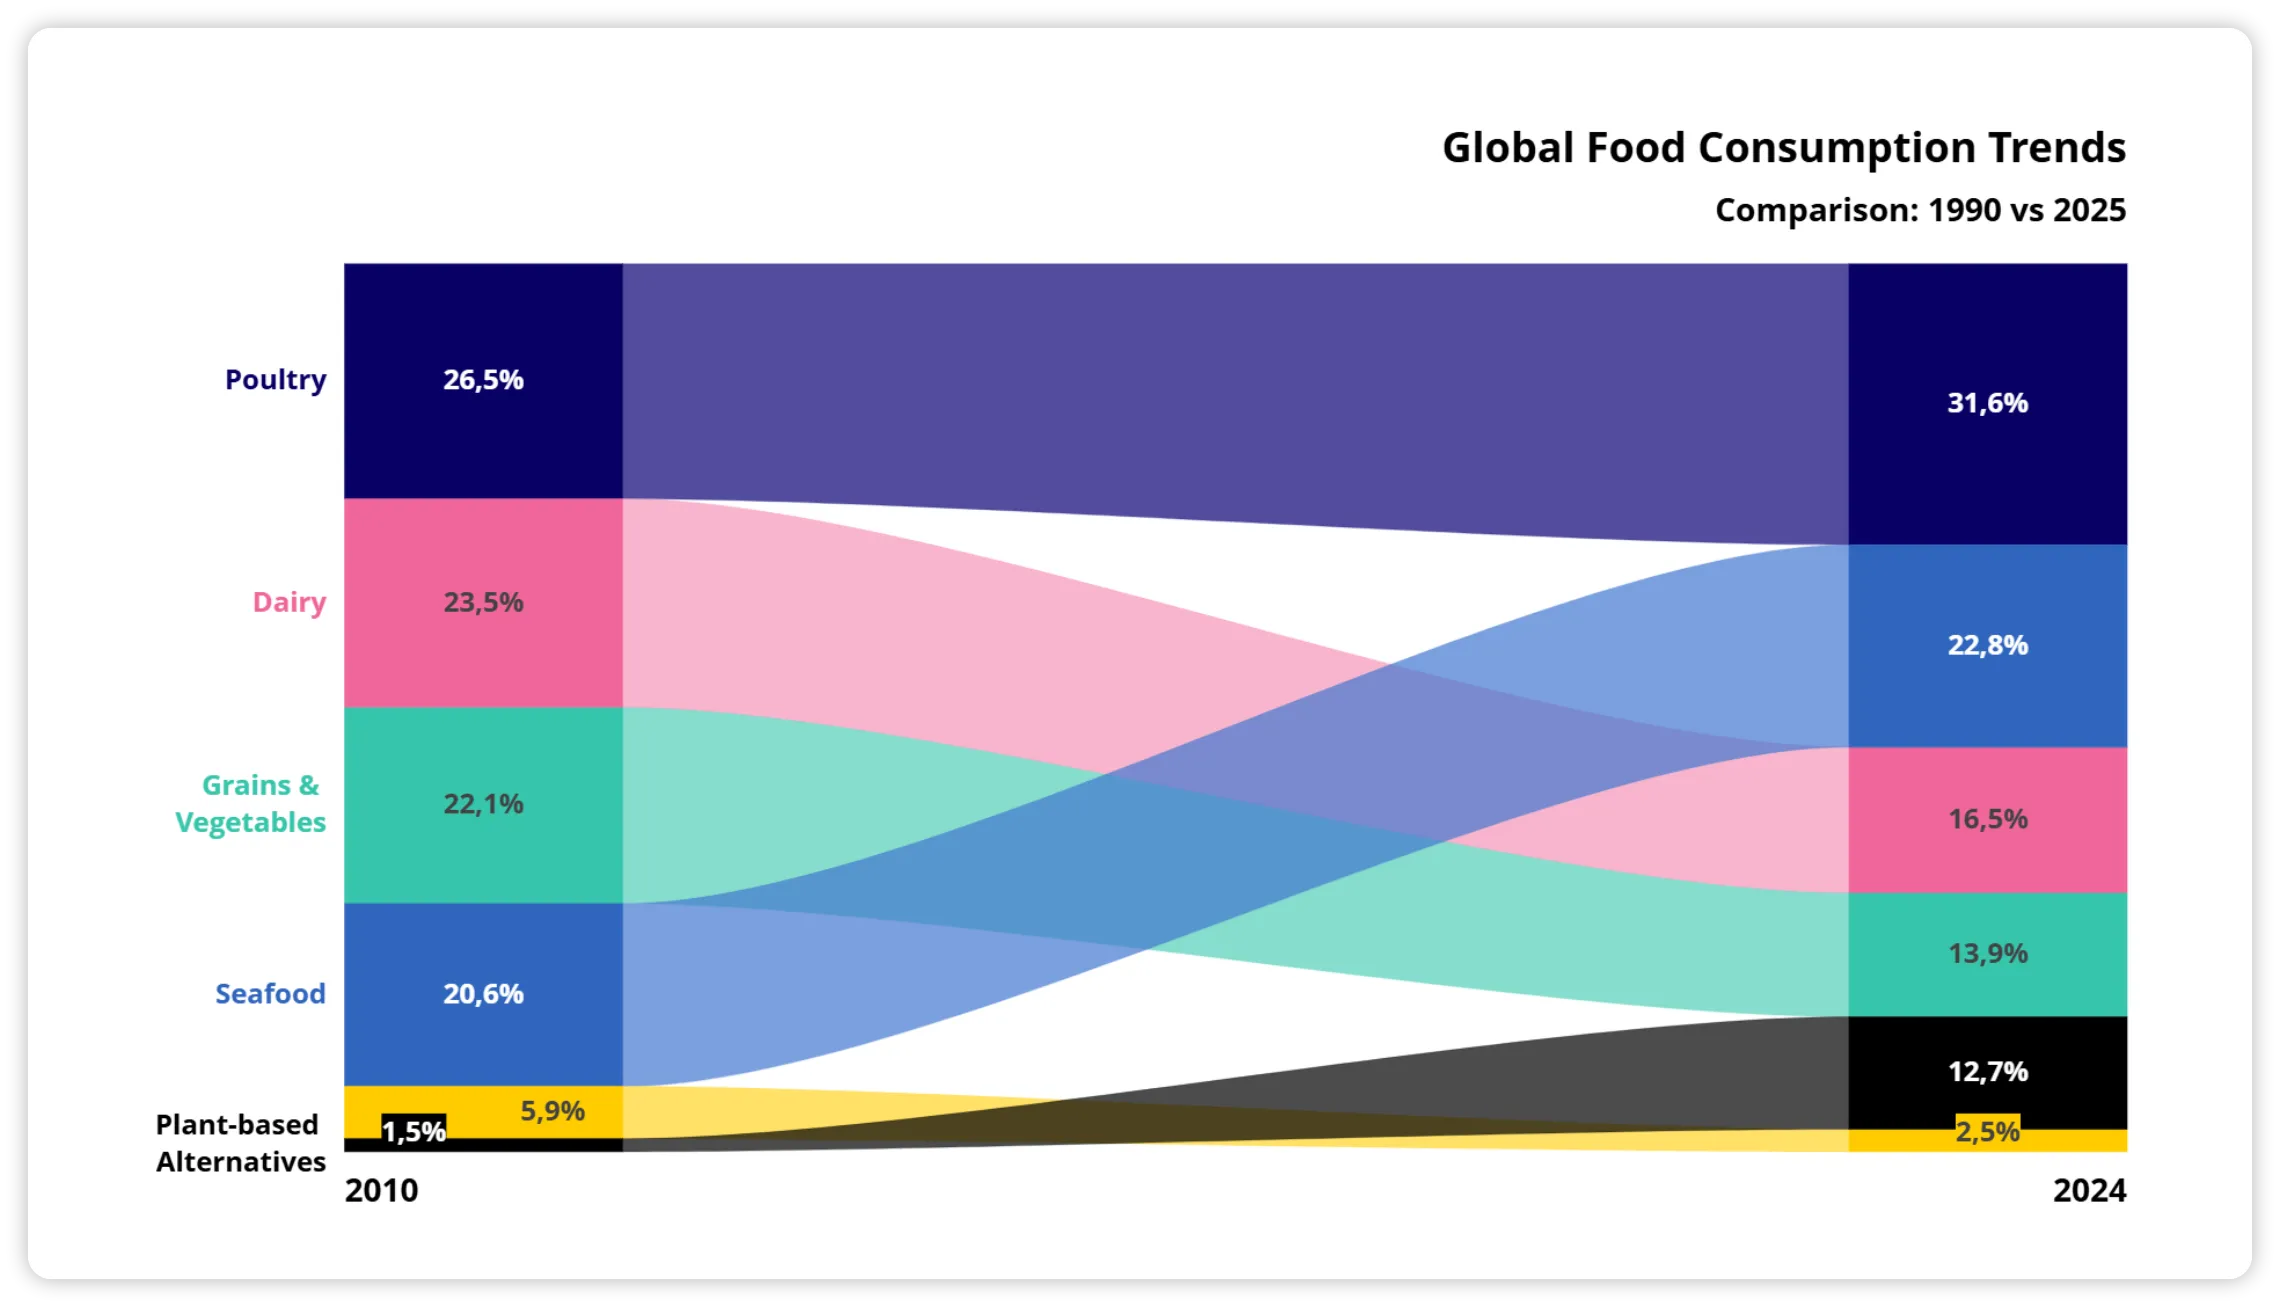
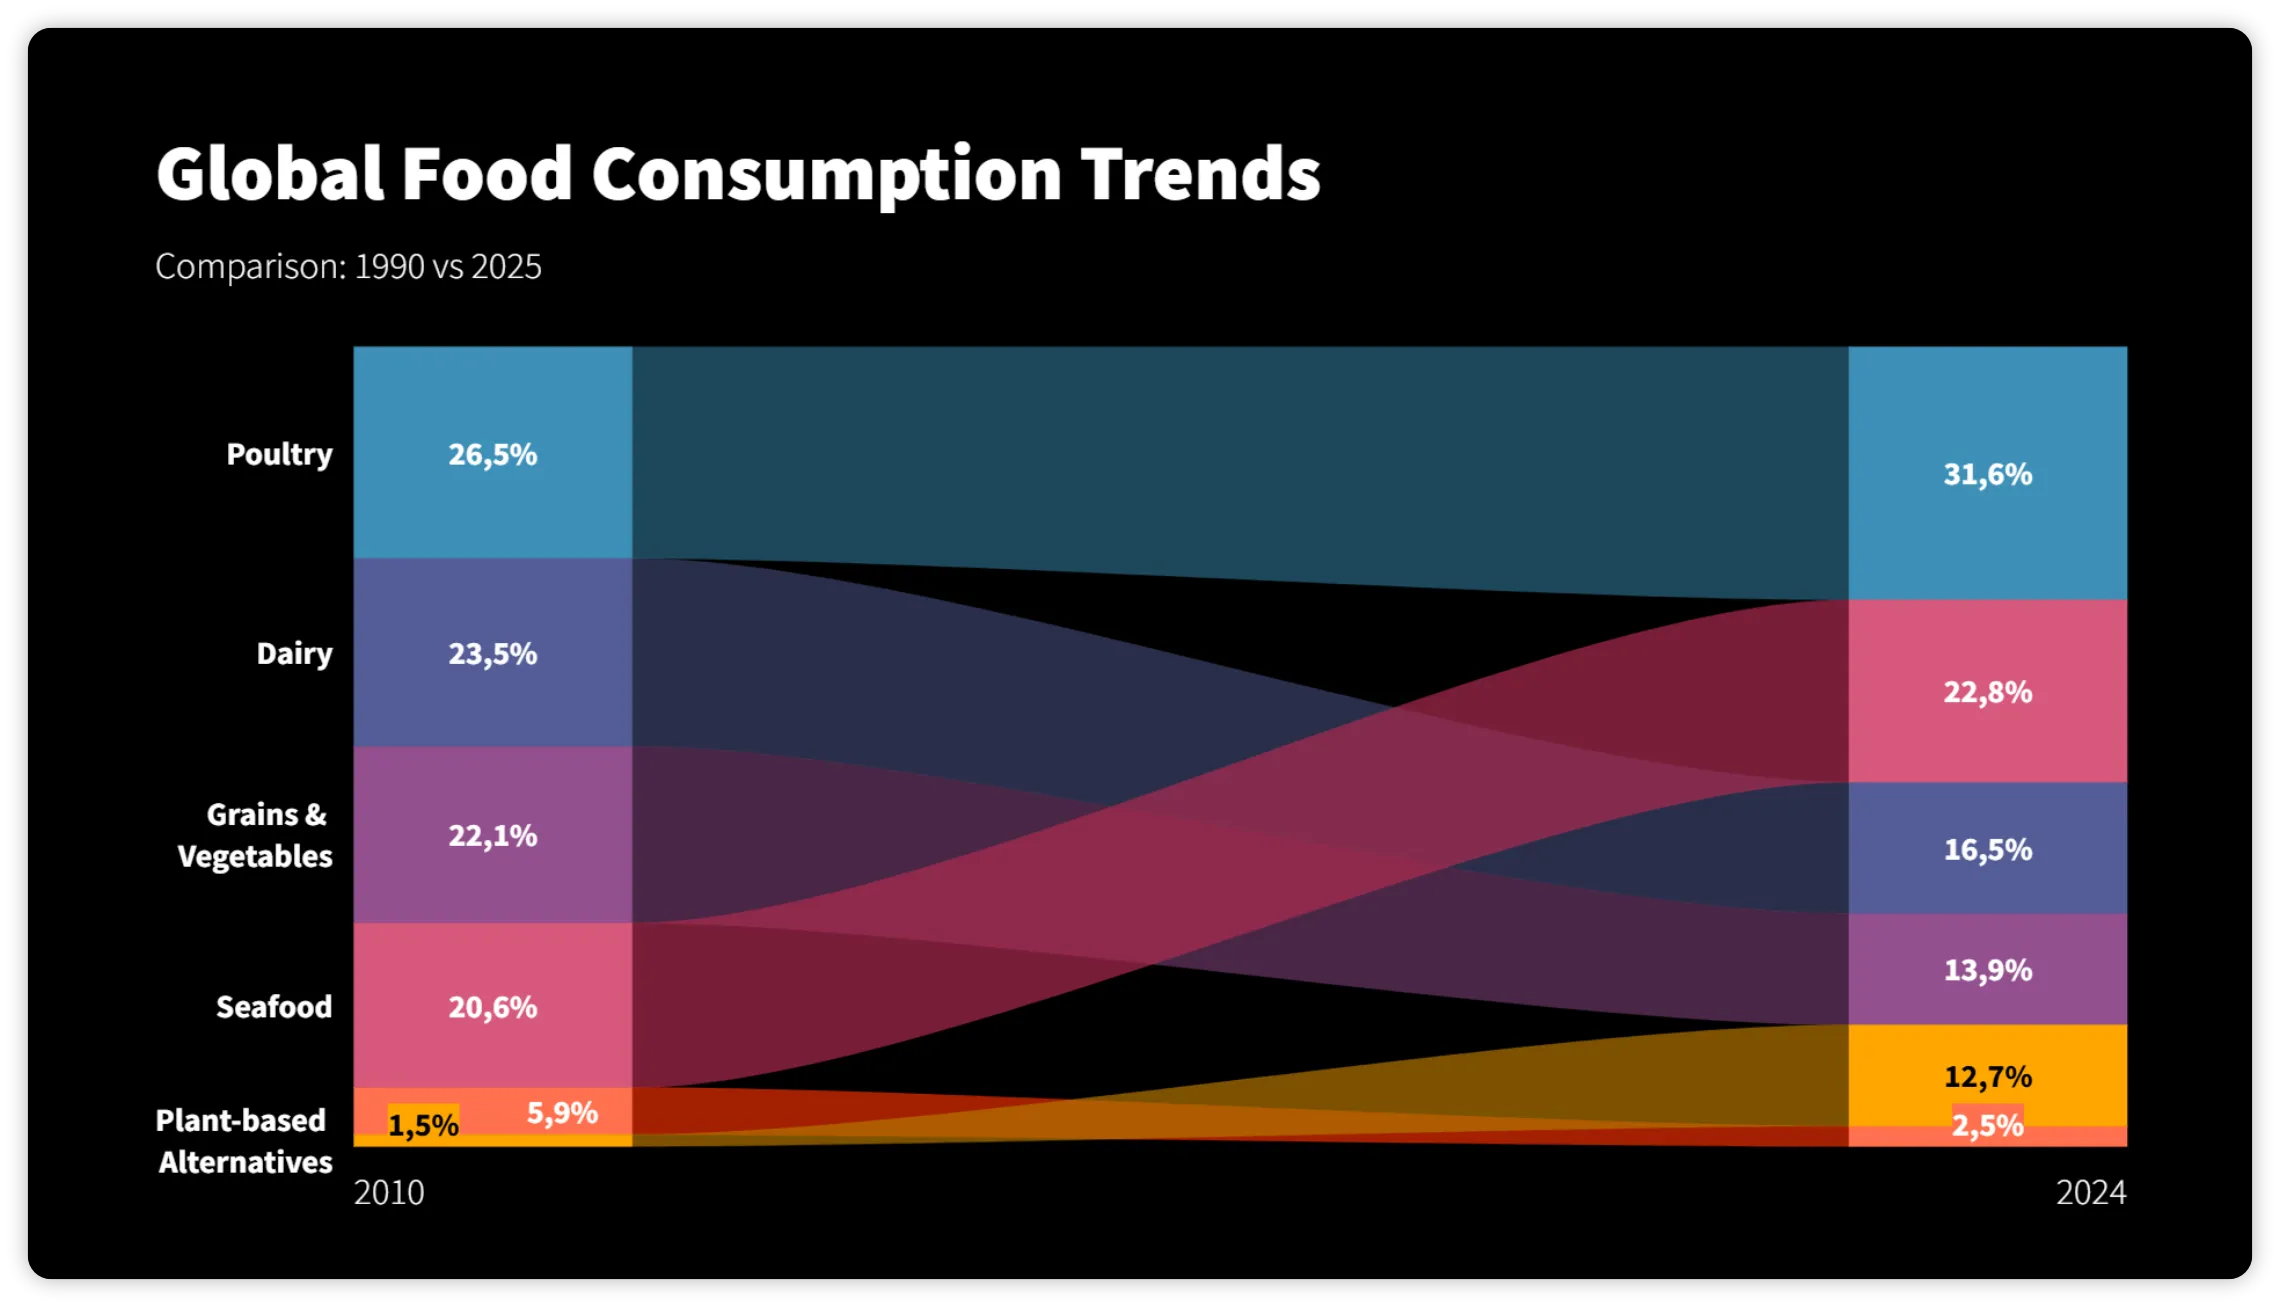
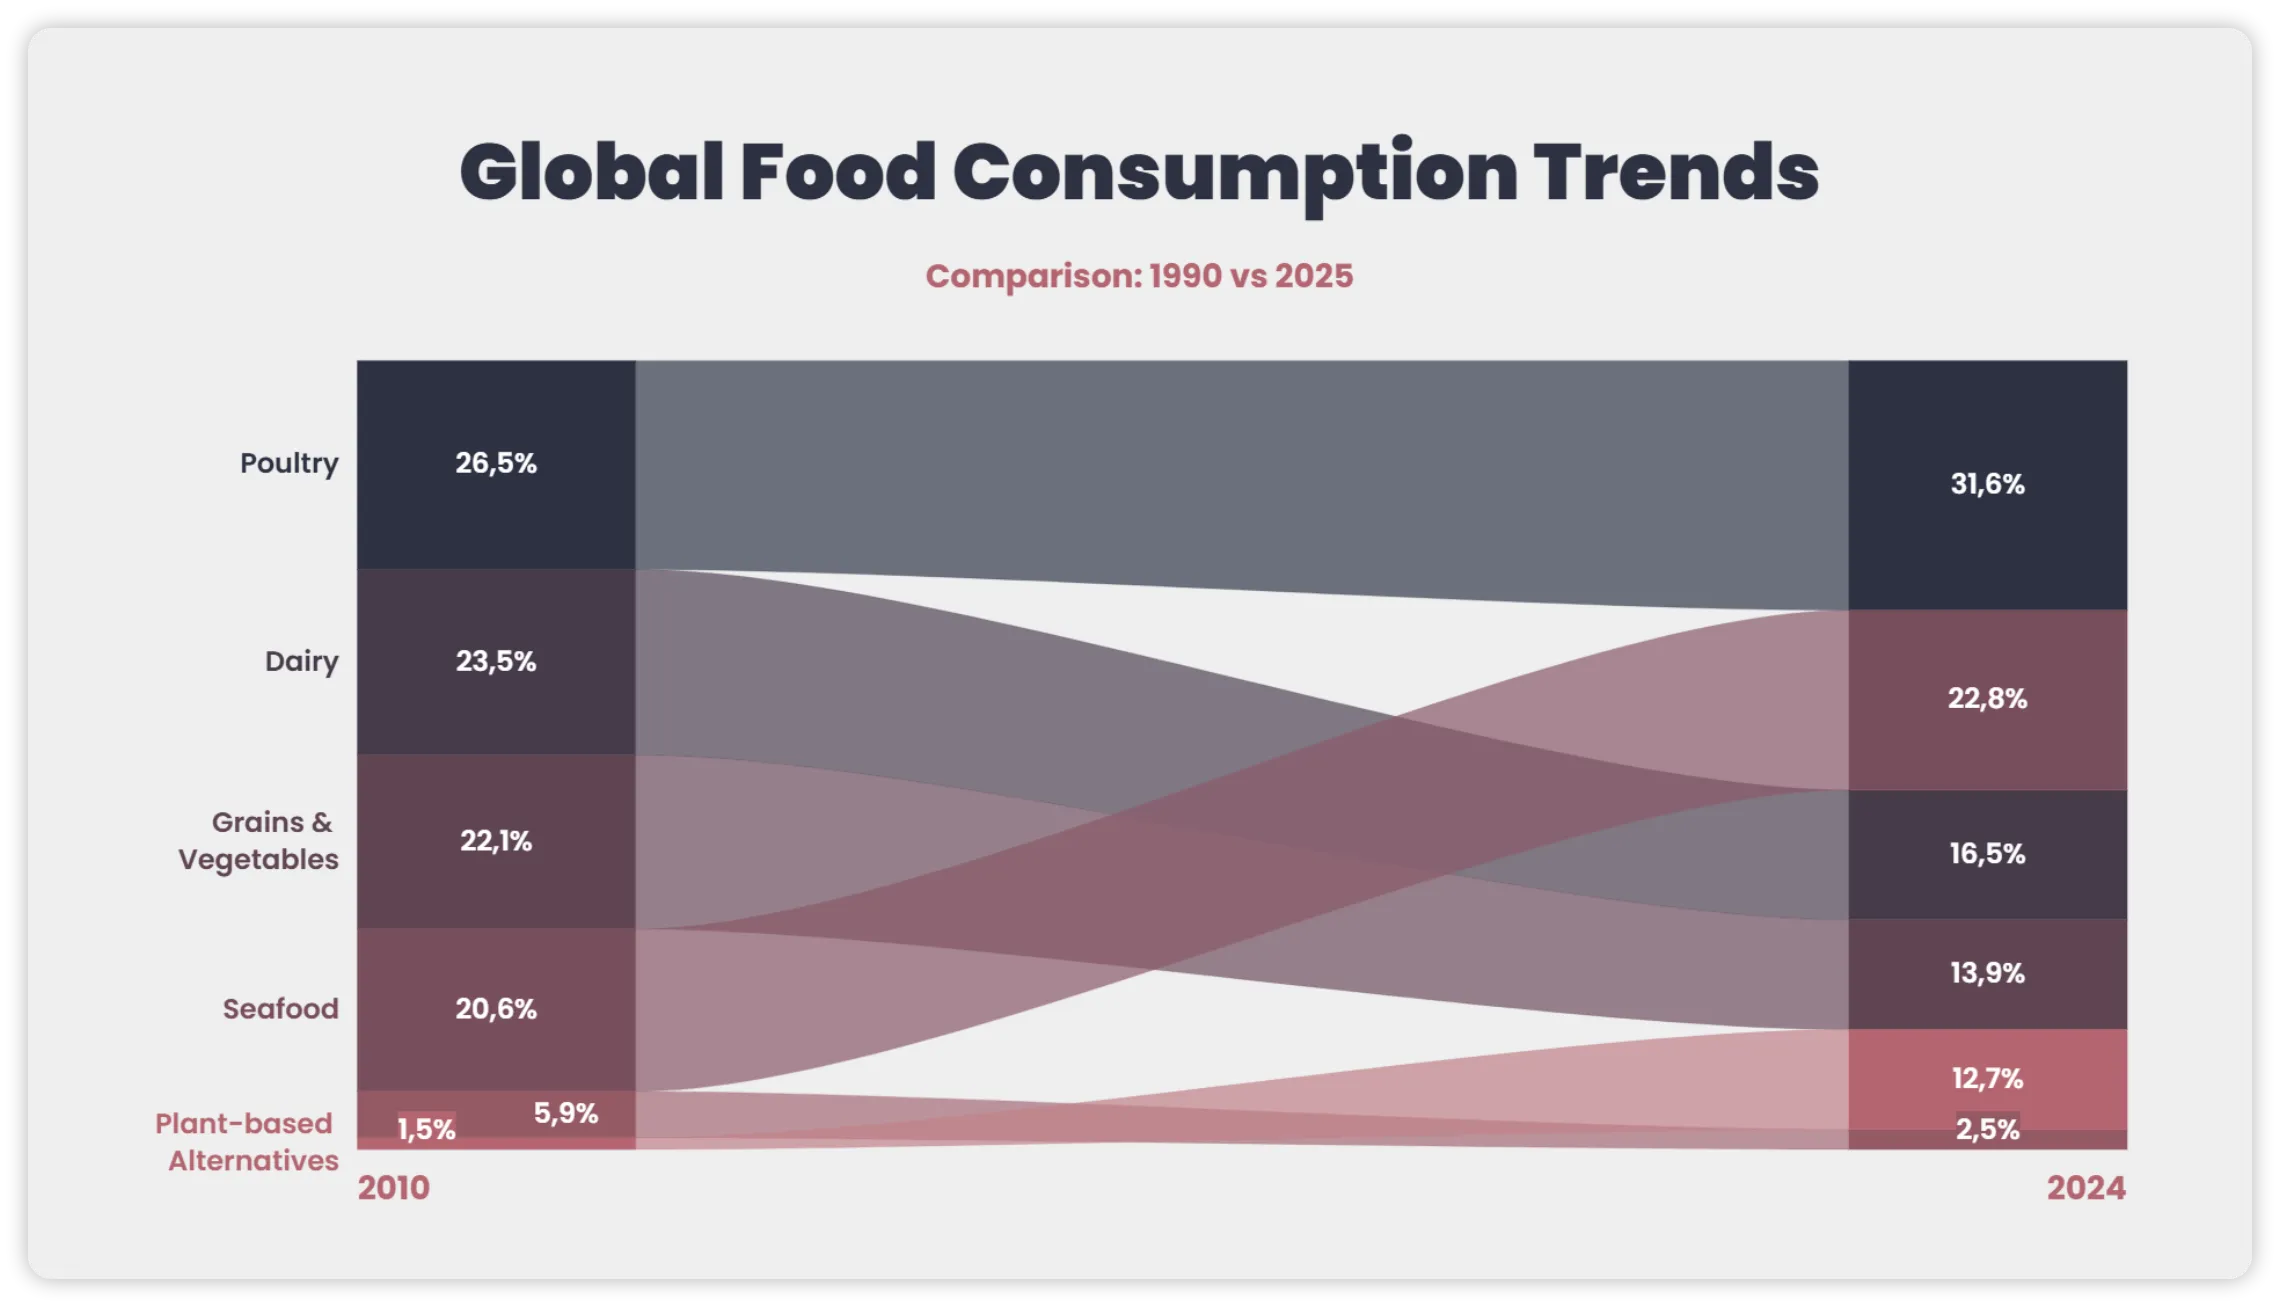
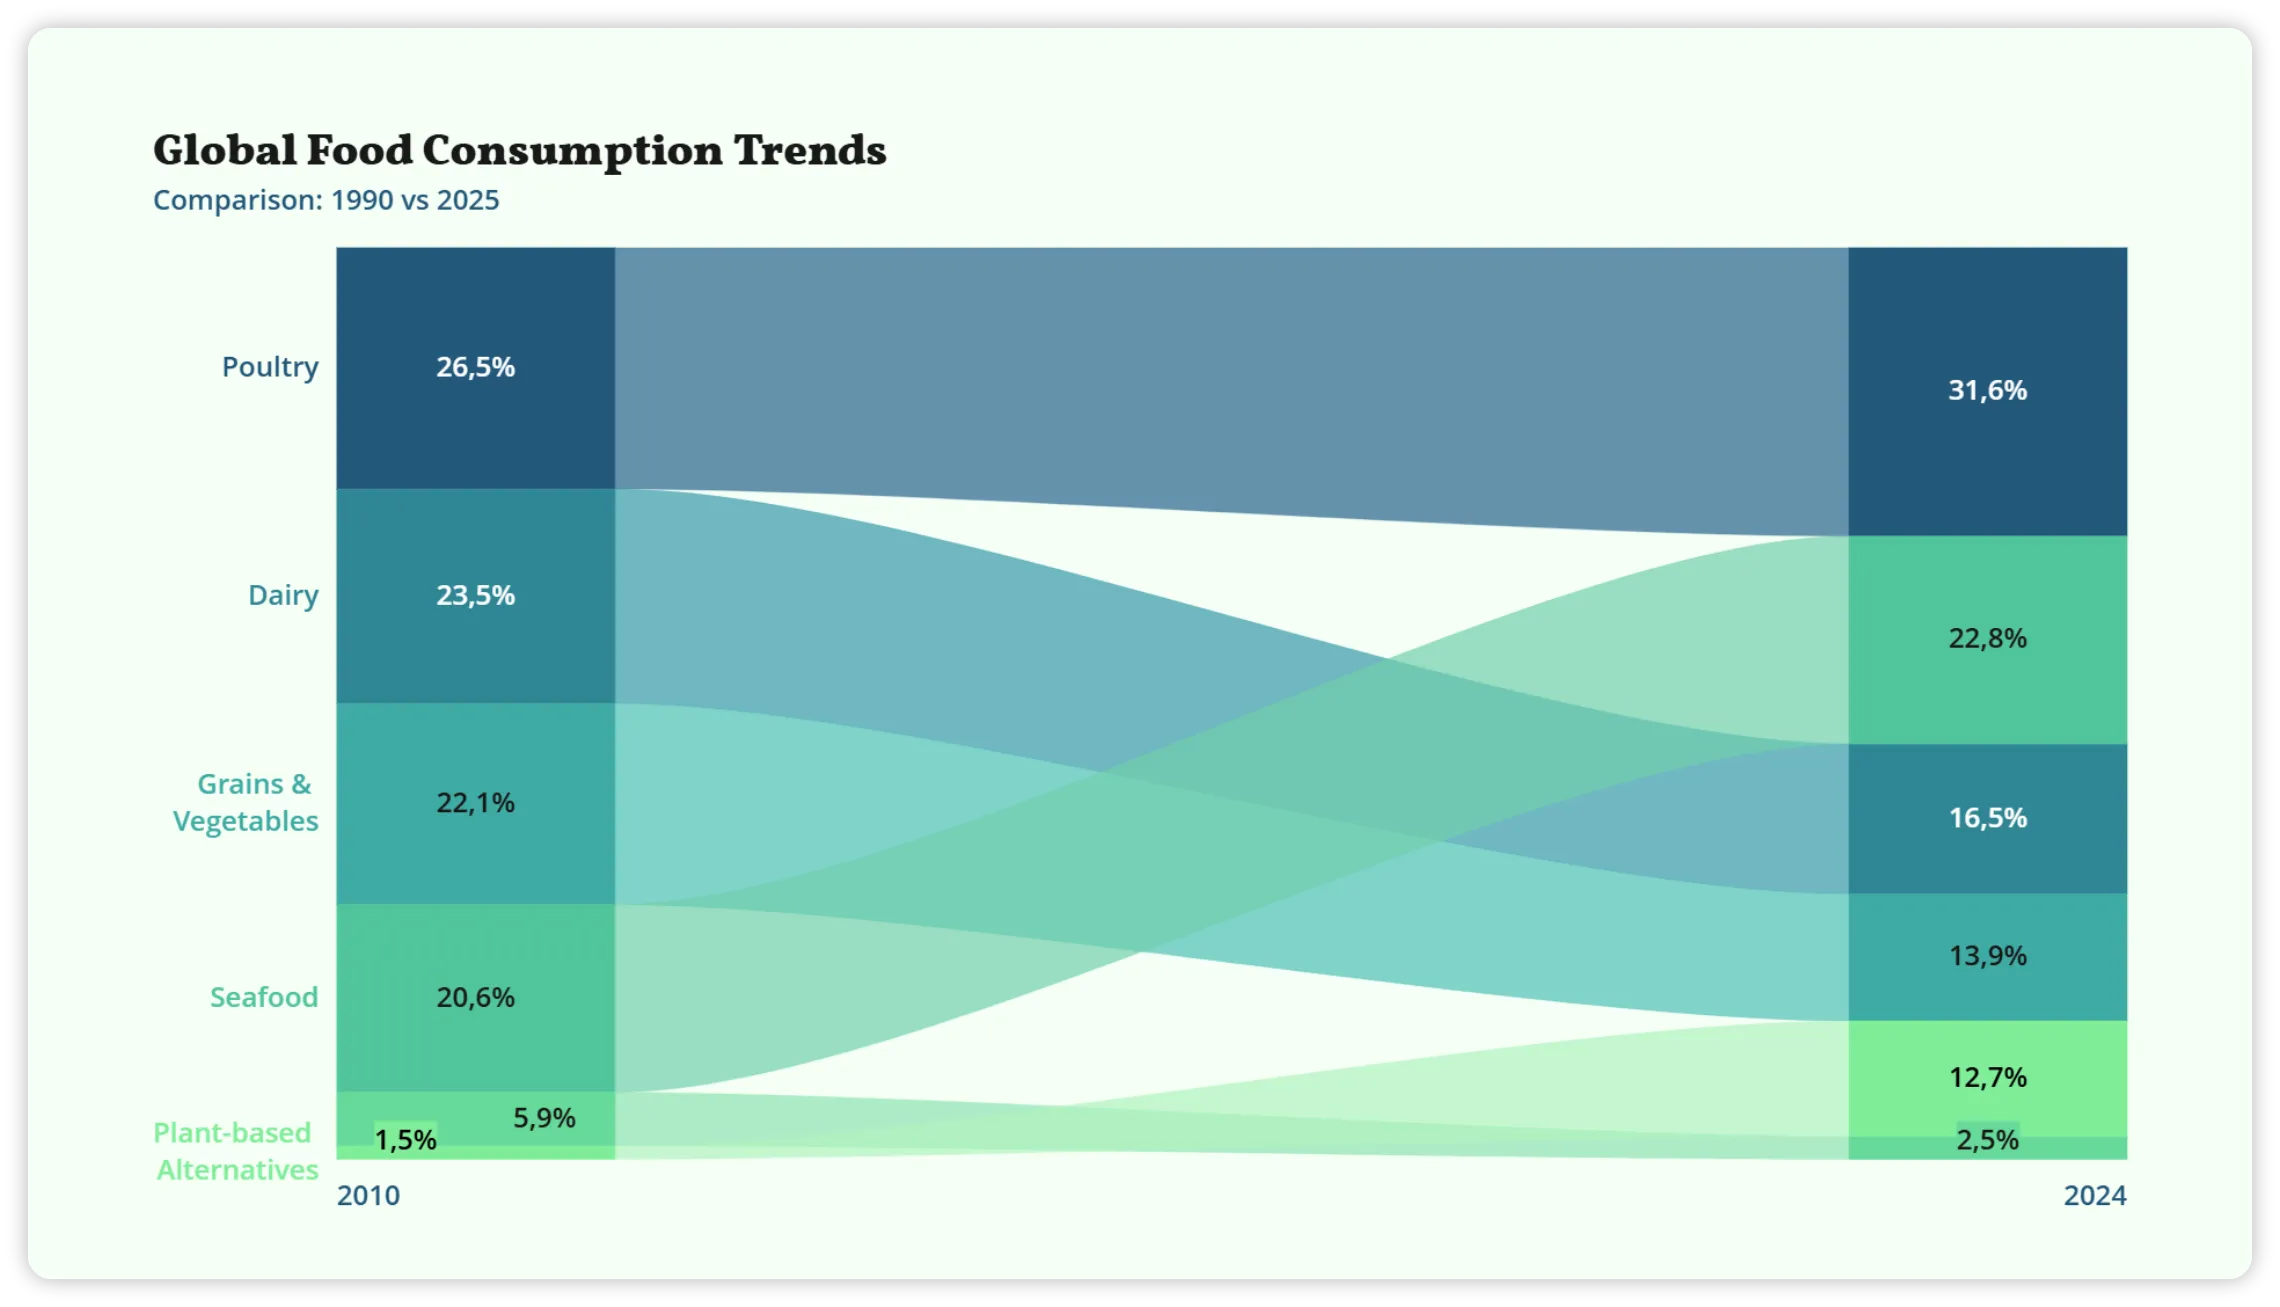
Keep every chart on brand
Adjust colors, fonts, labels, and styling to create charts that feel consistent with the rest of your design.
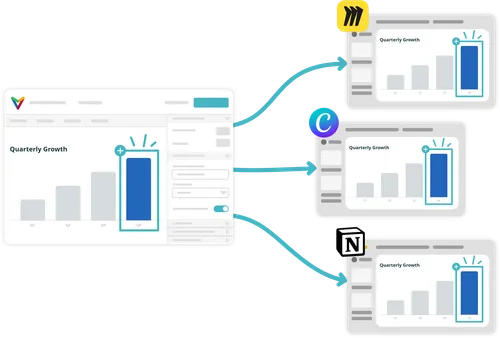
Update once.
Stay up to date in Canva.
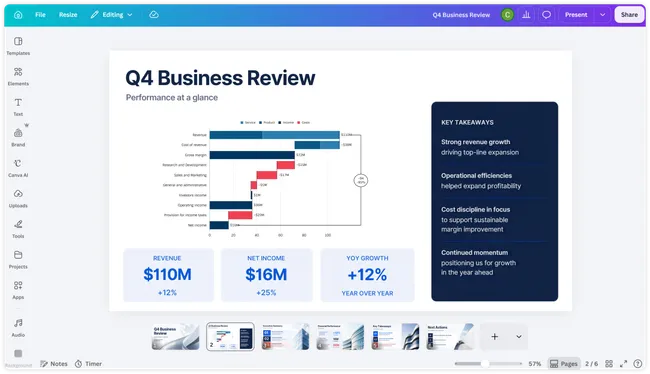
Update the chart in Vizzlo instead of rebuilding it from scratch. Your connected chart reflects the latest version.
One chart. Every place you need it.
Use the same visualization across Canva, presentations, documentation, websites, and collaborative tools — without creating a separate copy for every platform.





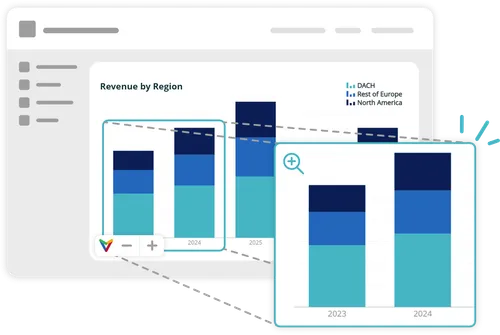
Don’t stop at a screenshot
Keep the quality and flexibility of your visualization instead of flattening your data into a static image.
Viewers can explore details more closely, and animated charts stay animated where supported.
-
Create your chart
Create and customize your chart in Vizzlo, PowerPoint, or Google Slides.
-
Copy the link
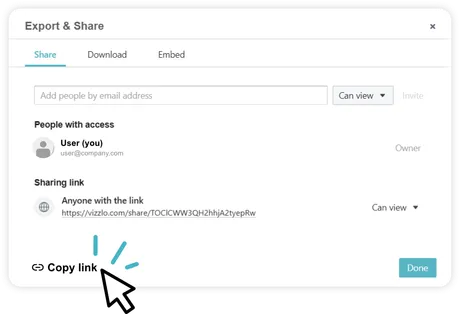
Open Export & Share and copy your sharing link.
-
Paste in Canva
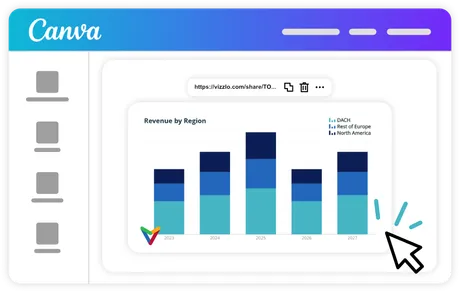
Paste the link into Canva to add your chart.
-
Keep it updated
Update the chart in Vizzlo — or let connected data sources refresh it automatically.