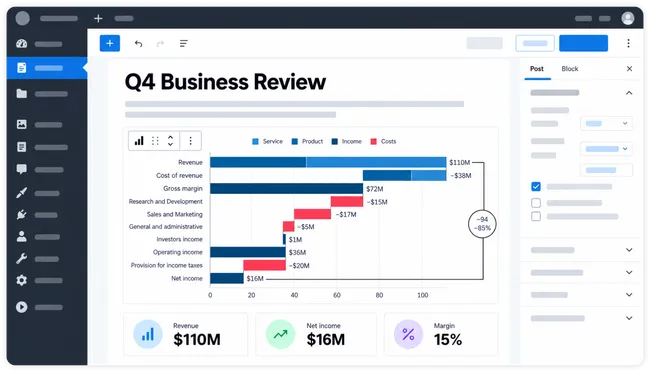
Make your content more informative and visual
Turn data into clear visuals that strengthen articles, reports, research, and other web content.
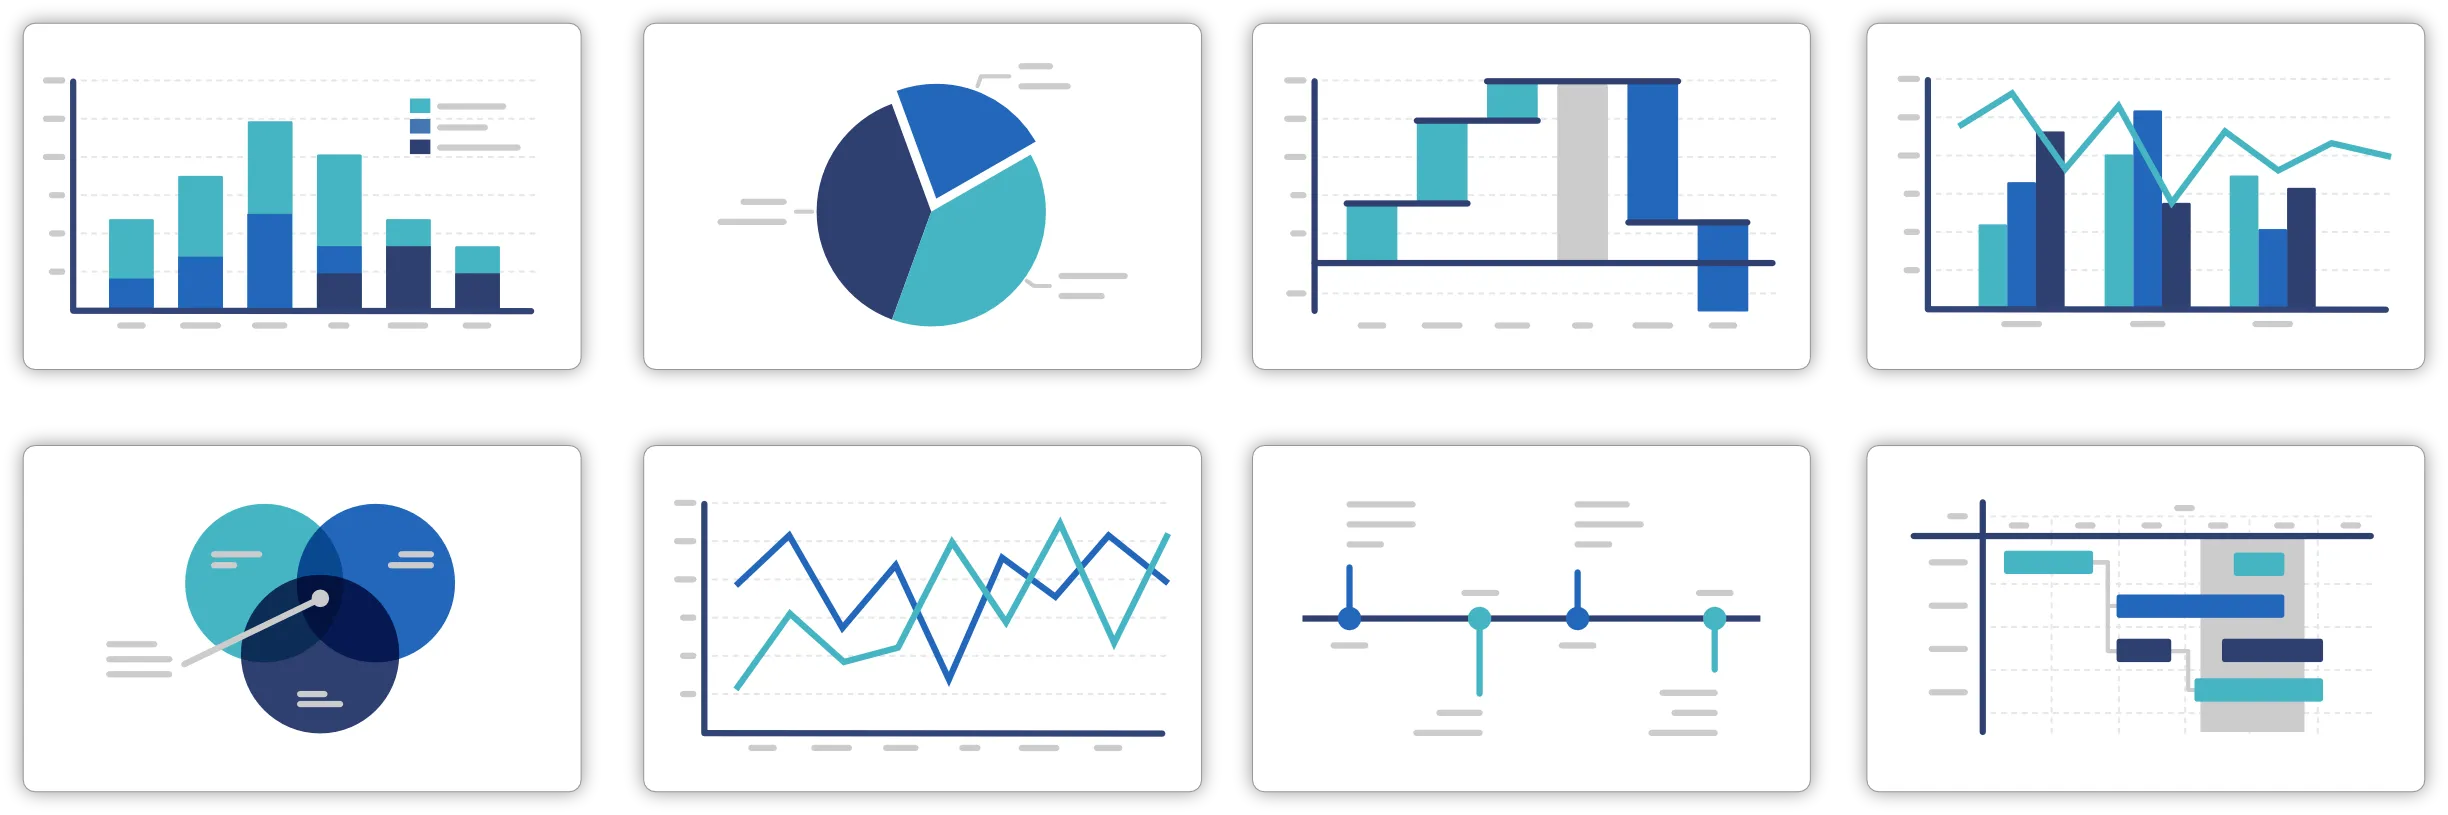
120+ professional chart types
Pick from 120+ chart types to explain trends, comparisons, timelines, rankings, and more.
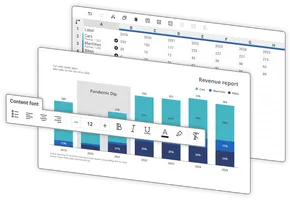
Create charts faster
Create professional charts without manually designing every graphic for your website.
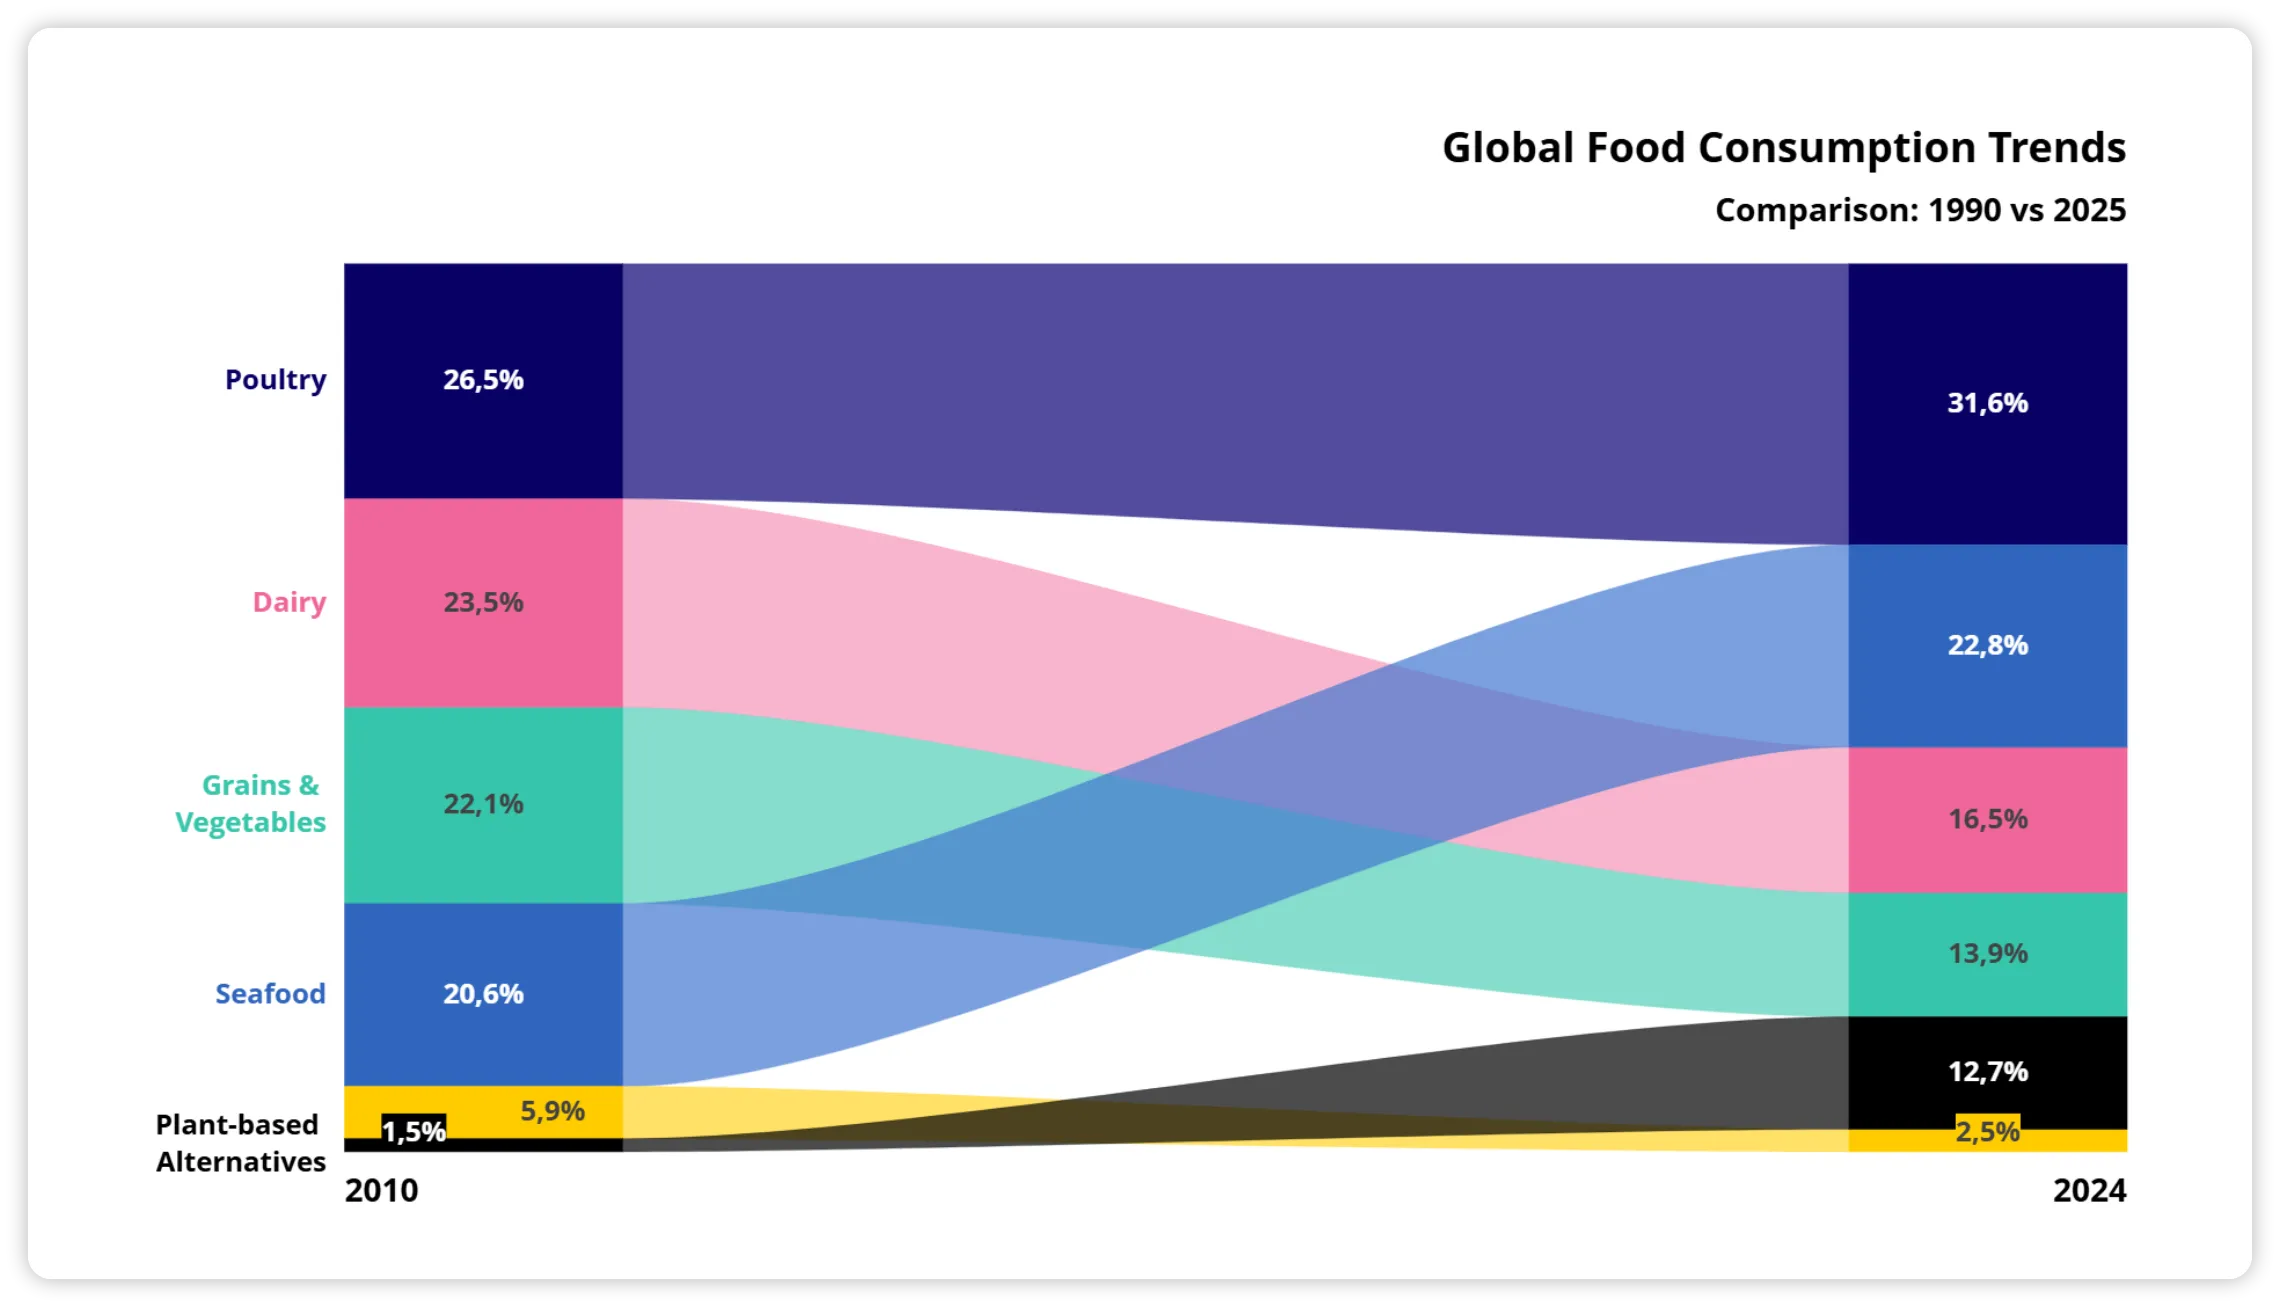
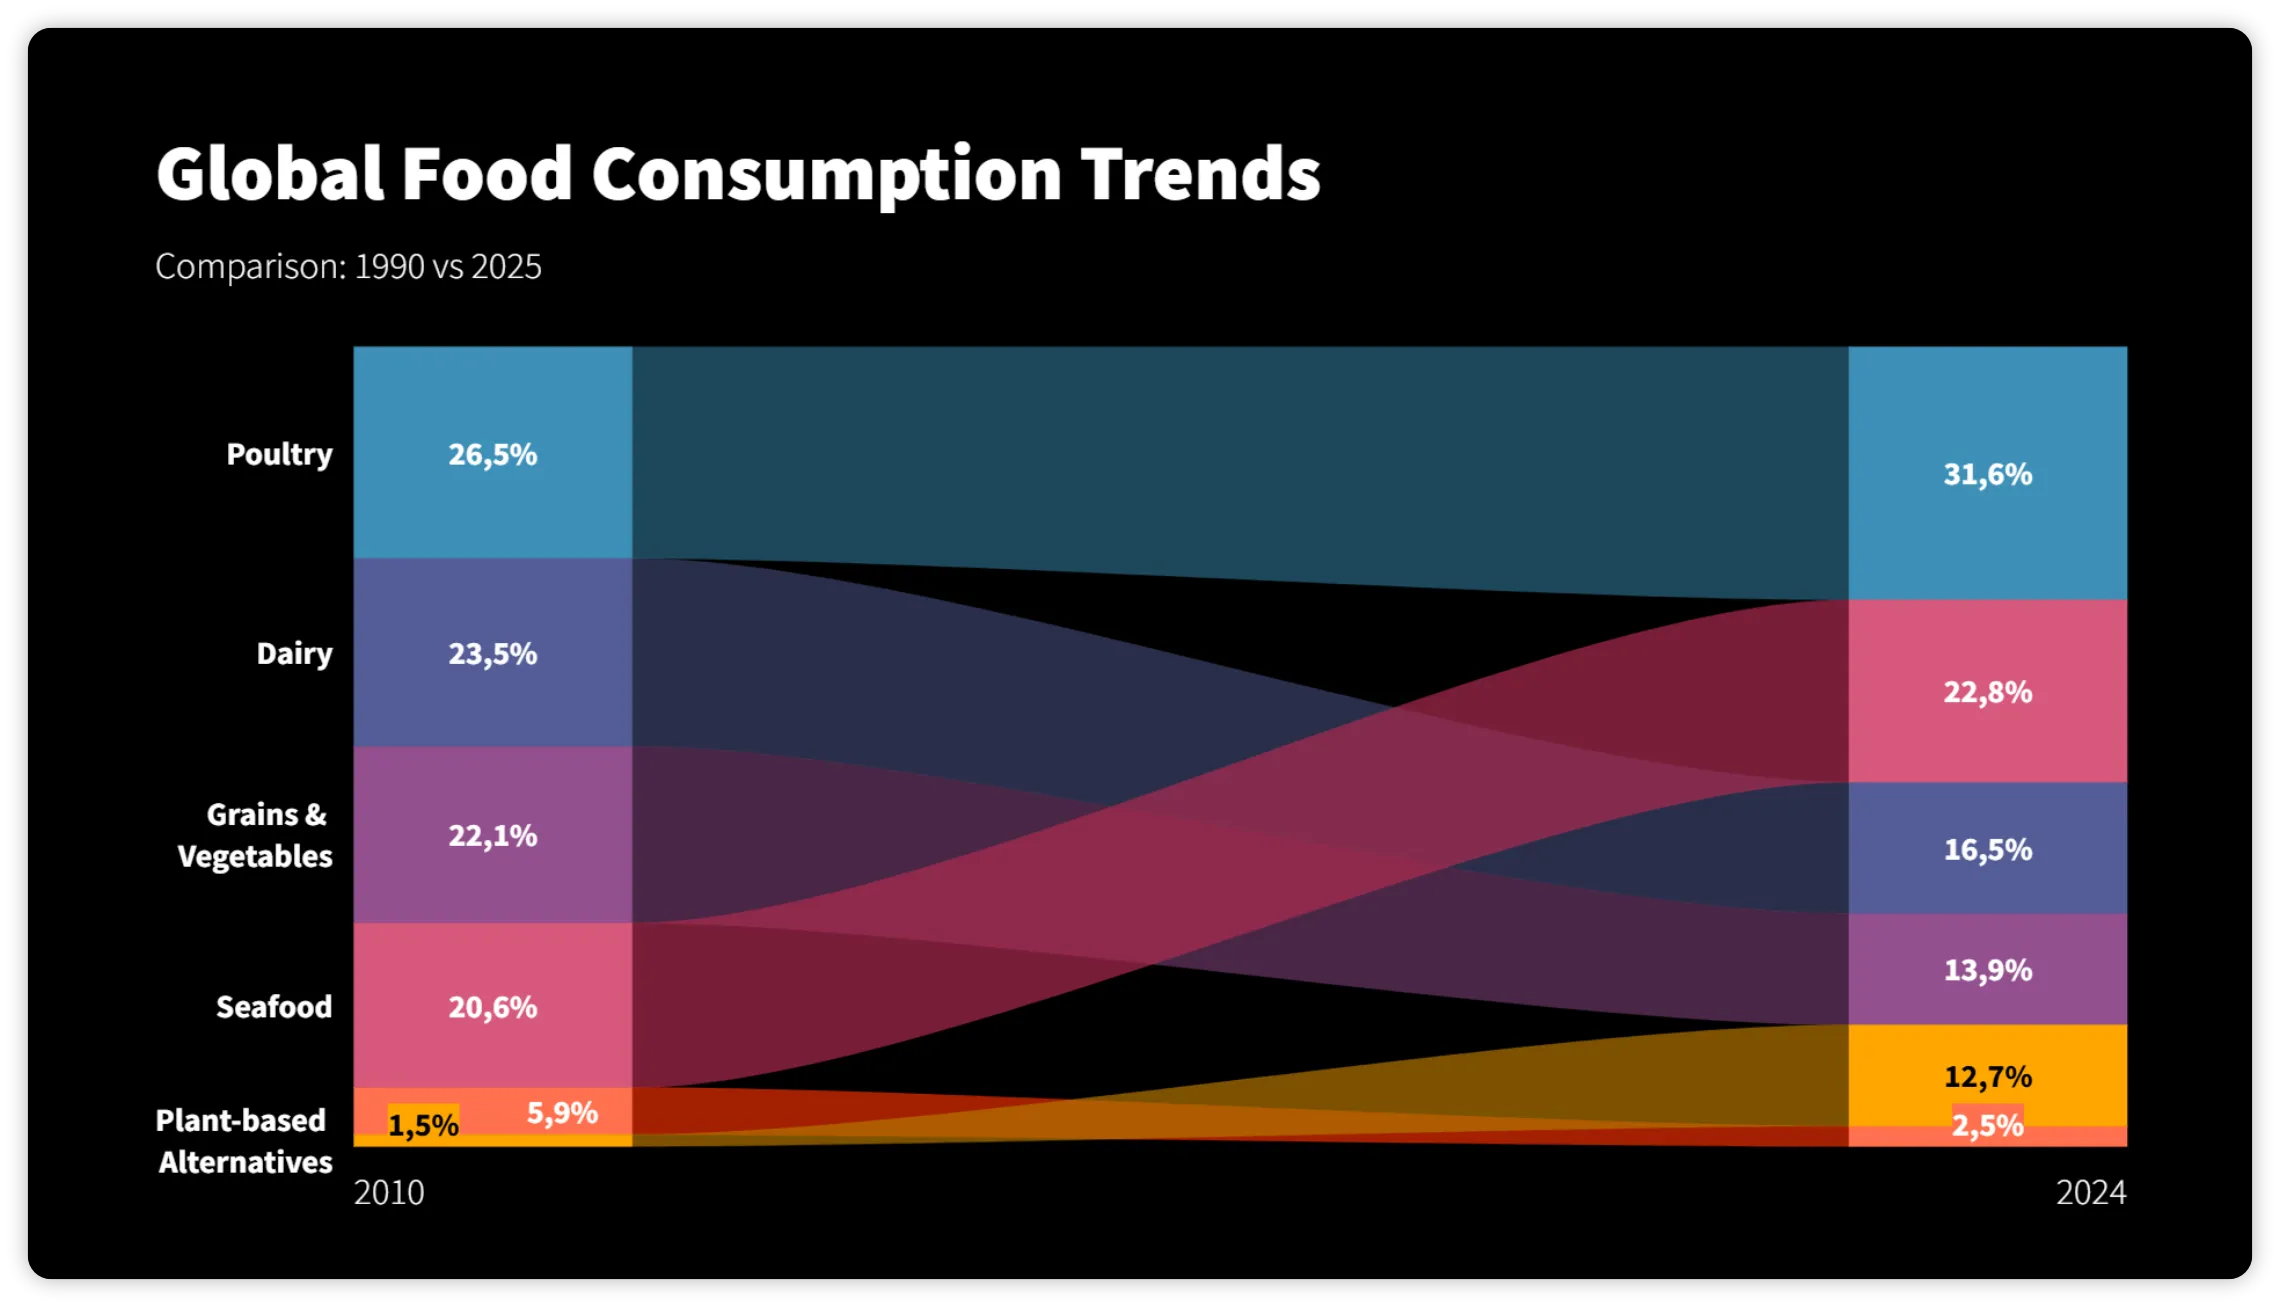
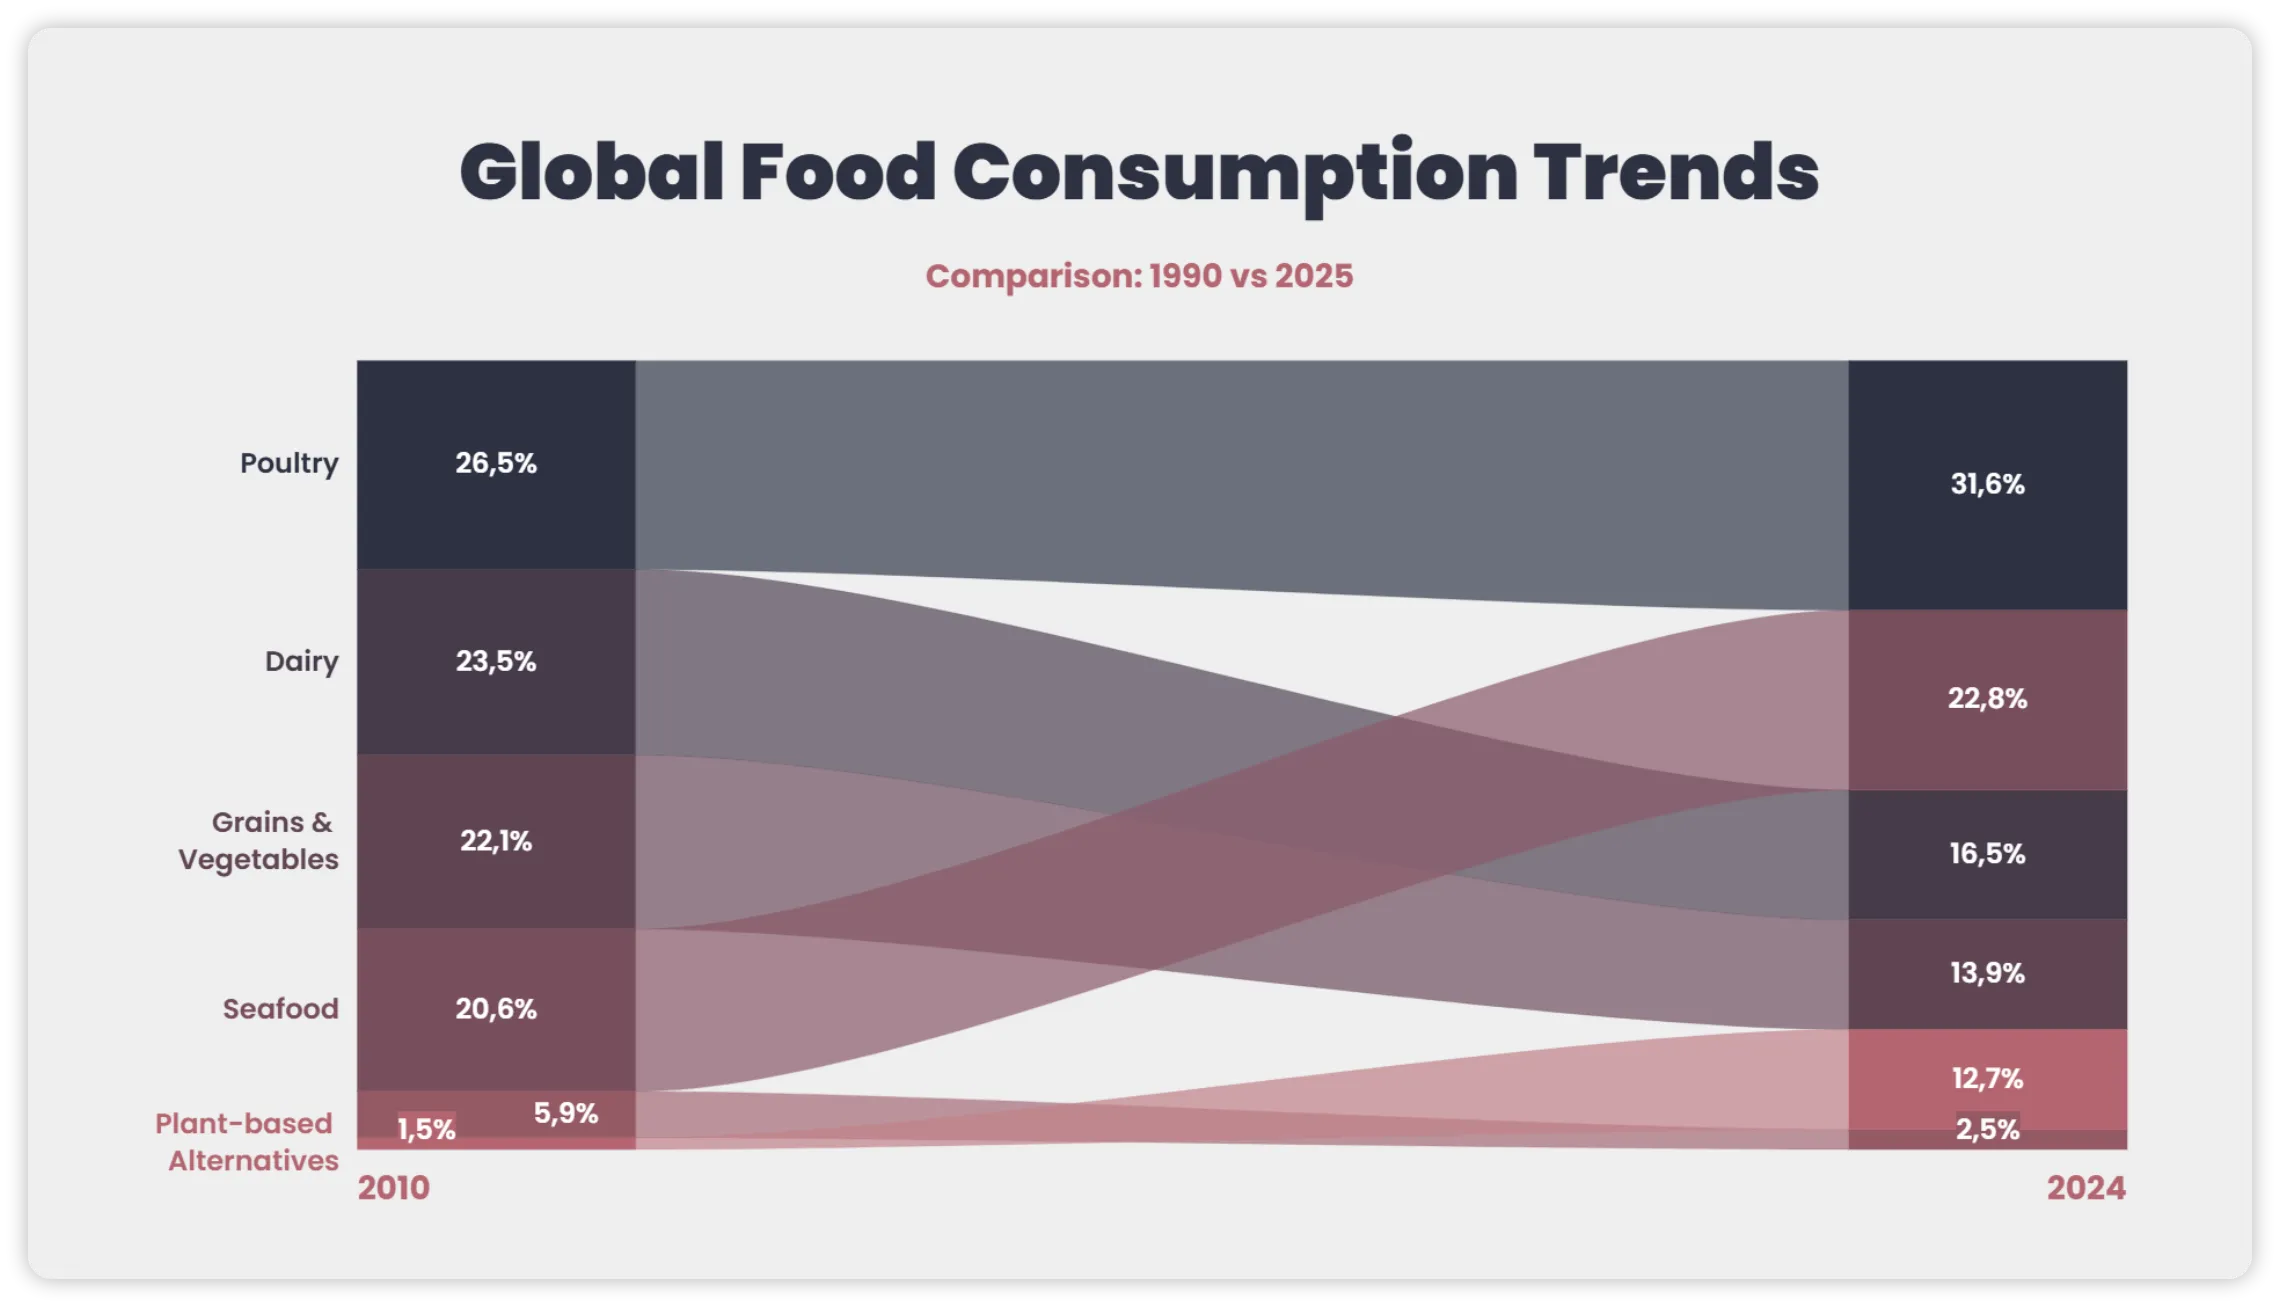
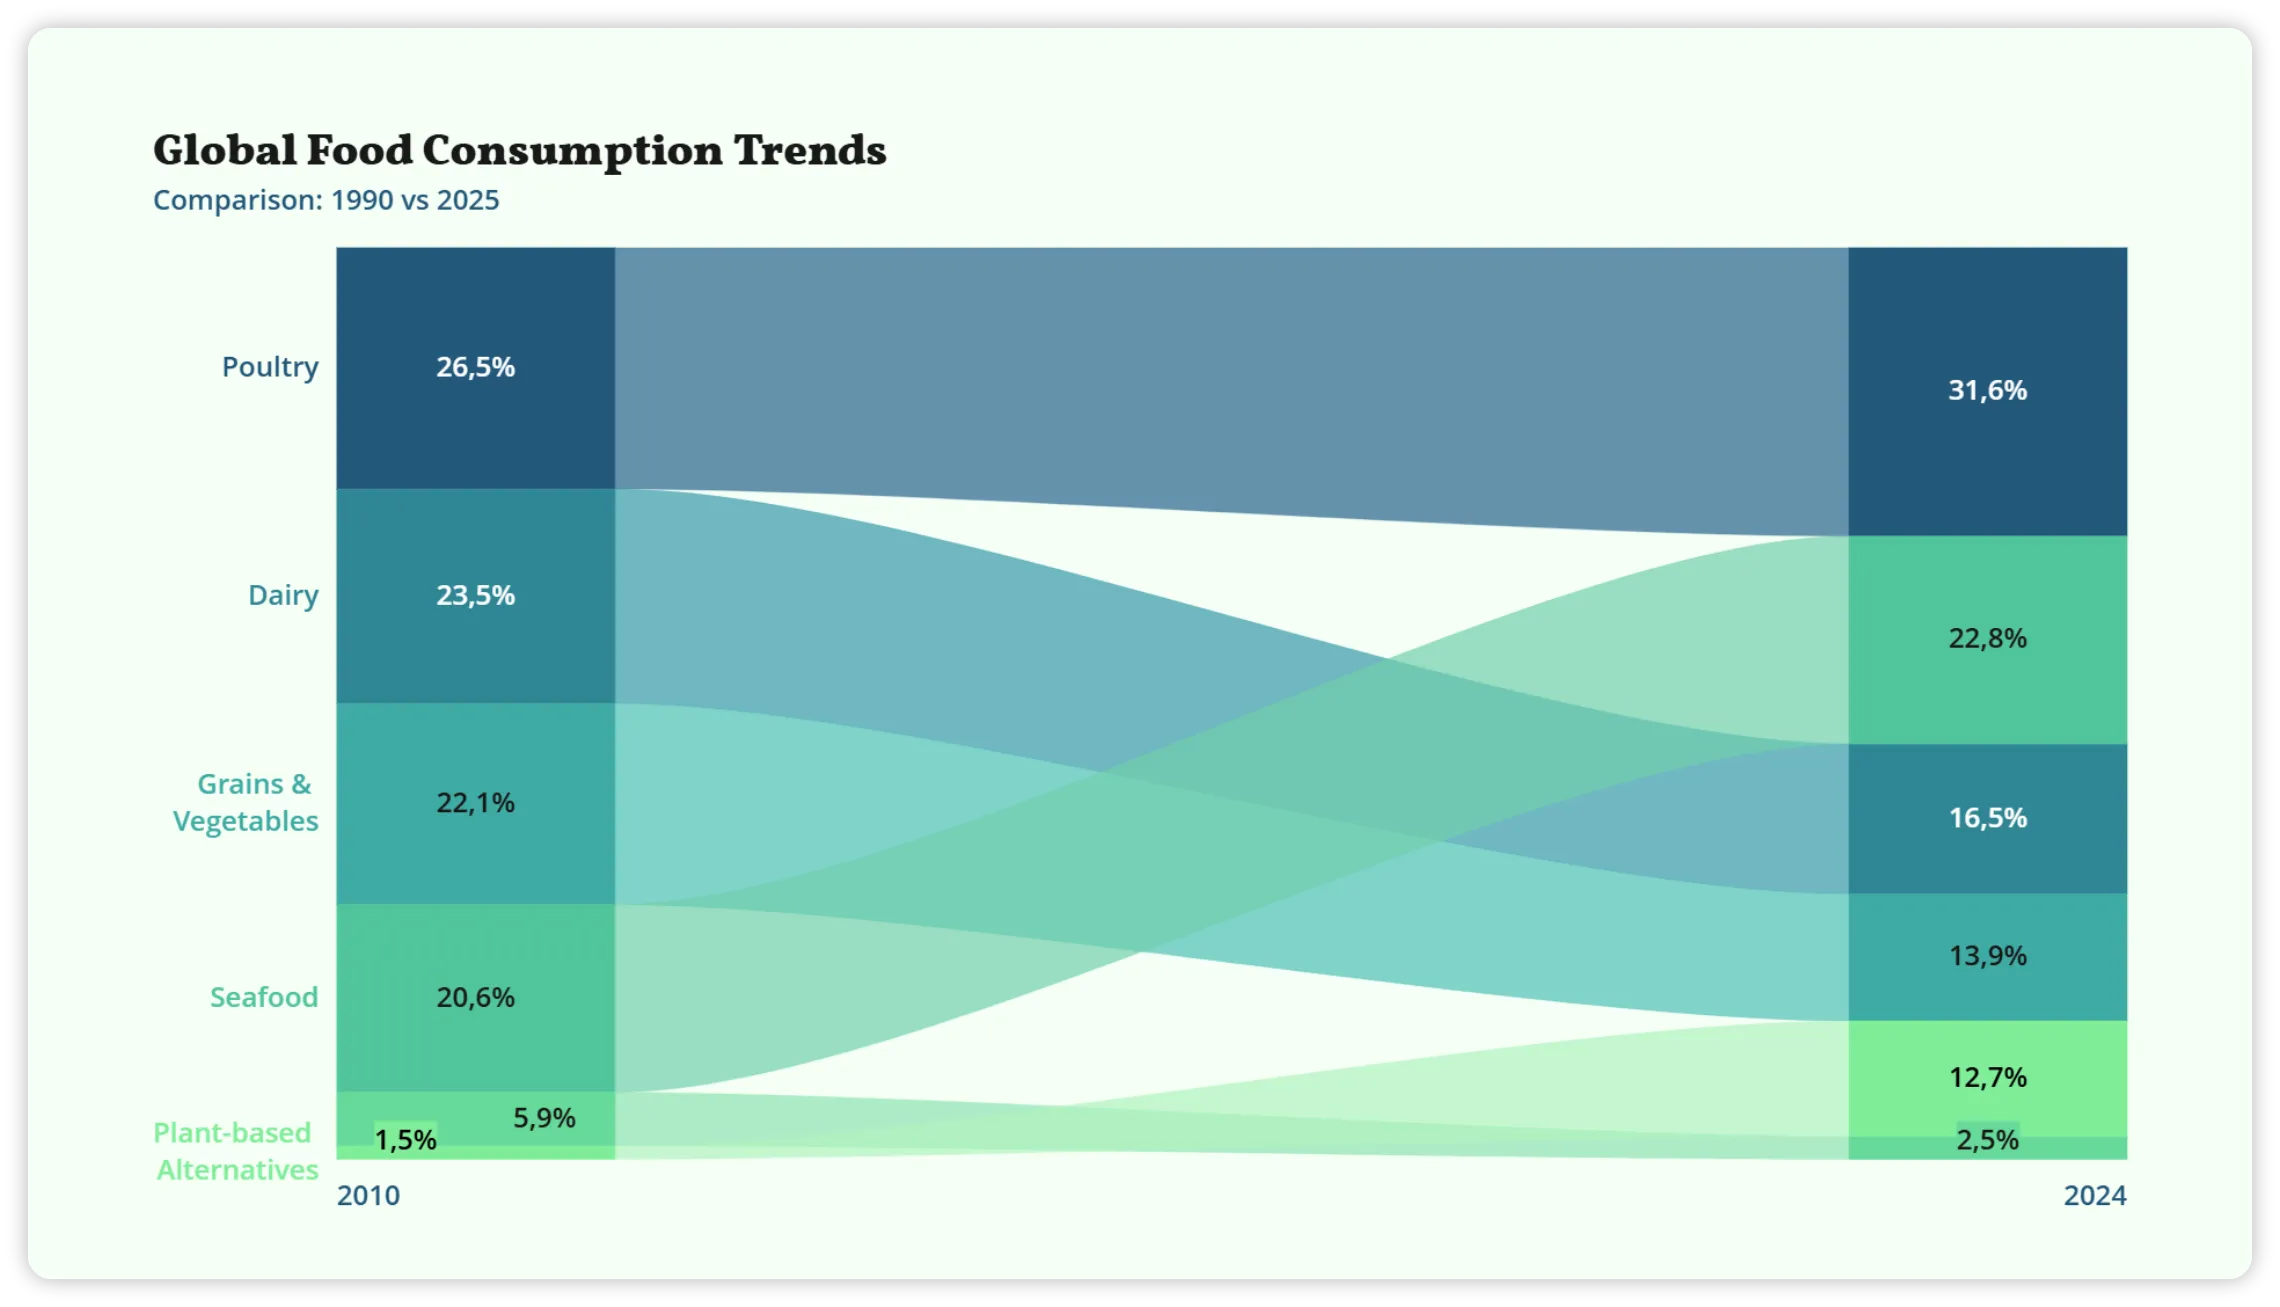
Keep every chart on brand
Customize colors, fonts, labels, and styles so your charts feel like a natural part of your WordPress content.
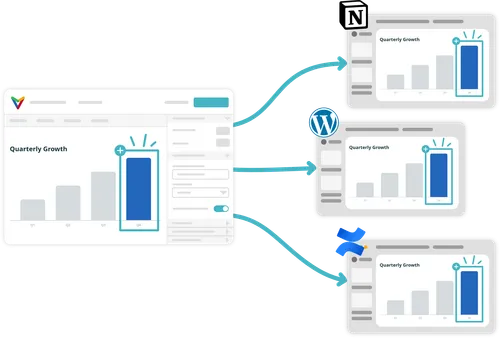
Keep published charts up to date
Update the chart in Vizzlo and keep the version on your WordPress site current — without uploading a new image every time the data changes.
Publish once. Reuse everywhere.
Use the same visualization across WordPress, Notion, Miro, Confluence, Canva, and more, while maintaining a single chart in Vizzlo.





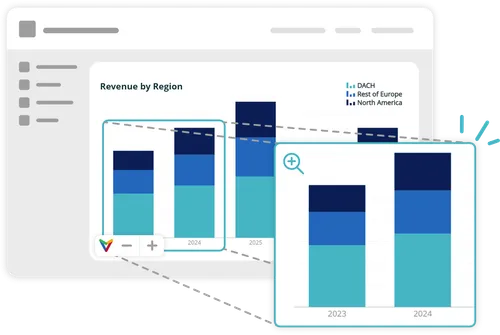
Go beyond static web graphics
Embedded charts stay sharp, dynamic, and easy to explore directly on the page.
Readers can zoom in for more detail, and animated charts stay animated where supported.
-
Create your chart
Create and customize your chart in Vizzlo, PowerPoint, or Google Slides.
-
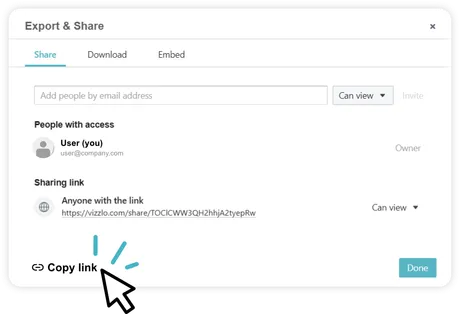
Copy the link
Open Export & Share and copy your sharing link.
-
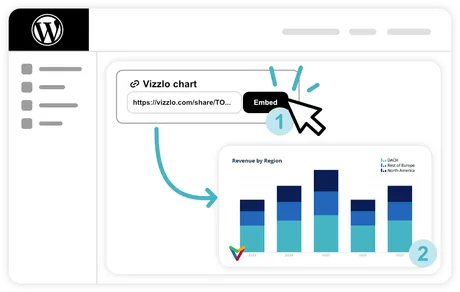
Paste in WordPress
Paste the link into WordPress to add your chart.
-
Keep it updated
Update the chart in Vizzlo — or let connected data sources refresh it automatically.