Turn complex information into clearer documentation
Use charts to make reports, project pages, research, and internal documentation easier to understand.
120+ professional chart types
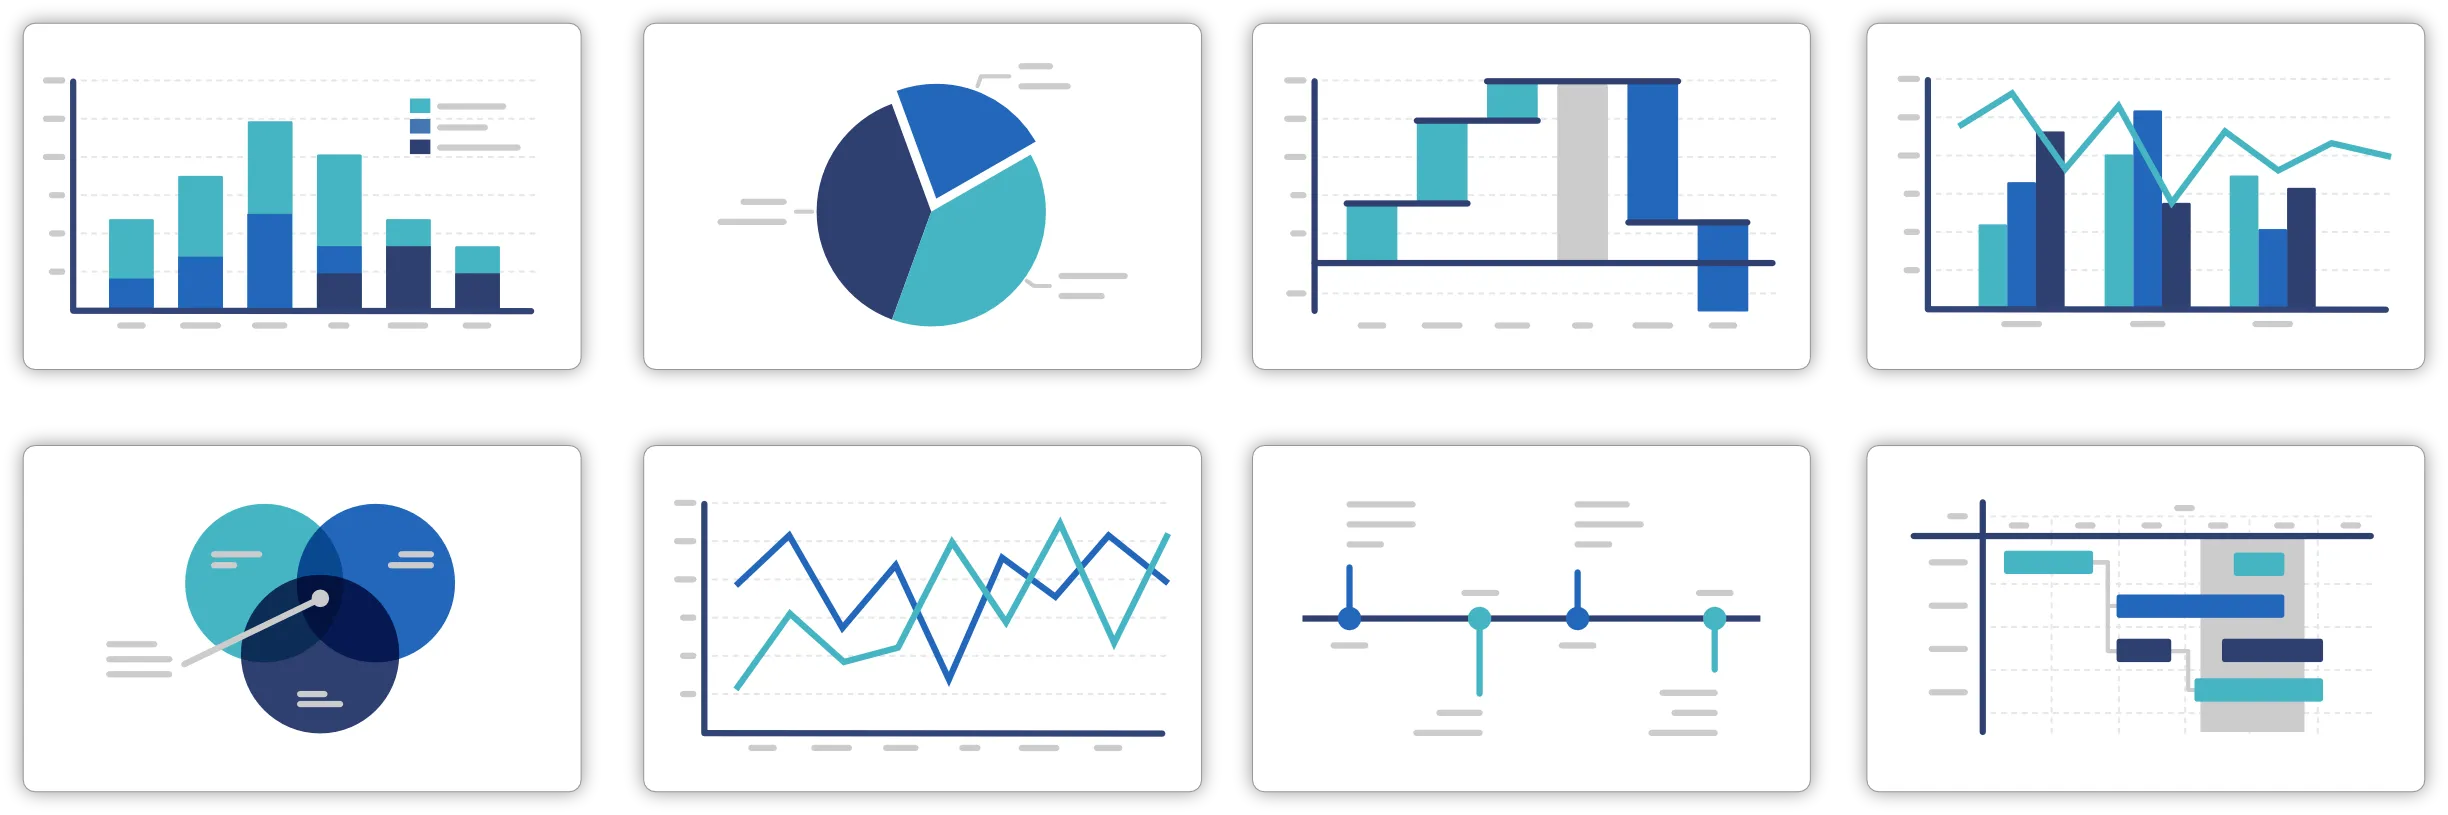
Choose from 120+ chart types to visualize trends, comparisons, timelines, processes, and more.
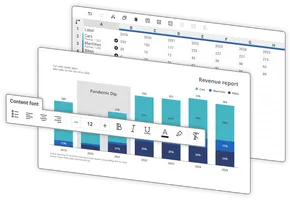
Create charts faster
Turn raw data into clear visuals that help teams understand progress and key insights faster.
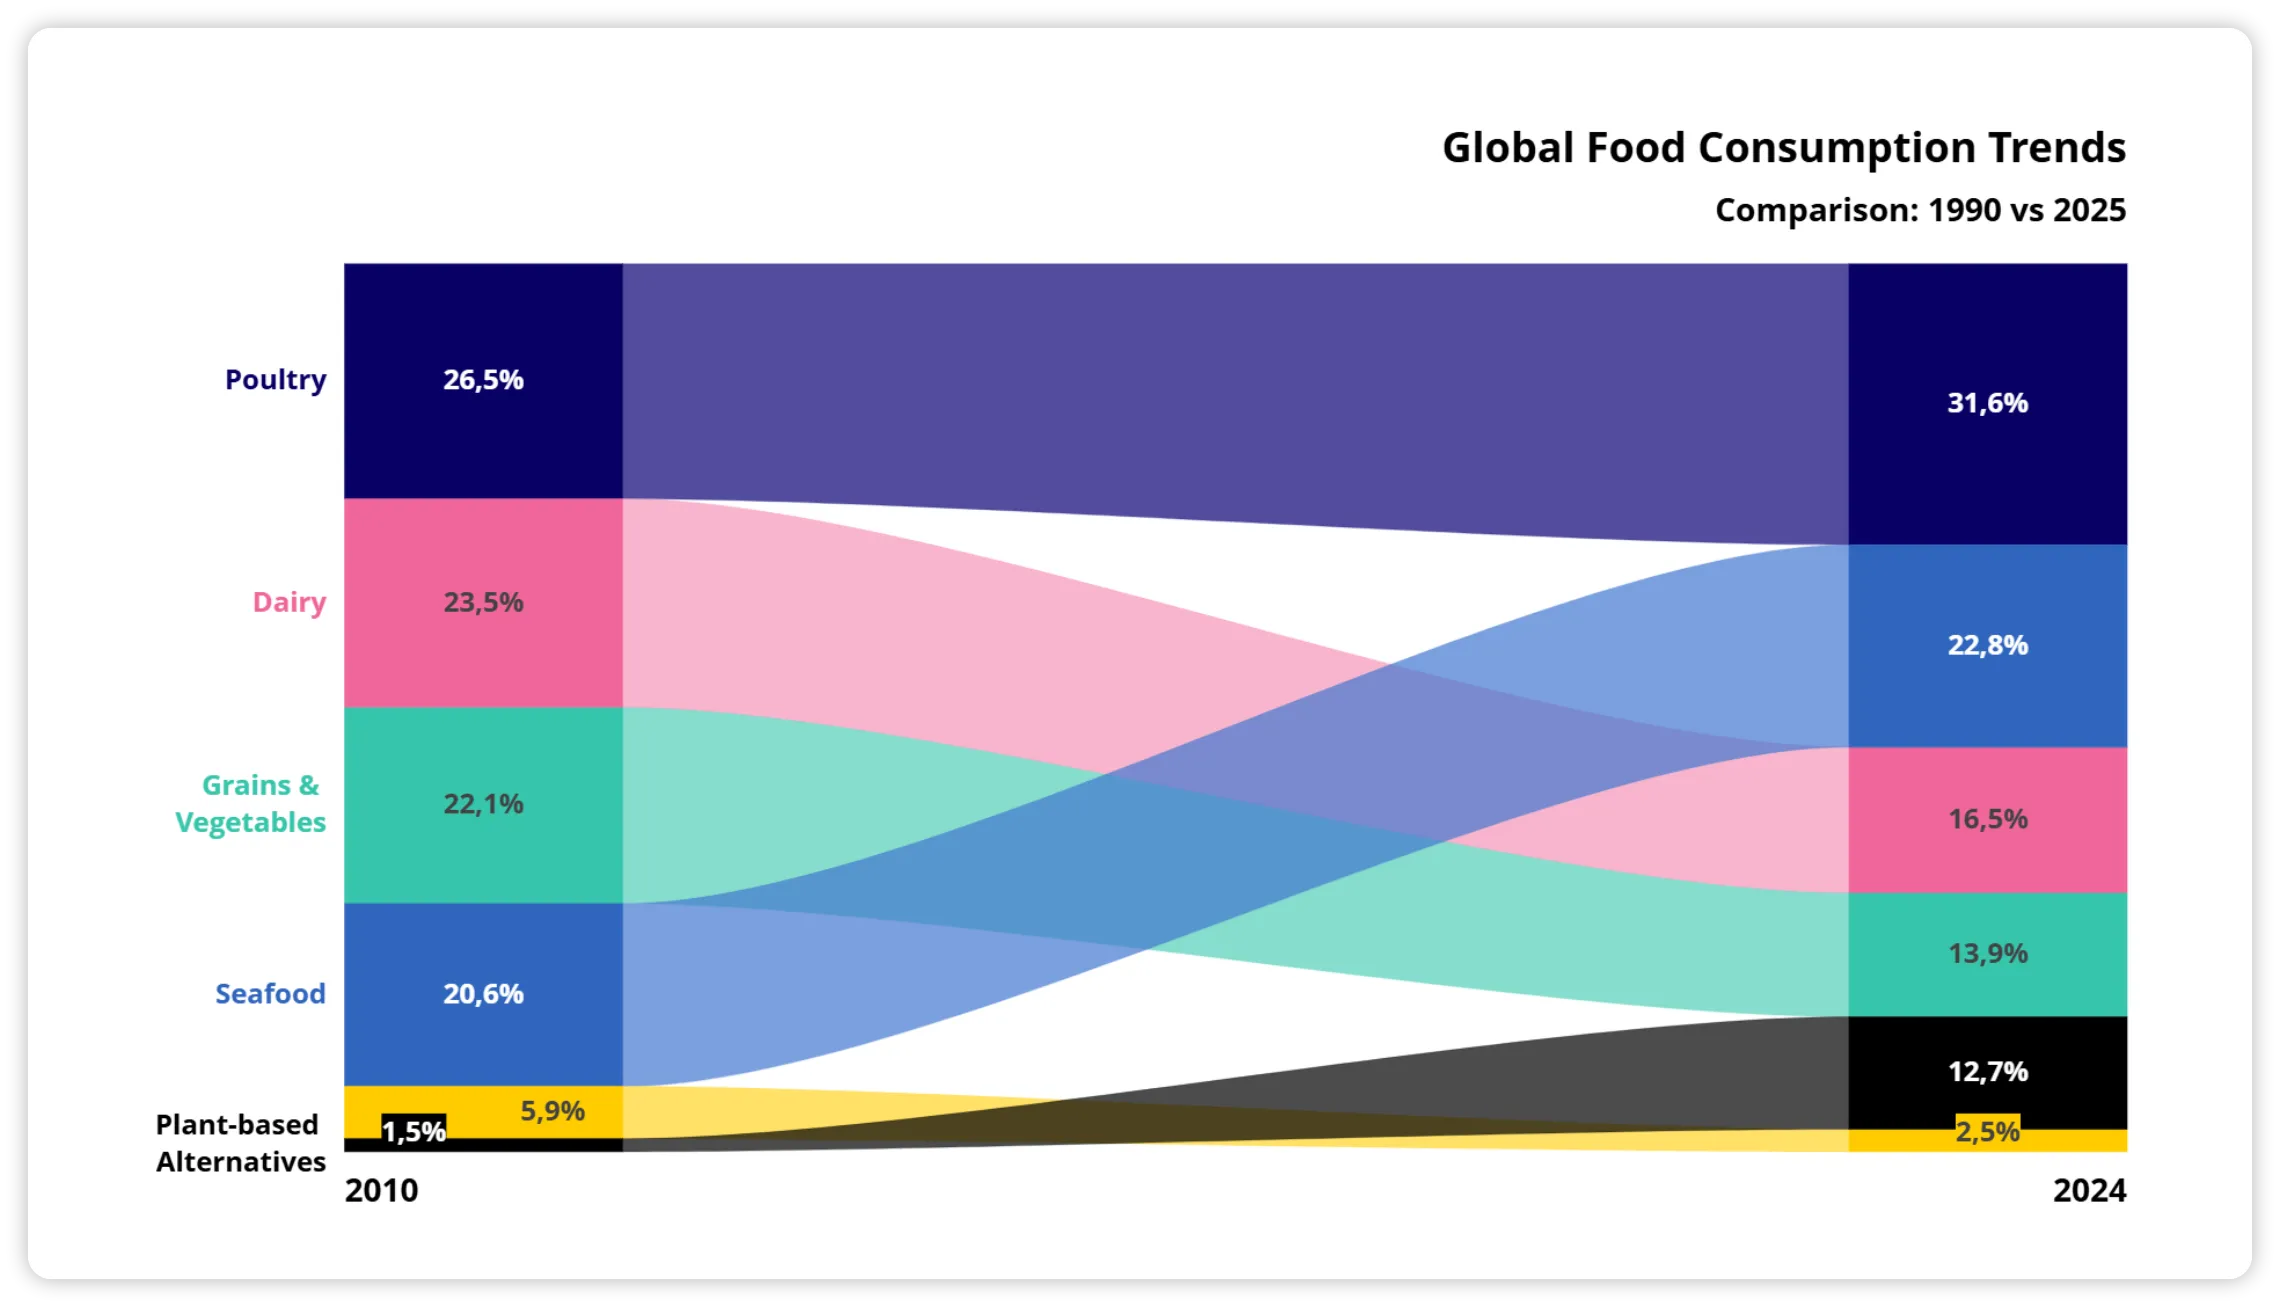
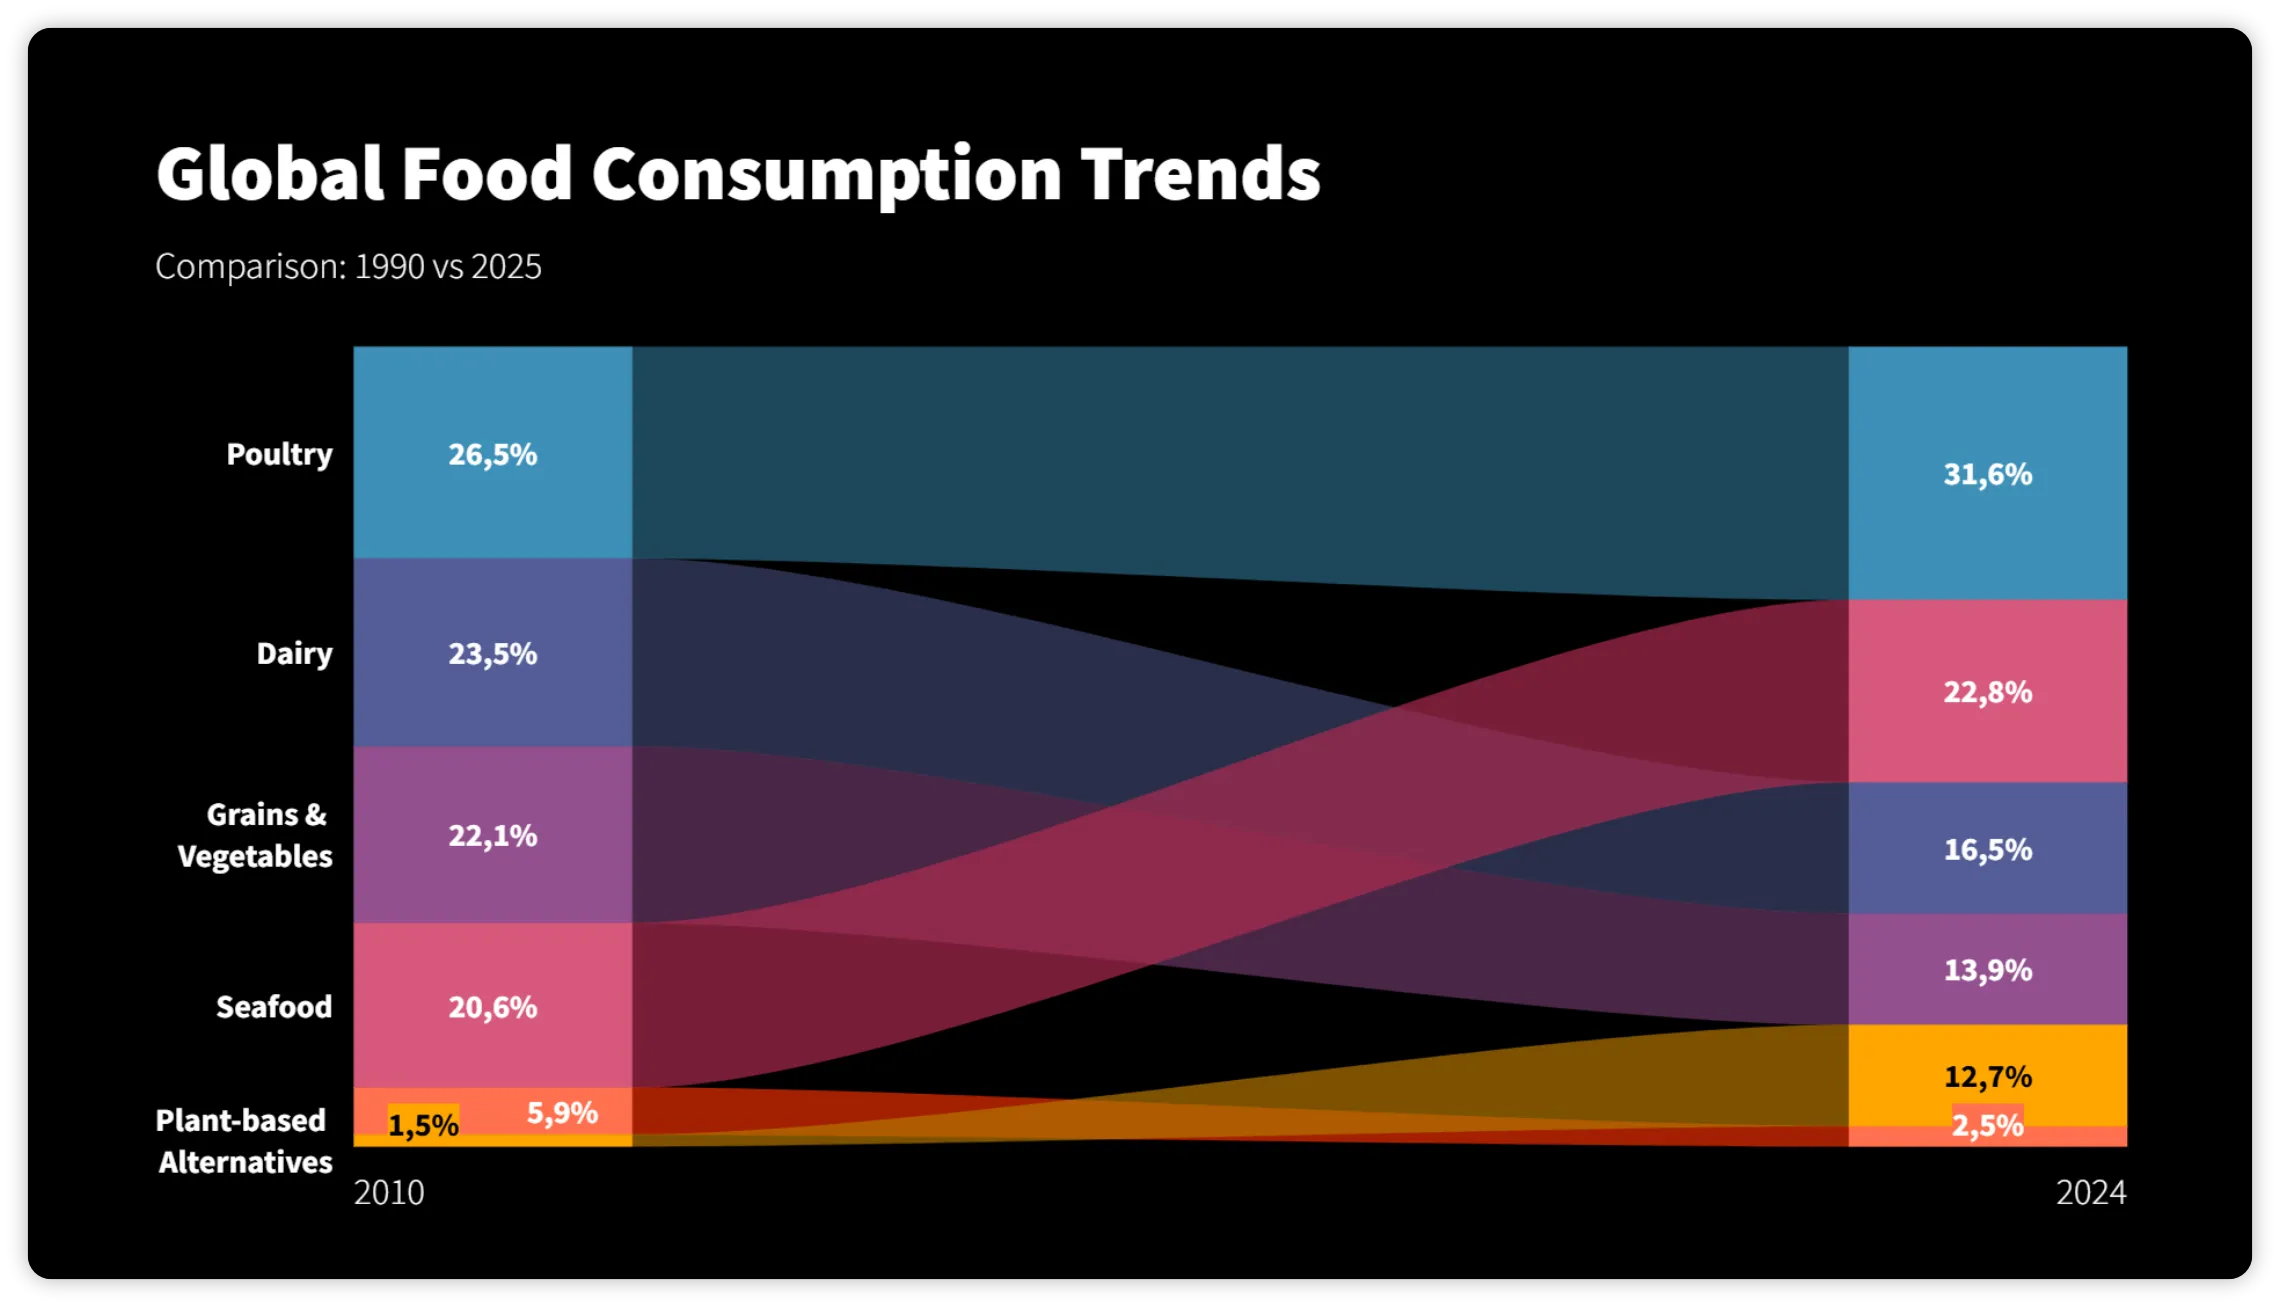
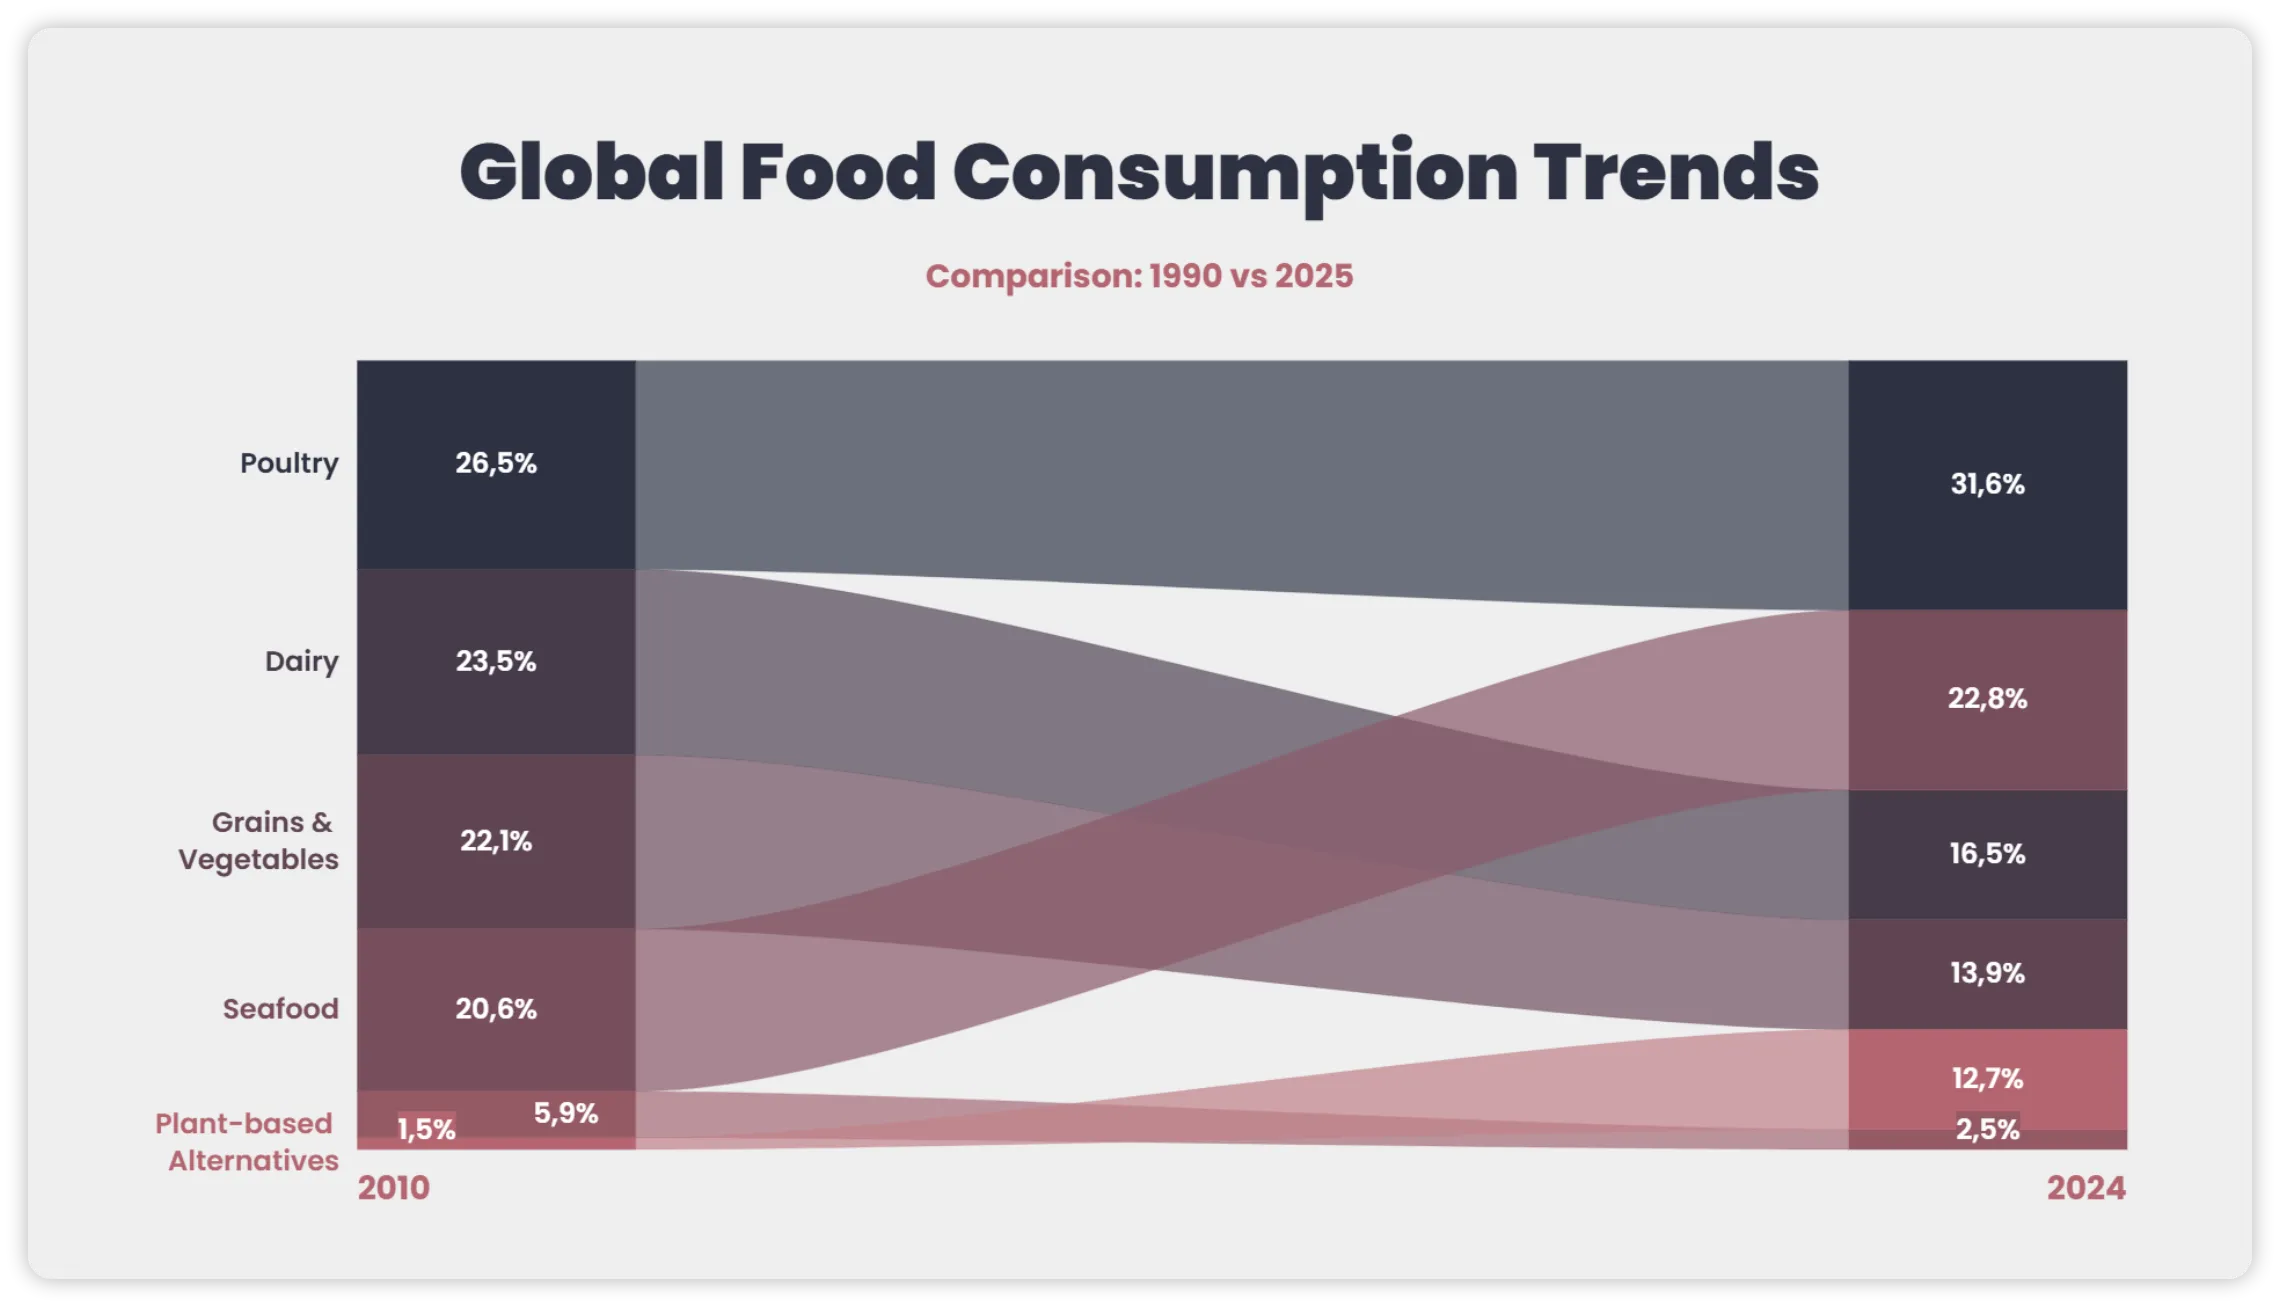
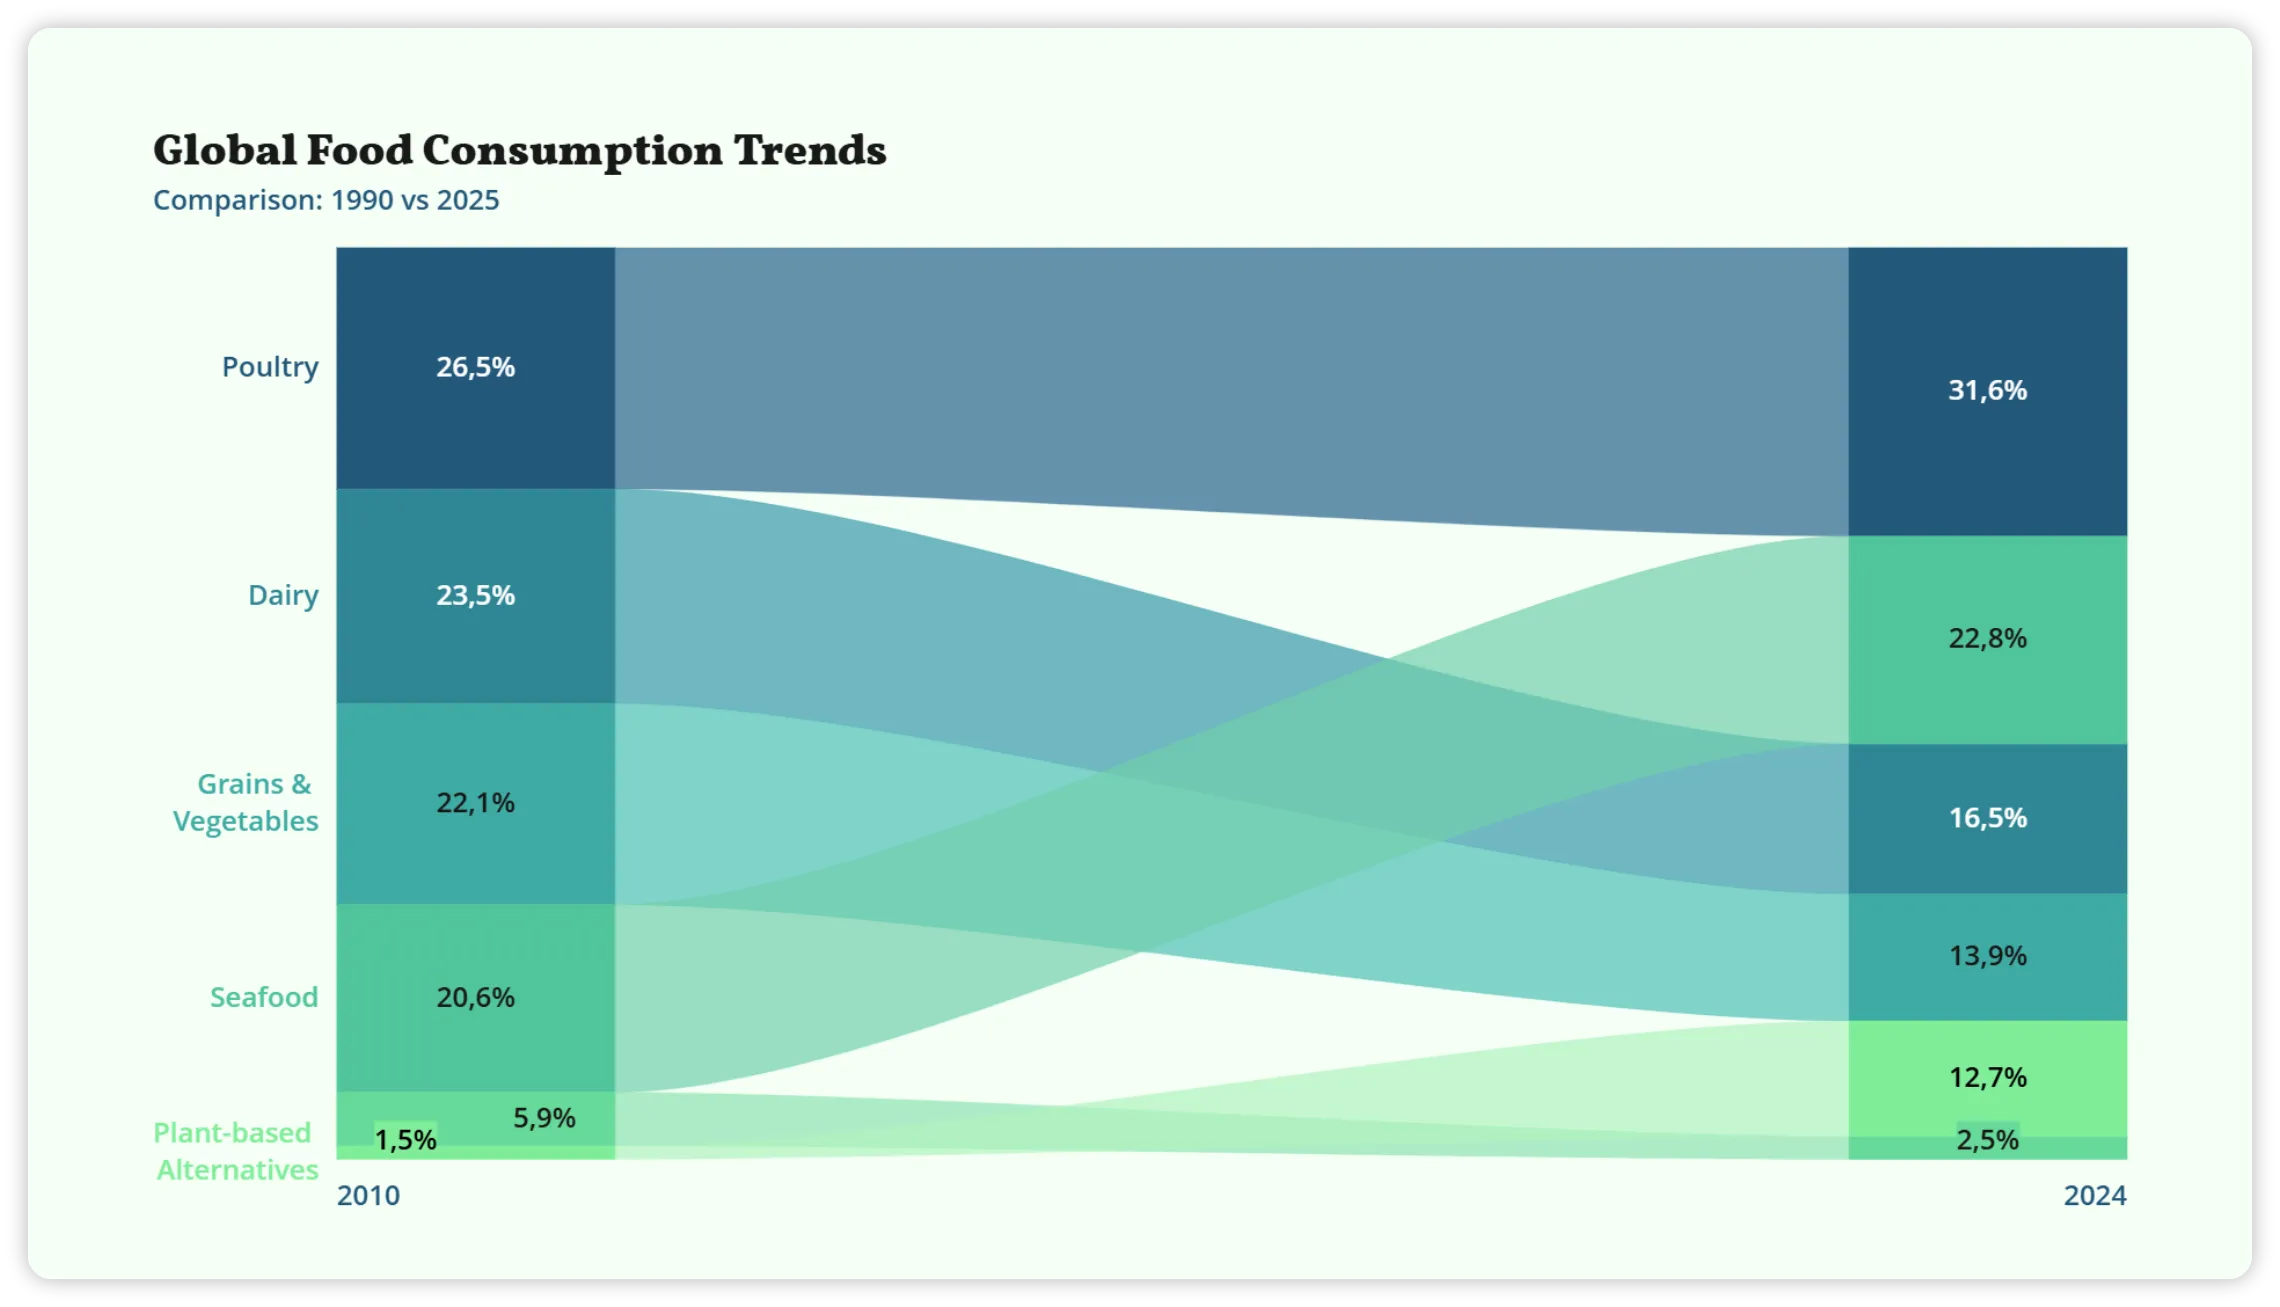
Keep every chart on brand
Customize colors, fonts, and styles so your charts match the look and structure of your team’s documentation.
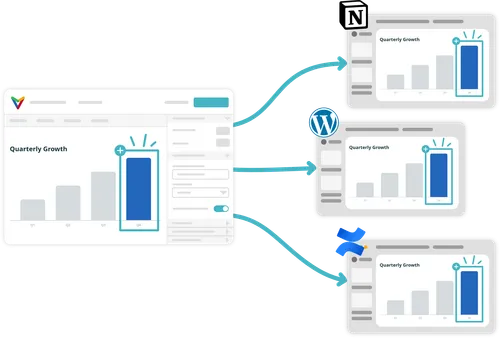
Keep project pages up to date
Update the chart in Vizzlo and keep the version in Confluence current — without replacing screenshots or rebuilding visuals every time the data changes.
Reuse the same chart across your workspace
Use one visualization across Confluence, Notion, Miro, Canva, WordPress, and more, while keeping a single chart to maintain.





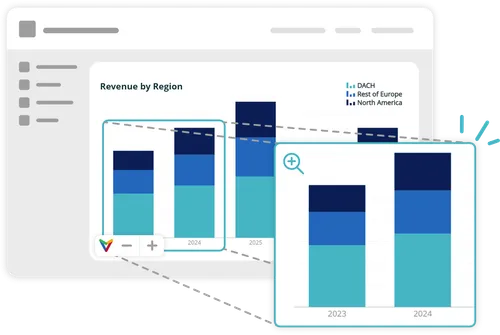
More than a static image
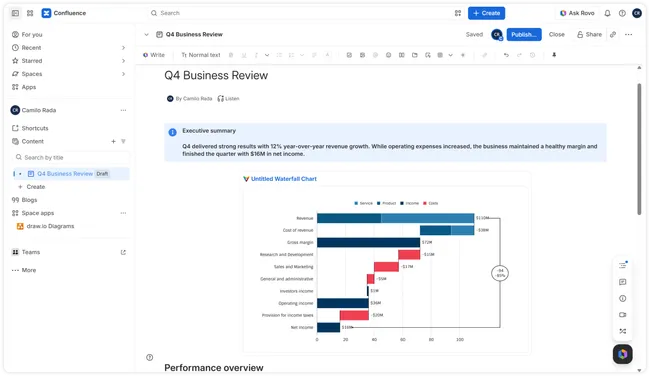
Embedded charts stay clear and easy to explore inside your Confluence pages.
Readers can zoom in for more detail, and animated charts remain dynamic where supported.
-
Create your chart
Create and customize your chart in Vizzlo, PowerPoint, or Google Slides.
-
Copy the link
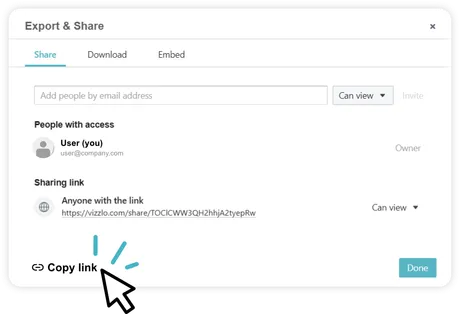
Open Export & Share and copy your sharing link.
-
Select Embed
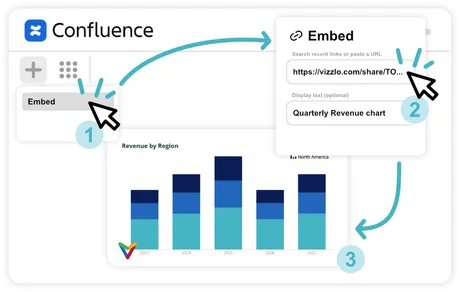
Click + and select Embed.
-
Add the link
Paste the link and optionally add display text.